San Joaquin County Investment Properties for Sale
Browse homes for sale and investment properties in San Joaquin County. Refine your search by price, property type, or more.
Best cash flowing properties in San Joaquin County
Active
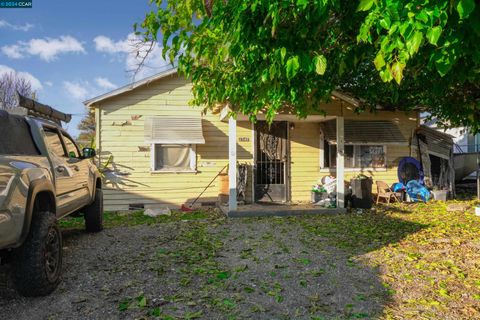
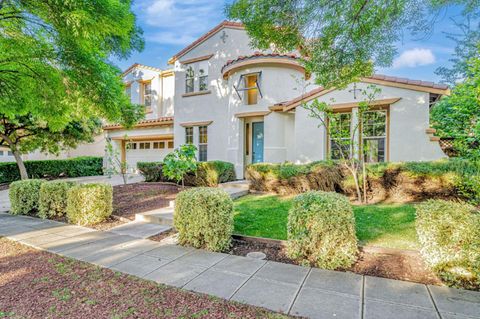
$145,000
2
bds
|
1
ba
|
840
sqft
|
built
1972
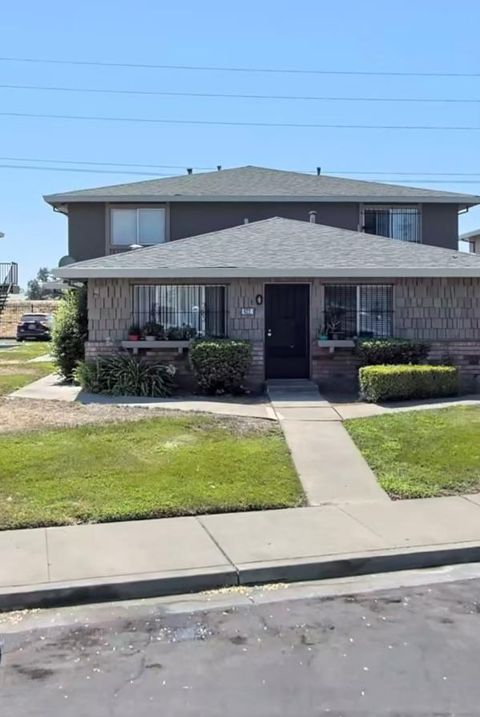
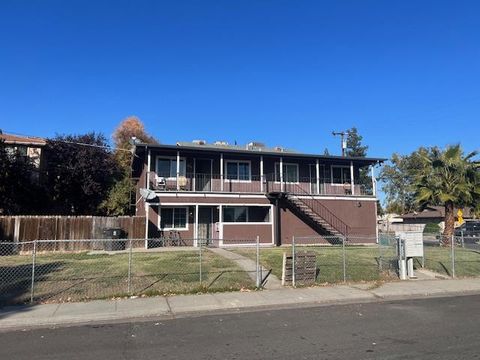
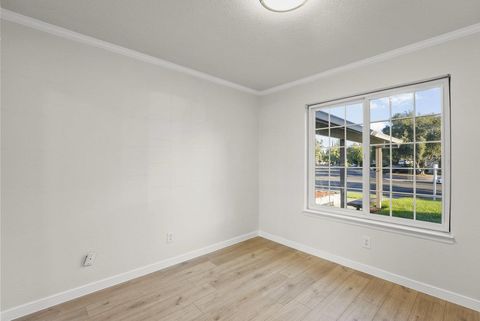
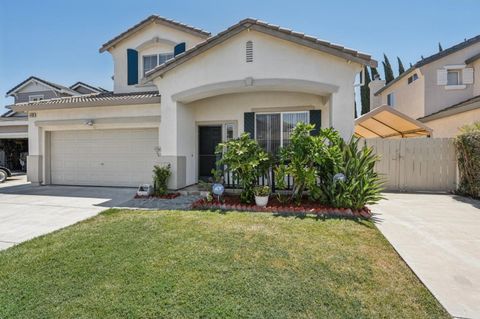
422 Caribrook Way, Stockton, CA 95207
$273
Cash flow
9.8%
Cash-on-Cash Return
8.5%
Cap rate
1.4%
Rent to Value Ratio
Active
$225,000
2
bds
|
1
ba
|
806
sqft
|
built
1969
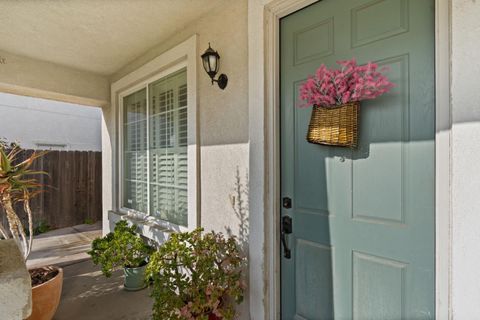
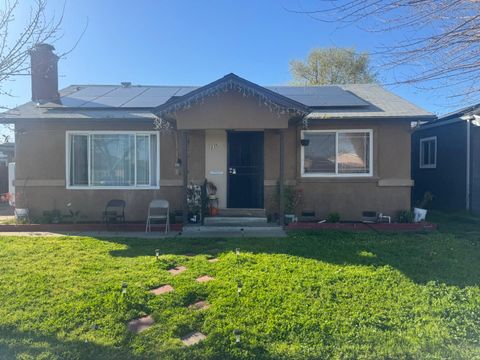
1707 W Swain Rd, Stockton, CA 95207
$-35
Cash flow
-0.8%
Cash-on-Cash Return
6.1%
Cap rate
0.9%
Rent to Value Ratio
63 out of 191 properties for sale in San Joaquin County
Limited Results Shown
Create a free account, or log in to reveal all property listings and enjoy the complete experience.
Active
$325,000
4
bds
|
2
ba
|
1,599
sqft
|
built
1930
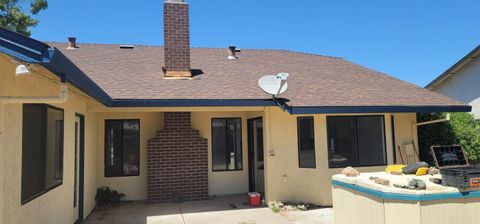
130 E Worth St, Stockton, CA 95206
$-317
Cash flow
-5.1%
Cash-on-Cash Return
5.1%
Cap rate
0.6%
Rent to Value Ratio
Active
$758,000
4
bds
|
3
ba
|
2,440
sqft
|
built
1996
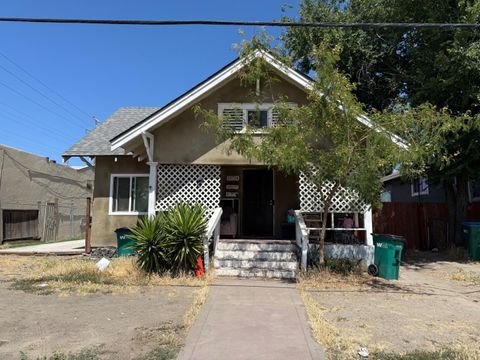
2090 Iroula Way, Tracy, CA 95377
$-1,749
Cash flow
-12.0%
Cash-on-Cash Return
3.5%
Cap rate
0.4%
Rent to Value Ratio
Active
$310,000
3
bds
|
1
ba
|
1,011
sqft
|
built
1950
1830 De Ovan Ave, Stockton, CA 95204
$-100
Cash flow
-1.7%
Cash-on-Cash Return
5.9%
Cap rate
0.7%
Rent to Value Ratio
Active
$489,000
4
bds
|
0
ba
|
1,891
sqft
|
built
1980
9321 Kirkby Ln, Stockton, CA 95210
$-1,380
Cash flow
-14.7%
Cash-on-Cash Return
2.9%
Cap rate
0.3%
Rent to Value Ratio

Active
$779,000
5
bds
|
3
ba
|
3,159
sqft
|
built
2000
1721 Treehaven Ln, Tracy, CA 95376
$-1,859
Cash flow
-12.5%
Cash-on-Cash Return
3.4%
Cap rate
0.4%
Rent to Value Ratio
Active
$468,000
3
bds
|
2
ba
|
1,092
sqft
|
built
1958
432 Cowell Ave, Manteca, CA 95336
$-649
Cash flow
-7.2%
Cash-on-Cash Return
4.6%
Cap rate
0.6%
Rent to Value Ratio
Active
$599,999
6
bds
|
0
ba
|
2,592
sqft
|
built
1977
8829 Kelley Dr, Stockton, CA 95209
$-2,235
Cash flow
-19.4%
Cash-on-Cash Return
1.8%
Cap rate
0.2%
Rent to Value Ratio
Active
$500,000
6
bds
|
0
ba
|
2,450
sqft
|
built
1979
2915 Pixie Dr, Stockton, CA 95203
$-1,506
Cash flow
-15.7%
Cash-on-Cash Return
2.6%
Cap rate
0.3%
Rent to Value Ratio
Active
$558,888
4
bds
|
2
ba
|
1,966
sqft
|
built
2004
9042 Chianti Cir, Stockton, CA 95212
$-1,124
Cash flow
-10.5%
Cash-on-Cash Return
3.9%
Cap rate
0.5%
Rent to Value Ratio

Active
$675,000
3
bds
|
2
ba
|
1,490
sqft
|
built
2000
2011 Superior Ct, Tracy, CA 95304
$-1,727
Cash flow
-13.3%
Cash-on-Cash Return
3.2%
Cap rate
0.4%
Rent to Value Ratio
Active
$528,888
3
bds
|
2
ba
|
1,440
sqft
|
built
1986
1014 Croyden Way, Manteca, CA 95336
$-1,036
Cash flow
-10.2%
Cash-on-Cash Return
3.9%
Cap rate
0.5%
Rent to Value Ratio
Active
$649,995
3
bds
|
3
ba
|
1,467
sqft
|
built
2022
182 E Mc Clintock Ln, Mountain House, CA 95391
$-1,446
Cash flow
-11.6%
Cash-on-Cash Return
3.4%
Cap rate
0.4%
Rent to Value Ratio

Active
$679,000
4
bds
|
3
ba
|
1,726
sqft
|
built
1998
56 Lavender Ct, Tracy, CA 95376
$-1,544
Cash flow
-11.9%
Cash-on-Cash Return
3.5%
Cap rate
0.4%
Rent to Value Ratio
Active
$459,998
3
bds
|
2
ba
|
1,552
sqft
|
built
1980
2958 Chauncy Cir, Stockton, CA 95209
$-470
Cash flow
-5.3%
Cash-on-Cash Return
5.0%
Cap rate
0.6%
Rent to Value Ratio
Active
$650,000
5
bds
|
4
ba
|
3,156
sqft
|
built
2003
354 Vasconcellos Ave, Manteca, CA 95336
$-1,185
Cash flow
-9.5%
Cash-on-Cash Return
4.1%
Cap rate
0.5%
Rent to Value Ratio
Active
$585,000
3
bds
|
2
ba
|
1,822
sqft
|
built
1985
396 Lancaster Dr, Manteca, CA 95336
$-1,053
Cash flow
-9.4%
Cash-on-Cash Return
4.1%
Cap rate
0.5%
Rent to Value Ratio
Active
$420,000
5
bds
|
0
ba
|
1,660
sqft
|
built
1915
1272 N Airport Way, Stockton, CA 95205
$-1,227
Cash flow
-15.2%
Cash-on-Cash Return
2.8%
Cap rate
0.3%
Rent to Value Ratio
Active
$749,500
4
bds
|
3
ba
|
2,443
sqft
|
built
2001
1460 Kyle Ct, Tracy, CA 95377
$-1,758
Cash flow
-12.2%
Cash-on-Cash Return
3.4%
Cap rate
0.4%
Rent to Value Ratio

Active
$799,000
4
bds
|
3
ba
|
2,136
sqft
|
built
2005
61 W Belleza Ln, Mountain House, CA 95391
$-1,981
Cash flow
-12.9%
Cash-on-Cash Return
3.1%
Cap rate
0.4%
Rent to Value Ratio
Active
$549,000
2
bds
|
0
ba
|
1,020
sqft
|
built
1946
2351 N Funston Ave, Stockton, CA 95205
$-1,624
Cash flow
-15.4%
Cash-on-Cash Return
2.7%
Cap rate
0.3%
Rent to Value Ratio
Active
$660,000
4
bds
|
2
ba
|
1,718
sqft
|
built
2020
1630 Red Ribbons Ln, Manteca, CA 95337
$-1,514
Cash flow
-12.0%
Cash-on-Cash Return
3.5%
Cap rate
0.4%
Rent to Value Ratio
Active
$570,000
5
bds
|
3
ba
|
2,590
sqft
|
built
2003
1831 Oakley Ct, Stockton, CA 95206
$-975
Cash flow
-8.9%
Cash-on-Cash Return
4.2%
Cap rate
0.5%
Rent to Value Ratio
Active
$825,000
4
bds
|
4
ba
|
2,841
sqft
|
built
2021
17516 Gemini Ct, Lathrop, CA 95330
$-2,099
Cash flow
-13.3%
Cash-on-Cash Return
3.2%
Cap rate
0.4%
Rent to Value Ratio
Active
$495,000
4
bds
|
3
ba
|
1,969
sqft
|
built
2004
2622 Keyser Dr, Stockton, CA 95212
$-780
Cash flow
-8.2%
Cash-on-Cash Return
4.3%
Cap rate
0.5%
Rent to Value Ratio
Active
$579,000
6
bds
|
0
ba
|
2,340
sqft
|
built
1979
8116 Montgomery Ave, Stockton, CA 95209
$-1,548
Cash flow
-13.9%
Cash-on-Cash Return
2.9%
Cap rate
0.3%
Rent to Value Ratio
Active
$549,999
3
bds
|
2
ba
|
1,633
sqft
|
built
2012
2491 Redbud Way, Manteca, CA 95336
$-832
Cash flow
-7.9%
Cash-on-Cash Return
4.3%
Cap rate
0.6%
Rent to Value Ratio

Active
$650,000
4
bds
|
3
ba
|
1,940
sqft
|
built
2008
1735 Bermuda Pl, Manteca, CA 95337
$-1,392
Cash flow
-11.2%
Cash-on-Cash Return
3.7%
Cap rate
0.4%
Rent to Value Ratio
Active
$300,000
4
bds
|
1
ba
|
1,121
sqft
|
built
1947
2347 E Alpine Ave, Stockton, CA 95205
$-186
Cash flow
-3.2%
Cash-on-Cash Return
5.5%
Cap rate
0.7%
Rent to Value Ratio
Active
$649,000
3
bds
|
3
ba
|
1,841
sqft
|
built
2016
1141 Navigator Dr, Lathrop, CA 95330
$-1,350
Cash flow
-10.9%
Cash-on-Cash Return
3.6%
Cap rate
0.4%
Rent to Value Ratio

Active
$679,999
5
bds
|
3
ba
|
2,385
sqft
|
built
2012
700 Red Barn Pl, Lathrop, CA 95330
$-1,342
Cash flow
-10.3%
Cash-on-Cash Return
3.9%
Cap rate
0.5%
Rent to Value Ratio
Active
$339,999
3
bds
|
1
ba
|
1,261
sqft
|
built
1946
826 King Ave, Stockton, CA 95203
$-188
Cash flow
-2.9%
Cash-on-Cash Return
5.6%
Cap rate
0.7%
Rent to Value Ratio

Active
$379,000
2
bds
|
1
ba
|
810
sqft
|
built
1972
708 Sequoia Blvd, Tracy, CA 95376
$-599
Cash flow
-8.2%
Cash-on-Cash Return
4.4%
Cap rate
0.5%
Rent to Value Ratio
Active
$979,888
5
bds
|
3
ba
|
3,324
sqft
|
built
2001
1242 Tulloch Dr, Tracy, CA 95304
$-2,747
Cash flow
-14.6%
Cash-on-Cash Return
2.7%
Cap rate
0.3%
Rent to Value Ratio
Active
$1,380,000
5
bds
|
5
ba
|
4,082
sqft
|
built
2007
184 S Sonrisa St, Mountain House, CA 95391
$-4,494
Cash flow
-17.0%
Cash-on-Cash Return
2.2%
Cap rate
0.3%
Rent to Value Ratio
Active
$525,000
5
bds
|
2
ba
|
2,013
sqft
|
built
1975
3025 Monticello Dr, Stockton, CA 95209
$-930
Cash flow
-9.2%
Cash-on-Cash Return
3.9%
Cap rate
0.5%
Rent to Value Ratio
Active
$595,000
4
bds
|
2
ba
|
1,873
sqft
|
built
1962
471 Helen Ave, Tracy, CA 95376
$-1,174
Cash flow
-10.3%
Cash-on-Cash Return
3.9%
Cap rate
0.5%
Rent to Value Ratio
Active
$599,900
7
bds
|
0
ba
|
2,945
sqft
|
built
1980
9568 Kelley Dr, Stockton, CA 95209
$-2,235
Cash flow
-19.4%
Cash-on-Cash Return
1.8%
Cap rate
0.2%
Rent to Value Ratio
Active
$995,000
4
bds
|
4
ba
|
2,914
sqft
|
built
2021
6326 Moser Way, Tracy, CA 95377
$-3,080
Cash flow
-16.2%
Cash-on-Cash Return
2.6%
Cap rate
0.3%
Rent to Value Ratio