San Mateo County Investment Properties for Sale
Browse homes for sale and investment properties in San Mateo County. Refine your search by price, property type, or more.
Best cash flowing properties in San Mateo County

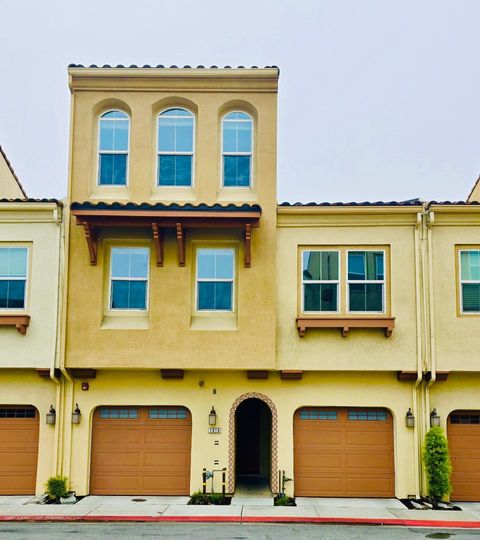
Active
$399,999
1
bds
|
1
ba
|
777
sqft
|
built
1979
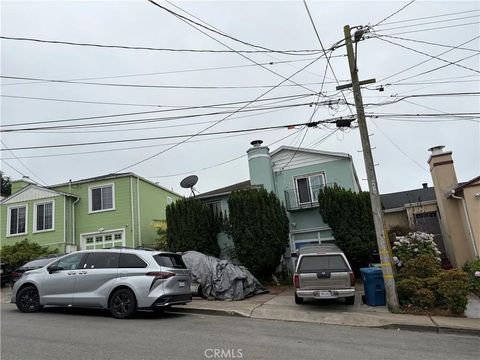
1 Appian Way, South San Francisco, CA 94080
$-805
Cash flow
-10.5%
Cash-on-Cash Return
3.7%
Cap rate
0.7%
Rent to Value Ratio
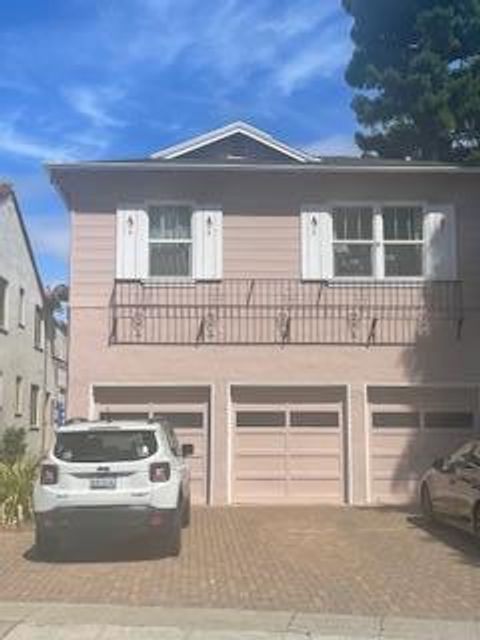
Active
$530,000
1
bds
|
1
ba
|
680
sqft
|
built
1972
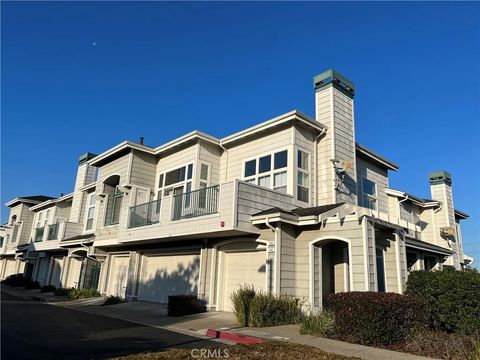
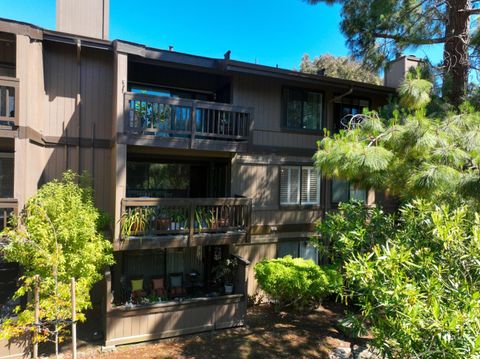
8227 Shelter Creek Ln, San Bruno, CA 94066
$-1,473
Cash flow
-14.5%
Cash-on-Cash Return
2.7%
Cap rate
0.5%
Rent to Value Ratio
408 out of 515 properties for sale in San Mateo County
Limited Results Shown
Create a free account, or log in to reveal all property listings and enjoy the complete experience.
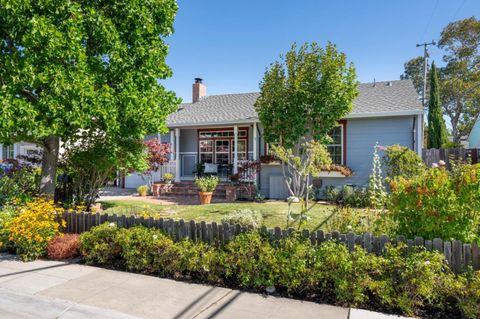
Active
$1,099,999
4
bds
|
3
ba
|
1,340
sqft
|
built
1945
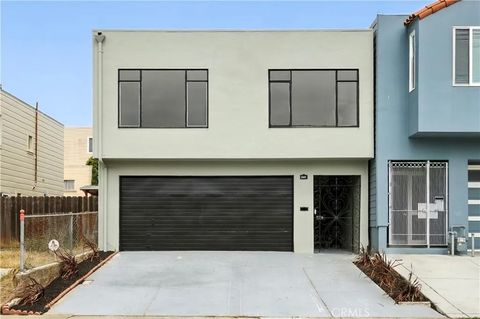
89 Muirwood Dr, Daly City, CA 94014
$-2,526
Cash flow
-12.0%
Cash-on-Cash Return
3.3%
Cap rate
0.4%
Rent to Value Ratio
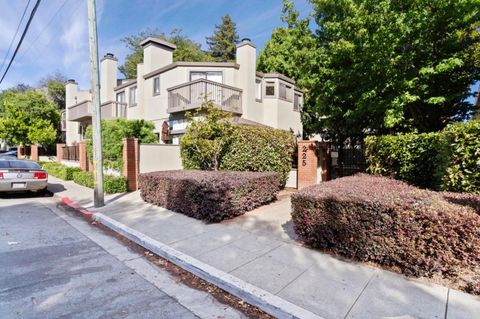
Active
$980,000
1
bds
|
2
ba
|
1,323
sqft
|
built
1992
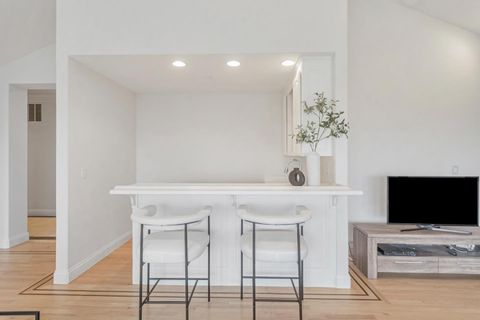
549 Shoal Cir, Redwood City, CA 94065
$-2,639
Cash flow
-14.0%
Cash-on-Cash Return
2.8%
Cap rate
0.4%
Rent to Value Ratio
Active
$1,288,800
3
bds
|
2
ba
|
1,603
sqft
|
built
1958
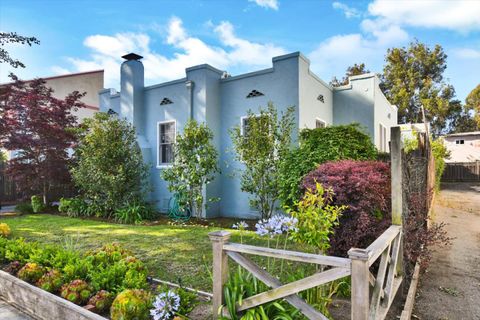
269 Willits St, Daly City, CA 94014
$-3,688
Cash flow
-14.9%
Cash-on-Cash Return
2.6%
Cap rate
0.3%
Rent to Value Ratio
Active
$1,480,000
2
bds
|
2
ba
|
1,377
sqft
|
built
2008
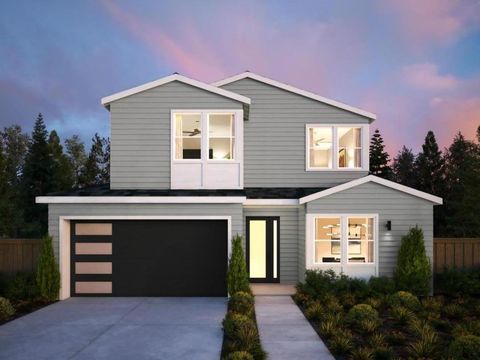
10 Crystal Springs Rd, San Mateo, CA 94402
$-7,899
Cash flow
-27.8%
Cash-on-Cash Return
-0.3%
Cap rate
0.4%
Rent to Value Ratio
Active
$1,998,000
4
bds
|
2
ba
|
1,830
sqft
|
built
1964
613 Pilgrim Dr, Foster City, CA 94404
$-5,825
Cash flow
-15.2%
Cash-on-Cash Return
2.6%
Cap rate
0.3%
Rent to Value Ratio
Active
$7,980,000
6
bds
|
4
ba
|
6,600
sqft
|
built
2008
801 Bean Hollow Rd, Pescadero, CA 94060
$-31,933
Cash flow
-20.9%
Cash-on-Cash Return
1.3%
Cap rate
0.2%
Rent to Value Ratio
Active
$859,000
2
bds
|
2
ba
|
1,356
sqft
|
built
1981
425 N El Camino Real, San Mateo, CA 94401
$-2,079
Cash flow
-12.6%
Cash-on-Cash Return
3.2%
Cap rate
0.5%
Rent to Value Ratio
Active
$3,849,000
5
bds
|
4
ba
|
3,610
sqft
|
built
1982
4 Woodleaf Ave, Redwood City, CA 94061
$-13,464
Cash flow
-18.3%
Cash-on-Cash Return
1.9%
Cap rate
0.2%
Rent to Value Ratio
Active
$2,300,000
4
bds
|
3
ba
|
3,110
sqft
|
built
1967
46 Morse Ln, Redwood City, CA 94062
$-7,214
Cash flow
-16.4%
Cash-on-Cash Return
2.3%
Cap rate
0.3%
Rent to Value Ratio
Active
$795,000
1
bds
|
1
ba
|
1,004
sqft
|
built
1977
1515 Floribunda Ave, Burlingame, CA 94010
$-2,236
Cash flow
-14.7%
Cash-on-Cash Return
2.7%
Cap rate
0.4%
Rent to Value Ratio

Active
$3,995,000
3
bds
|
3
ba
|
2,980
sqft
|
built
1970
300 Cervantes Rd, Portola Valley, CA 94028
$-14,681
Cash flow
-19.2%
Cash-on-Cash Return
1.7%
Cap rate
0.2%
Rent to Value Ratio
Active
$1,999,999
5
bds
|
0
ba
|
2,592
sqft
|
built
1937
824 El Camino Real, Burlingame, CA 94010
$-7,629
Cash flow
-19.9%
Cash-on-Cash Return
1.5%
Cap rate
0.2%
Rent to Value Ratio
Active
$780,000
2
bds
|
2
ba
|
1,040
sqft
|
built
1972
3350 La Mesa Dr, San Carlos, CA 94070
$-2,134
Cash flow
-14.3%
Cash-on-Cash Return
2.8%
Cap rate
0.5%
Rent to Value Ratio
Active
$7,200,000
5
bds
|
5
ba
|
6,570
sqft
|
built
1992
222 Oakley Ave, San Carlos, CA 94070
$-28,817
Cash flow
-20.9%
Cash-on-Cash Return
1.3%
Cap rate
0.2%
Rent to Value Ratio
Active
$1,775,000
2
bds
|
0
ba
|
2,092
sqft
|
built
1932
1137 Capuchino Ave, Burlingame, CA 94010
$-5,180
Cash flow
-15.2%
Cash-on-Cash Return
2.6%
Cap rate
0.3%
Rent to Value Ratio
Active
$3,495,000
4
bds
|
4
ba
|
2,852
sqft
|
built
2025
215 Belmont Ave, Redwood City, CA 94061
$-14,982
Cash flow
-22.4%
Cash-on-Cash Return
0.9%
Cap rate
0.1%
Rent to Value Ratio
Active
$599,888
1
bds
|
1
ba
|
764
sqft
|
built
1973
1550 Frontera Way, Millbrae, CA 94030
$-1,559
Cash flow
-13.6%
Cash-on-Cash Return
2.9%
Cap rate
0.5%
Rent to Value Ratio
Active
$2,295,000
7
bds
|
0
ba
|
5,972
sqft
|
built
1979
306 Beech St, Redwood City, CA 94063
$-9,811
Cash flow
-22.3%
Cash-on-Cash Return
0.9%
Cap rate
0.1%
Rent to Value Ratio
Active
$3,588,000
4
bds
|
5
ba
|
3,136
sqft
|
built
2024
21 Highland Ave, San Carlos, CA 94070
$-11,312
Cash flow
-16.4%
Cash-on-Cash Return
2.3%
Cap rate
0.3%
Rent to Value Ratio
Active
$1,199,000
4
bds
|
2
ba
|
1,533
sqft
|
built
1967
16 Canterbury Ave, Daly City, CA 94015
$-2,682
Cash flow
-11.7%
Cash-on-Cash Return
3.4%
Cap rate
0.4%
Rent to Value Ratio
Active
$1,425,000
4
bds
|
4
ba
|
2,226
sqft
|
built
2017
1018 Ocean View Ave, Daly City, CA 94014
$-3,601
Cash flow
-13.2%
Cash-on-Cash Return
3.0%
Cap rate
0.4%
Rent to Value Ratio
Active
$1,600,000
3
bds
|
2
ba
|
1,354
sqft
|
built
1941
1131 Hawthorne Dr, San Mateo, CA 94402
$-4,640
Cash flow
-15.1%
Cash-on-Cash Return
2.6%
Cap rate
0.3%
Rent to Value Ratio
Active
$2,098,000
4
bds
|
0
ba
|
3,724
sqft
|
built
1937
6 Avila Rd, San Mateo, CA 94402
$-7,573
Cash flow
-18.8%
Cash-on-Cash Return
1.7%
Cap rate
0.2%
Rent to Value Ratio
Active
$1,050,000
2
bds
|
3
ba
|
1,400
sqft
|
built
1982
225 E Santa Inez Ave, San Mateo, CA 94401
$-2,983
Cash flow
-14.8%
Cash-on-Cash Return
2.7%
Cap rate
0.4%
Rent to Value Ratio
Active
$2,680,000
4
bds
|
3
ba
|
2,360
sqft
|
built
1964
1485 Ascension Dr, San Mateo, CA 94402
$-8,032
Cash flow
-15.6%
Cash-on-Cash Return
2.5%
Cap rate
0.3%
Rent to Value Ratio

Active
$975,000
2
bds
|
2
ba
|
1,143
sqft
|
built
1997
1951 Ofarrell St, San Mateo, CA 94403
$-2,526
Cash flow
-13.5%
Cash-on-Cash Return
3.0%
Cap rate
0.4%
Rent to Value Ratio
Active
$2,895,000
4
bds
|
3
ba
|
2,545
sqft
|
built
1971
1647 Overland Dr, San Mateo, CA 94403
$-9,119
Cash flow
-16.4%
Cash-on-Cash Return
2.3%
Cap rate
0.3%
Rent to Value Ratio
Active
$2,498,000
3
bds
|
2
ba
|
1,740
sqft
|
built
1968
3909 Pepper Tree Ct, Redwood City, CA 94061
$-7,870
Cash flow
-16.4%
Cash-on-Cash Return
2.3%
Cap rate
0.3%
Rent to Value Ratio
Active
$2,399,888
3
bds
|
0
ba
|
2,598
sqft
|
built
1948
952 6th Ave, Redwood City, CA 94063
$-8,271
Cash flow
-18.0%
Cash-on-Cash Return
1.9%
Cap rate
0.2%
Rent to Value Ratio
Active
$1,999,000
3
bds
|
3
ba
|
2,920
sqft
|
built
2008
414 Belleville Blvd, Half Moon Bay, CA 94019
$-5,761
Cash flow
-15.0%
Cash-on-Cash Return
2.6%
Cap rate
0.3%
Rent to Value Ratio
Active
$1,578,000
2
bds
|
2
ba
|
1,780
sqft
|
built
1975
1029 Lido Ln, Foster City, CA 94404
$-4,254
Cash flow
-14.1%
Cash-on-Cash Return
2.8%
Cap rate
0.4%
Rent to Value Ratio
Active
$4,295,000
4
bds
|
3
ba
|
2,750
sqft
|
built
1950
2051 Gordon Ave, Menlo Park, CA 94025
$-15,025
Cash flow
-18.3%
Cash-on-Cash Return
1.9%
Cap rate
0.2%
Rent to Value Ratio
Active
$2,588,000
2
bds
|
0
ba
|
1,515
sqft
|
built
1954
2513 Alpine Rd, Menlo Park, CA 94025
$-10,257
Cash flow
-20.7%
Cash-on-Cash Return
1.3%
Cap rate
0.2%
Rent to Value Ratio
Active
$3,795,000
4
bds
|
4
ba
|
3,240
sqft
|
built
1927
1308 Montero Ave, Burlingame, CA 94010
$-12,290
Cash flow
-16.9%
Cash-on-Cash Return
2.2%
Cap rate
0.3%
Rent to Value Ratio
Active
$1,600,000
2
bds
|
1
ba
|
1,145
sqft
|
built
1939
1411 Sanchez Ave, Burlingame, CA 94010
$-4,571
Cash flow
-14.9%
Cash-on-Cash Return
2.6%
Cap rate
0.3%
Rent to Value Ratio
Active
$11,800,000
8
bds
|
7
ba
|
7,132
sqft
|
built
2025
45 Calaveras Ct, Hillsborough, CA 94010
$-54,078
Cash flow
-23.9%
Cash-on-Cash Return
0.6%
Cap rate
0.1%
Rent to Value Ratio
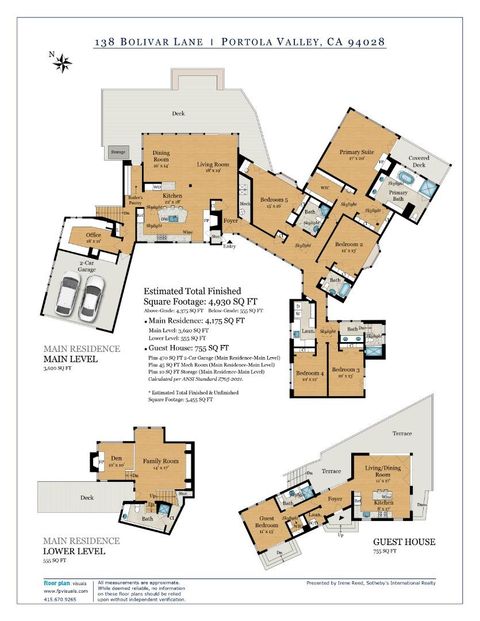
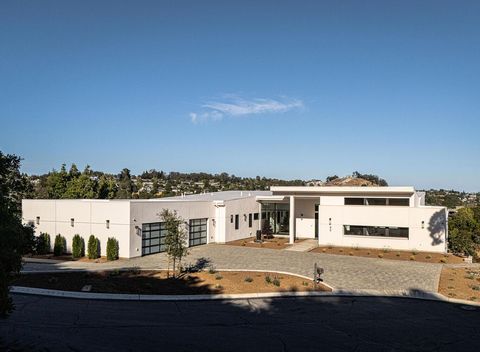
Active
$7,998,000
6
bds
|
6
ba
|
4,175
sqft
|
built
1960
138 Bolivar Ln, Portola Valley, CA 94028
$-32,722
Cash flow
-21.3%
Cash-on-Cash Return
1.2%
Cap rate
0.1%
Rent to Value Ratio
Active
$5,480,000
4
bds
|
4
ba
|
3,930
sqft
|
built
2005
23 Almendral Ave, Atherton, CA 94027
$-21,017
Cash flow
-20.0%
Cash-on-Cash Return
1.5%
Cap rate
0.2%
Rent to Value Ratio