California Investment Properties for Sale
Browse homes for sale and investment properties in California. Refine your search by price, property type, or more.
Best cash flowing properties in California
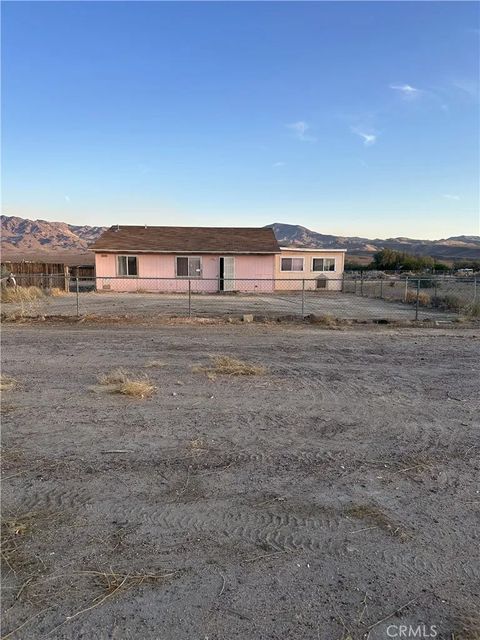
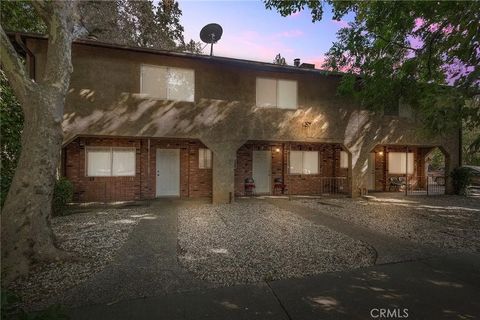
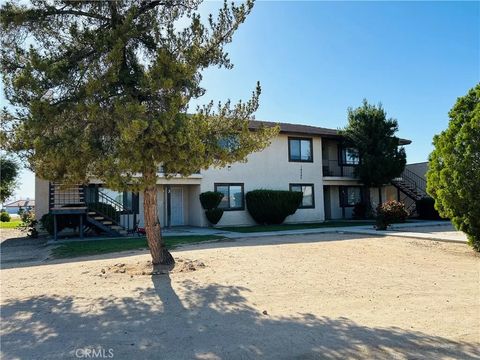
Active
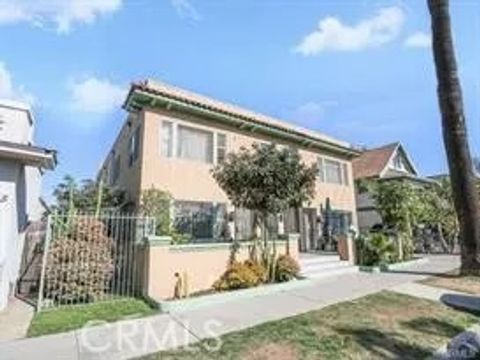
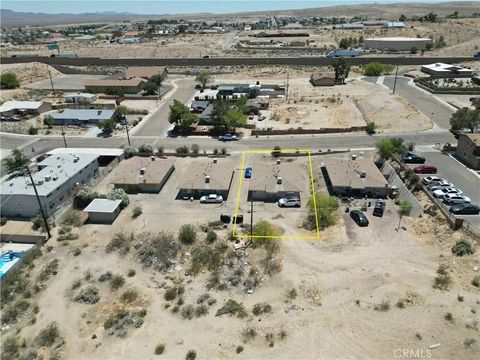
$125,000
3
bds
|
2
ba
|
1,296
sqft
|
built
1993
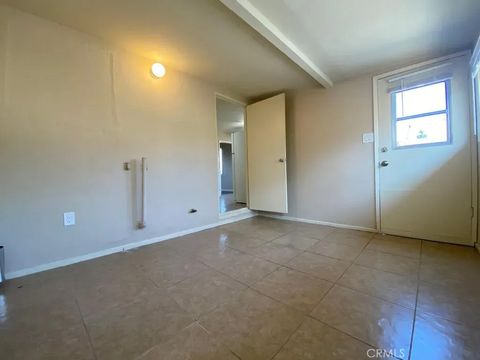
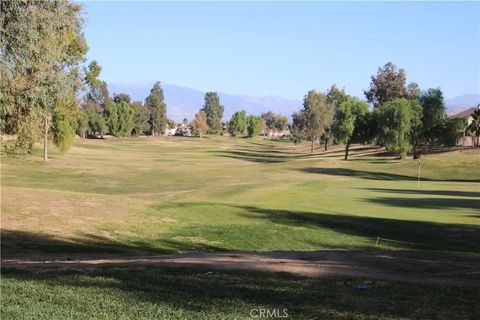
41091 Chloride Rd, Newberry Springs, CA 92365
$472
Cash flow
19.7%
Cash-on-Cash Return
10.6%
Cap rate
1.3%
Rent to Value Ratio
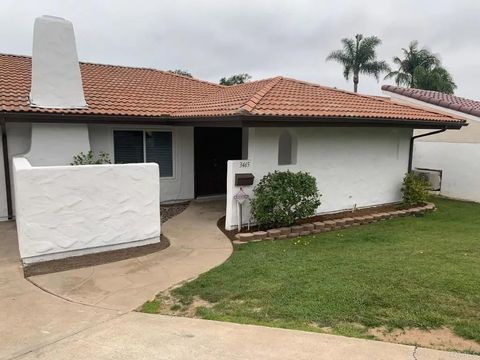
Active
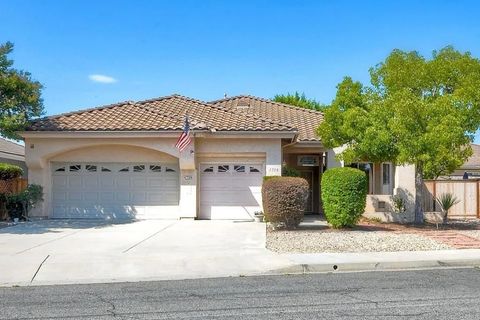
$231,000
3
bds
|
2
ba
|
1,482
sqft
|
built
2006
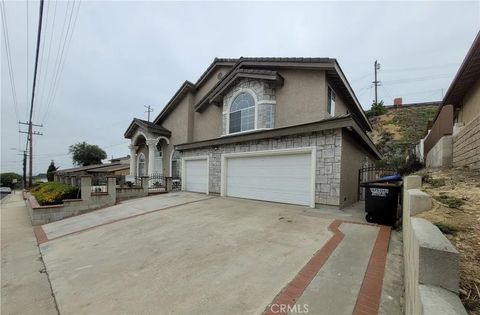
8173 Viburnum Ave, California City, CA 93505
$419
Cash flow
9.5%
Cash-on-Cash Return
8.2%
Cap rate
1.0%
Rent to Value Ratio
5,064 out of 27,623 properties for sale in California
Limited Results Shown
Create a free account, or log in to reveal all property listings and enjoy the complete experience.
Active
$980,000
1
bds
|
2
ba
|
1,323
sqft
|
built
1992
549 Shoal Cir, Redwood City, CA 94065
$-2,639
Cash flow
-14.0%
Cash-on-Cash Return
2.8%
Cap rate
0.4%
Rent to Value Ratio

Active
$1,145,000
1
bds
|
1
ba
|
660
sqft
|
built
2000
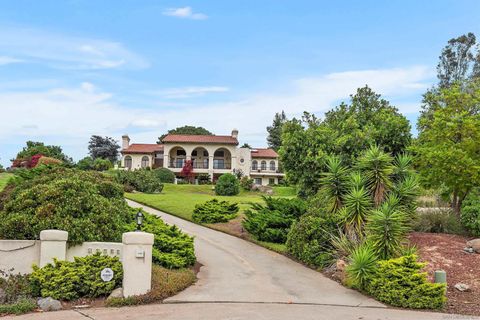
30785 Pauma Heights Rd, Valley Center, CA 92082
$-3,651
Cash flow
-16.6%
Cash-on-Cash Return
2.2%
Cap rate
0.3%
Rent to Value Ratio
Active
$999,950
8
bds
|
5
ba
|
0
sqft
|
built
1964
2427 Chanslor St, Pomona, CA 91766
$-3,883
Cash flow
-20.3%
Cash-on-Cash Return
1.4%
Cap rate
0.2%
Rent to Value Ratio
Active
$1,299,000
4
bds
|
0
ba
|
0
sqft
|
built
1923
433 W 9th St, Long Beach, CA 90813
$-4,843
Cash flow
-19.5%
Cash-on-Cash Return
1.6%
Cap rate
0.2%
Rent to Value Ratio

Active
$1,299,000
3
bds
|
2
ba
|
2,100
sqft
|
built
1928
3430 Monroe Ave, San Diego, CA 92116
$-3,394
Cash flow
-13.6%
Cash-on-Cash Return
2.9%
Cap rate
0.4%
Rent to Value Ratio
Active
$899,999
3
bds
|
2
ba
|
1,846
sqft
|
built
1996
1789 Clydesdale Ct, Oceanside, CA 92057
$-1,791
Cash flow
-10.4%
Cash-on-Cash Return
3.7%
Cap rate
0.4%
Rent to Value Ratio

Active
$5,500,000
5
bds
|
6
ba
|
5,653
sqft
|
built
2014
14958 Encendido, San Diego, CA 92127
$-22,389
Cash flow
-21.2%
Cash-on-Cash Return
1.2%
Cap rate
0.2%
Rent to Value Ratio
Active
$329,900
5
bds
|
3
ba
|
0
sqft
|
built
1925
1917 Pacific St, Bakersfield, CA 93305
$-495
Cash flow
-7.8%
Cash-on-Cash Return
4.3%
Cap rate
0.5%
Rent to Value Ratio
Active
$549,000
12
bds
|
5
ba
|
0
sqft
|
built
1983
1204 W 5th St, Chico, CA 95928
$-1,534
Cash flow
-14.6%
Cash-on-Cash Return
2.7%
Cap rate
0.3%
Rent to Value Ratio
Active
$699,000
9
bds
|
9
ba
|
0
sqft
|
built
1984
403 Maple St, Chico, CA 95928
$-2,017
Cash flow
-15.1%
Cash-on-Cash Return
2.6%
Cap rate
0.3%
Rent to Value Ratio

Active
$1,185,000
4
bds
|
4
ba
|
3,304
sqft
|
built
2003
31113 N Star Way, Valley Center, CA 92082
$-2,542
Cash flow
-11.2%
Cash-on-Cash Return
3.5%
Cap rate
0.4%
Rent to Value Ratio
Active
$1,450,000
6
bds
|
4
ba
|
3,717
sqft
|
built
1966
2266 Adrian St, Thousand Oaks, CA 91320
$-3,882
Cash flow
-14.0%
Cash-on-Cash Return
2.9%
Cap rate
0.3%
Rent to Value Ratio

Active
$965,000
3
bds
|
2
ba
|
1,404
sqft
|
built
1964
8720 Mulberry Dr, Sunland, CA 91040
$-1,844
Cash flow
-10.0%
Cash-on-Cash Return
3.8%
Cap rate
0.5%
Rent to Value Ratio
Active
$3,350,000
4
bds
|
4
ba
|
4,900
sqft
|
built
2005
1685 Scenic View Way, Nipomo, CA 93444
$-11,350
Cash flow
-17.7%
Cash-on-Cash Return
2.0%
Cap rate
0.2%
Rent to Value Ratio
Active
$295,000
3
bds
|
2
ba
|
1,495
sqft
|
built
1980
259 Emerald Dr, Merced, CA 95340
$-112
Cash flow
-2.0%
Cash-on-Cash Return
5.6%
Cap rate
0.7%
Rent to Value Ratio
Active
$330,000
2
bds
|
1
ba
|
0
sqft
|
built
1963
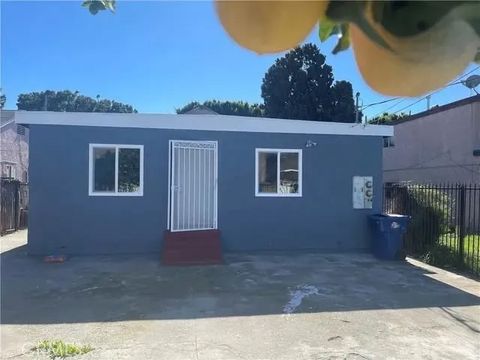
255 W Grace St, Barstow, CA 92311
$-979
Cash flow
-15.5%
Cash-on-Cash Return
2.5%
Cap rate
0.3%
Rent to Value Ratio
Active
$2,150,000
7
bds
|
5
ba
|
0
sqft
|
built
1964
2625 Andover Ave, Fullerton, CA 92831
$-8,940
Cash flow
-21.7%
Cash-on-Cash Return
1.1%
Cap rate
0.1%
Rent to Value Ratio
Active
$1,299,000
10
bds
|
4
ba
|
0
sqft
|
built
1924
1403 Lemon Ave, Long Beach, CA 90813
$-4,636
Cash flow
-18.6%
Cash-on-Cash Return
1.8%
Cap rate
0.2%
Rent to Value Ratio

Active
$799,000
3
bds
|
2
ba
|
1,500
sqft
|
built
1960
1106 Dawnridge Ave, El Cajon, CA 92021
$-1,349
Cash flow
-8.8%
Cash-on-Cash Return
4.0%
Cap rate
0.5%
Rent to Value Ratio

Active
$996,000
4
bds
|
3
ba
|
2,065
sqft
|
built
1953
874 Hacienda Dr, El Cajon, CA 92020
$-1,586
Cash flow
-8.3%
Cash-on-Cash Return
4.2%
Cap rate
0.5%
Rent to Value Ratio
Active
$660,000
6
bds
|
4
ba
|
0
sqft
|
built
2004
66780 Crescent Dr, Desert Hot Springs, CA 92240
$-1,612
Cash flow
-12.7%
Cash-on-Cash Return
3.1%
Cap rate
0.4%
Rent to Value Ratio
Active
$2,000,000
8
bds
|
0
ba
|
0
sqft
|
built
1986
16585 Green Tree Blvd, Victorville, CA 92395
$-8,871
Cash flow
-23.1%
Cash-on-Cash Return
0.7%
Cap rate
0.1%
Rent to Value Ratio
Active
$1,499,000
4
bds
|
2
ba
|
1,685
sqft
|
built
1970
3465 Spanish Way, Carlsbad, CA 92008
$-3,785
Cash flow
-13.2%
Cash-on-Cash Return
3.0%
Cap rate
0.4%
Rent to Value Ratio
Active
$355,000
3
bds
|
2
ba
|
1,560
sqft
|
built
1960
44622 Holtville Ave, Jacumba, CA 91934
$137
Cash flow
2.0%
Cash-on-Cash Return
6.5%
Cap rate
0.8%
Rent to Value Ratio

Active
$1,790,000
6
bds
|
4
ba
|
0
sqft
|
built
1961
981 S Catalina St, Los Angeles, CA 90006
$-6,636
Cash flow
-19.3%
Cash-on-Cash Return
1.6%
Cap rate
0.2%
Rent to Value Ratio

Active
$1,895,000
5
bds
|
5
ba
|
2,331
sqft
|
built
1938
3415 Madison Ave, San Diego, CA 92116
$-6,891
Cash flow
-19.0%
Cash-on-Cash Return
1.7%
Cap rate
0.2%
Rent to Value Ratio

Active
$669,950
3
bds
|
2
ba
|
1,108
sqft
|
built
1963
629 Pitman St, Escondido, CA 92027
$-973
Cash flow
-7.6%
Cash-on-Cash Return
4.3%
Cap rate
0.5%
Rent to Value Ratio
Active
$750,000
4
bds
|
2
ba
|
1,208
sqft
|
built
1950
9130 Hargill St, Bellflower, CA 90706
$-1,377
Cash flow
-9.6%
Cash-on-Cash Return
3.9%
Cap rate
0.5%
Rent to Value Ratio
Active
$1,150,000
5
bds
|
3
ba
|
0
sqft
|
built
1947
5631 Danny Ave, Cypress, CA 90630
$-3,607
Cash flow
-16.4%
Cash-on-Cash Return
2.3%
Cap rate
0.3%
Rent to Value Ratio
Active
$2,200,000
4
bds
|
4
ba
|
4,968
sqft
|
built
1986
12982 Polvera Ct, San Diego, CA 92128
$-6,182
Cash flow
-14.7%
Cash-on-Cash Return
2.7%
Cap rate
0.3%
Rent to Value Ratio

Active
$399,900
5
bds
|
4
ba
|
0
sqft
|
built
1922
3249 Myers St, Oroville, CA 95966
$-1,194
Cash flow
-15.6%
Cash-on-Cash Return
2.5%
Cap rate
0.3%
Rent to Value Ratio
Active
$1,199,900
4
bds
|
4
ba
|
3,374
sqft
|
built
1999
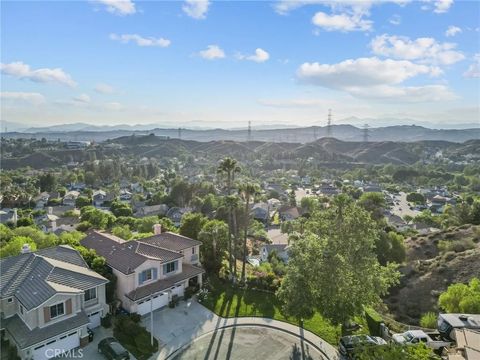
22440 Skylake Pl, Santa Clarita, CA 91390
$-2,203
Cash flow
-9.6%
Cash-on-Cash Return
3.9%
Cap rate
0.5%
Rent to Value Ratio
Active
$949,000
5
bds
|
4
ba
|
0
sqft
|
built
1910
901 E 42nd St, Los Angeles, CA 90011
$-3,419
Cash flow
-18.8%
Cash-on-Cash Return
1.7%
Cap rate
0.2%
Rent to Value Ratio

Active
$470,000
3
bds
|
2
ba
|
1,374
sqft
|
built
1987
6429 Cedar Ct, Angelus Oaks, CA 92305
$-859
Cash flow
-9.5%
Cash-on-Cash Return
3.9%
Cap rate
0.5%
Rent to Value Ratio

Active
$675,000
6
bds
|
4
ba
|
0
sqft
|
built
1981
26166 Alpine Ln, Twin Peaks, CA 92391
$-1,688
Cash flow
-13.0%
Cash-on-Cash Return
3.1%
Cap rate
0.4%
Rent to Value Ratio
Active
$419,000
2
bds
|
2
ba
|
1,809
sqft
|
built
2006
197 Inkster Way, Hemet, CA 92545
$-371
Cash flow
-4.6%
Cash-on-Cash Return
5.0%
Cap rate
0.7%
Rent to Value Ratio
Active
$1,890,000
4
bds
|
4
ba
|
3,214
sqft
|
built
1957
1389 Hillside St, Monterey Park, CA 91754
$-6,107
Cash flow
-16.9%
Cash-on-Cash Return
2.2%
Cap rate
0.3%
Rent to Value Ratio

Active
$3,600,000
3
bds
|
3
ba
|
5,975
sqft
|
built
2741 Hornblend St, San Diego, CA 92109
$-16,272
Cash flow
-23.6%
Cash-on-Cash Return
0.6%
Cap rate
0.1%
Rent to Value Ratio