United States Investment Properties for Sale
Browse homes for sale and investment properties in United States. Refine your search by price, property type, or more.
Best cash flowing properties in United States
Active
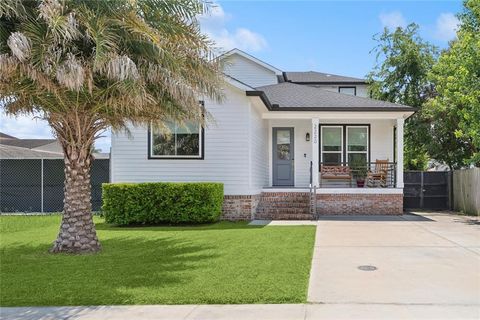
$565,000
5
bds
|
4
ba
|
2,258
sqft
|
built
2022
2220 Pressburg St, New Orleans, LA 70122
$17
Cash flow
0.2%
Cash-on-Cash Return
5.7%
Cap rate
0.7%
Rent to Value Ratio
Active
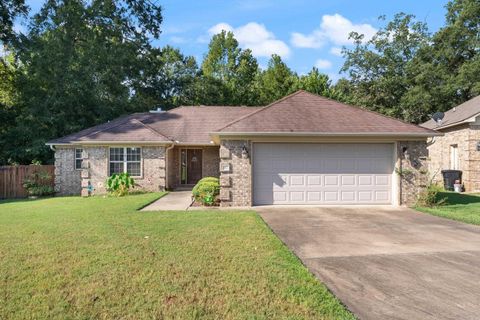
$228,000
3
bds
|
2
ba
|
1,461
sqft
|
built
2010
42 Eaglebrook Dr, Conway, AR 72032
$-73
Cash flow
-1.7%
Cash-on-Cash Return
5.3%
Cap rate
0.7%
Rent to Value Ratio
10,000 out of 322,833 properties for sale in United States
Limited Results Shown
Create a free account, or log in to reveal all property listings and enjoy the complete experience.
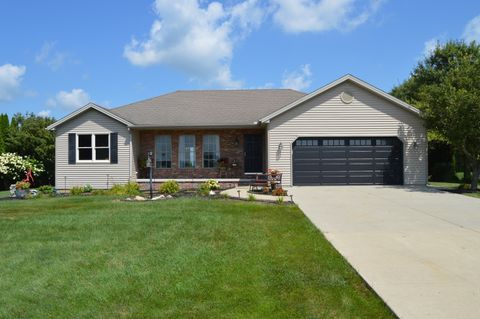
Active
$425,000
3
bds
|
3
ba
|
3,346
sqft
|
built
2003
277 Clearview Rd, El Paso, IL 61738
$-1,775
Cash flow
-21.8%
Cash-on-Cash Return
0.7%
Cap rate
0.3%
Rent to Value Ratio
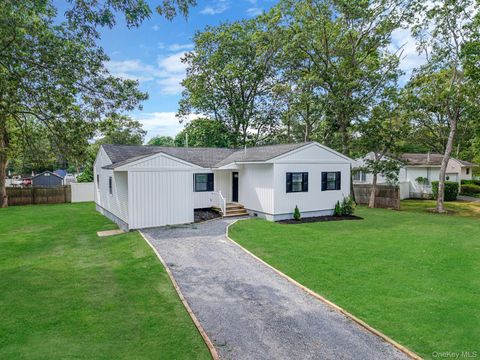
Active
$665,000
4
bds
|
2
ba
|
1,700
sqft
|
built
1971
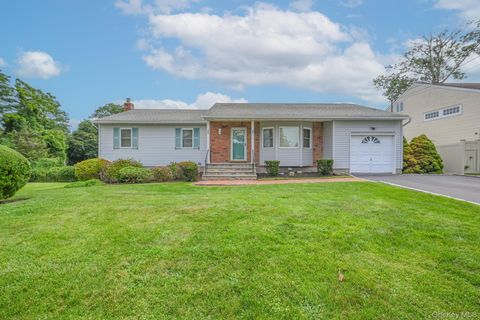
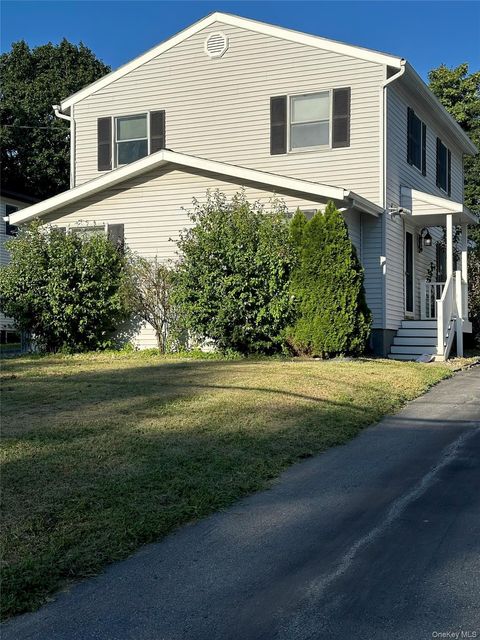
220 Peekskill Ave, Medford, NY 11763
$-1,926
Cash flow
-15.1%
Cash-on-Cash Return
2.6%
Cap rate
0.5%
Rent to Value Ratio
Active
$775,000
4
bds
|
4
ba
|
2,367
sqft
|
built
2002
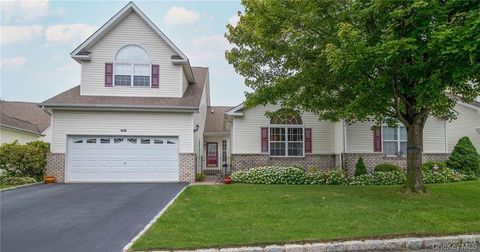
37 Constantine Way, Mount Sinai, NY 11766
$-1,941
Cash flow
-13.1%
Cash-on-Cash Return
3.1%
Cap rate
0.6%
Rent to Value Ratio
Active
$675,000
3
bds
|
2
ba
|
1,250
sqft
|
built
1993
59 Rosewood Rd, Kings Park, NY 11754
$-2,369
Cash flow
-18.3%
Cash-on-Cash Return
1.9%
Cap rate
0.5%
Rent to Value Ratio
Active
$464,900
4
bds
|
3
ba
|
2,355
sqft
|
built
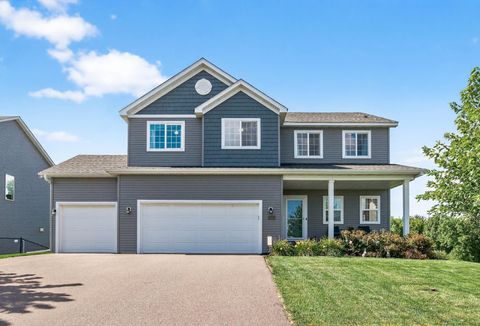
2020
12116 77th St NE, Otsego, MN 55330
$-455
Cash flow
-5.1%
Cash-on-Cash Return
4.5%
Cap rate
0.7%
Rent to Value Ratio
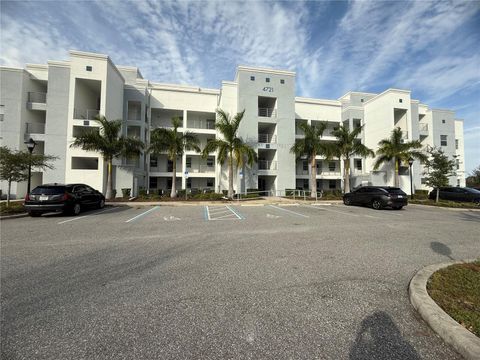
Active
$499,000
4
bds
|
3
ba
|
2,317
sqft
|
built
2019
4721 Clock Tower Dr, Kissimmee, FL 34746
$-782
Cash flow
-8.2%
Cash-on-Cash Return
4.3%
Cap rate
0.7%
Rent to Value Ratio
Active
$259,000
3
bds
|
2
ba
|
1,802
sqft
|
built
2005
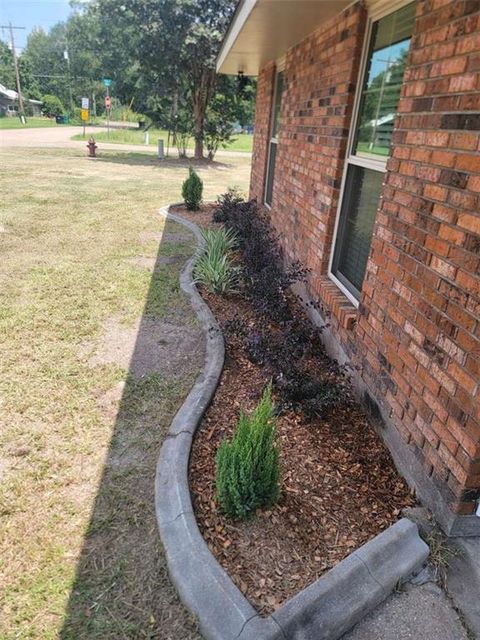
920 Varnado St, Franklinton, LA 70438
$-260
Cash flow
-5.2%
Cash-on-Cash Return
4.5%
Cap rate
0.5%
Rent to Value Ratio

Active
$950,000
2
bds
|
2
ba
|
0
sqft
|
built
1995
1505 Yancey Rd, Rossville, TN 38066
$-3,299
Cash flow
-18.1%
Cash-on-Cash Return
1.5%
Cap rate
0.2%
Rent to Value Ratio
Active
$898,000
3
bds
|
4
ba
|
2,538
sqft
|
built
2004
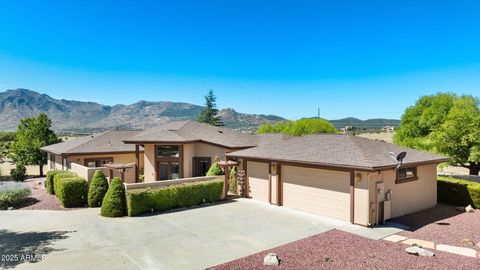
11020 N Nelson Ridge Rd, Prescott, AZ 86305
$-2,493
Cash flow
-14.5%
Cash-on-Cash Return
2.3%
Cap rate
0.3%
Rent to Value Ratio
Active
$1,800,000
4
bds
|
4
ba
|
2,643
sqft
|
built
1990
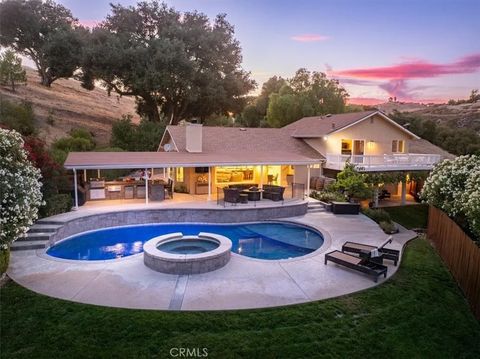
889 W 4th St, Paso Robles, CA 93446
$-5,997
Cash flow
-17.4%
Cash-on-Cash Return
2.1%
Cap rate
0.3%
Rent to Value Ratio
Active
$195,900
3
bds
|
2
ba
|
1,521
sqft
|
built
1981
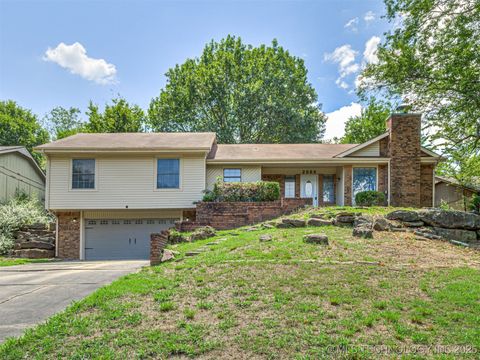
2009 Tanglewood Ln, Muskogee, OK 74403
$-103
Cash flow
-2.7%
Cash-on-Cash Return
5.0%
Cap rate
0.7%
Rent to Value Ratio
Active
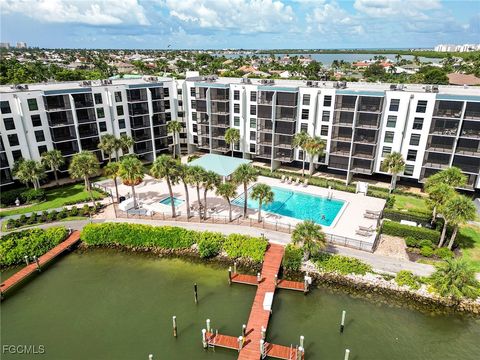
$569,500
1
bds
|
1
ba
|
800
sqft
|
built
1980
1085 Bald Eagle Dr, Marco Island, FL 34145
$-1,206
Cash flow
-11.0%
Cash-on-Cash Return
3.6%
Cap rate
0.5%
Rent to Value Ratio
Active
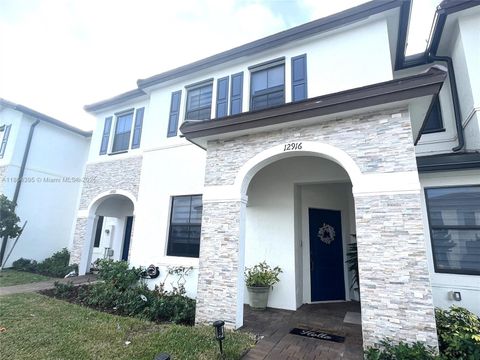
$440,000
3
bds
|
3
ba
|
1,612
sqft
|
built
2022
12916 SW 233rd Ter, Homestead, FL 33032
$-1,119
Cash flow
-13.3%
Cash-on-Cash Return
3.1%
Cap rate
0.6%
Rent to Value Ratio
Active
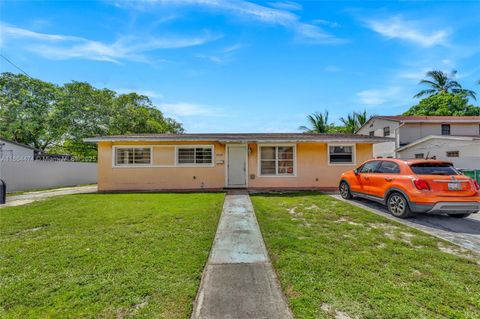
$550,000
3
bds
|
1
ba
|
1,274
sqft
|
built
1958
17210 NW 47th Ave, Miami Gardens, FL 33055
$-514
Cash flow
-4.9%
Cash-on-Cash Return
5.0%
Cap rate
0.6%
Rent to Value Ratio
Active
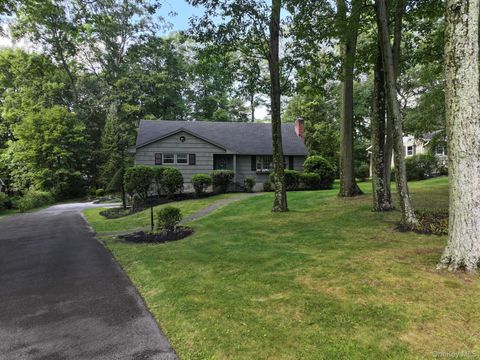
$450,000
4
bds
|
3
ba
|
2,476
sqft
|
built
1960
10 Wood Ter, Newburgh, NY 12550
$-443
Cash flow
-5.1%
Cash-on-Cash Return
4.9%
Cap rate
0.8%
Rent to Value Ratio
Active
$245,000
3
bds
|
2
ba
|
1,132
sqft
|
built
1958
602 Sloan St, Taylor, TX 76574
$-418
Cash flow
-8.9%
Cash-on-Cash Return
3.6%
Cap rate
0.6%
Rent to Value Ratio
Active
$274,999
2
bds
|
2
ba
|
1,540
sqft
|
built
2003
17054 Eagleview Way, Farmington, MN 55024
$-499
Cash flow
-9.5%
Cash-on-Cash Return
3.5%
Cap rate
0.7%
Rent to Value Ratio
Active
$548,825
4
bds
|
3
ba
|
2,488
sqft
|
built
2025
19003 Cloverleaf Way, Farmington, MN 55024
$-1,113
Cash flow
-10.6%
Cash-on-Cash Return
3.2%
Cap rate
0.5%
Rent to Value Ratio
Active
$279,900
2
bds
|
2
ba
|
1,518
sqft
|
built
2004
17072 Eastwood Ave, Farmington, MN 55024
$-521
Cash flow
-9.7%
Cash-on-Cash Return
3.4%
Cap rate
0.7%
Rent to Value Ratio
Active
$439,900
3
bds
|
2
ba
|
1,655
sqft
|
built
1926
18 Peckham Rd, Poughkeepsie, NY 12603
$-1,369
Cash flow
-16.2%
Cash-on-Cash Return
2.3%
Cap rate
0.7%
Rent to Value Ratio
Active
$420,000
4
bds
|
2
ba
|
1,800
sqft
|
built
2015
10250 Lenox St, Clermont, FL 34711
$-810
Cash flow
-10.1%
Cash-on-Cash Return
3.8%
Cap rate
0.5%
Rent to Value Ratio
Active
$439,900
3
bds
|
4
ba
|
4,638
sqft
|
built
1989
41 Ravenwood Cir, Bloomington, IL 61704
$-974
Cash flow
-11.6%
Cash-on-Cash Return
3.0%
Cap rate
0.7%
Rent to Value Ratio

Active
$399,900
4
bds
|
2
ba
|
2,250
sqft
|
built
2023
4113 Spencer Ln, Stonecrest, GA 30038
$-1,079
Cash flow
-14.1%
Cash-on-Cash Return
2.9%
Cap rate
0.6%
Rent to Value Ratio
Active
$660,000
3
bds
|
3
ba
|
1,748
sqft
|
built
1997
1125 Doveplum St, Hollywood, FL 33019
$-1,683
Cash flow
-13.3%
Cash-on-Cash Return
3.1%
Cap rate
0.5%
Rent to Value Ratio
Active
$275,000
3
bds
|
2
ba
|
1,186
sqft
|
built
1958
25267 W Timber Ln, Lake Villa, IL 60046
$-103
Cash flow
-2.0%
Cash-on-Cash Return
5.2%
Cap rate
0.8%
Rent to Value Ratio
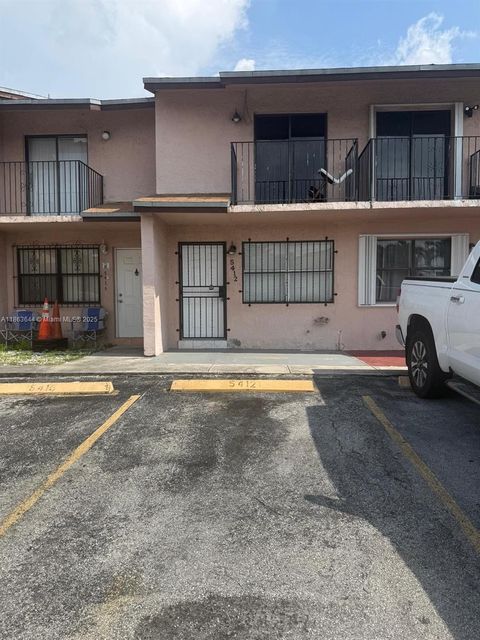
Active
$289,000
2
bds
|
2
ba
|
825
sqft
|
built
1985
5412 W 20th Ave, Hialeah, FL 33016
$-468
Cash flow
-8.4%
Cash-on-Cash Return
4.2%
Cap rate
0.8%
Rent to Value Ratio
Active
$484,900
4
bds
|
3
ba
|
1,742
sqft
|
built
1993
4713 Fort Knox Ct, Orlando, FL 32822
$-955
Cash flow
-10.3%
Cash-on-Cash Return
3.8%
Cap rate
0.5%
Rent to Value Ratio
Active
$585,000
4
bds
|
3.5
ba
|
2,394
sqft
|
built
2008
3533 Peacock Rd, Milton, GA 30004
$-9,441
Cash flow
-84.2%
Cash-on-Cash Return
-13.2%
Cap rate
0.6%
Rent to Value Ratio
Active
$999,999
5
bds
|
4
ba
|
3,654
sqft
|
built
1917
18715 County Road 455, Clermont, FL 34715
$-2,673
Cash flow
-13.9%
Cash-on-Cash Return
2.9%
Cap rate
0.4%
Rent to Value Ratio
Active
$349,900
3
bds
|
3
ba
|
1,782
sqft
|
built
1906
3215 S 54th Ct, Cicero, IL 60804
$-896
Cash flow
-13.4%
Cash-on-Cash Return
2.6%
Cap rate
0.6%
Rent to Value Ratio
Active
$375,000
3
bds
|
3
ba
|
1,650
sqft
|
built
1956
378 Oakwood Dr, Crete, IL 60417
$-798
Cash flow
-11.1%
Cash-on-Cash Return
3.1%
Cap rate
0.7%
Rent to Value Ratio
Active
$2,377,700
5
bds
|
5
ba
|
7,628
sqft
|
built
1993
8050 Wilderness Trl NE, Ada, MI 49301
$-10,484
Cash flow
-23.0%
Cash-on-Cash Return
0.9%
Cap rate
0.2%
Rent to Value Ratio
Active
$650,000
4
bds
|
2
ba
|
2,163
sqft
|
built
1972
2131 Sheridan Hills Rd, Wayzata, MN 55391
$-939
Cash flow
-7.5%
Cash-on-Cash Return
3.9%
Cap rate
0.6%
Rent to Value Ratio

Active
$469,000
2
bds
|
2
ba
|
1,379
sqft
|
built
1975
883 Hurley Dr, Howell, MI 48843
$-1,150
Cash flow
-12.8%
Cash-on-Cash Return
3.2%
Cap rate
0.5%
Rent to Value Ratio
Active
$190,000
2
bds
|
2
ba
|
827
sqft
|
built
1988
10709 W Clairmont Cir, Tamarac, FL 33321
$-554
Cash flow
-15.2%
Cash-on-Cash Return
2.6%
Cap rate
0.9%
Rent to Value Ratio
Active
$849,900
2
bds
|
2
ba
|
1,008
sqft
|
built
1971
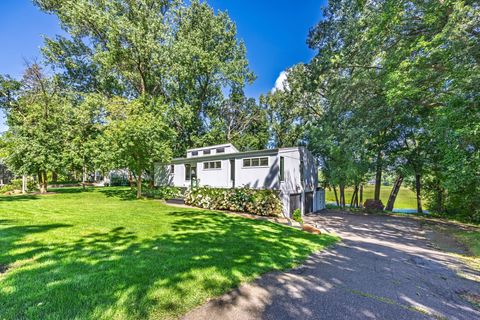
10864 117th St SW, Winsted, MN 55395
$-2,936
Cash flow
-18.0%
Cash-on-Cash Return
1.5%
Cap rate
0.3%
Rent to Value Ratio

Active
$475,000
3
bds
|
2
ba
|
2,182
sqft
|
built
1953
3672 Rustic Pl, Shoreview, MN 55126
$-619
Cash flow
-6.8%
Cash-on-Cash Return
4.1%
Cap rate
0.7%
Rent to Value Ratio
Active
$724,999
3
bds
|
2
ba
|
2,056
sqft
|
built
2002
12430 NW 78th Mnr, Parkland, FL 33076
$-1,463
Cash flow
-10.5%
Cash-on-Cash Return
3.7%
Cap rate
0.7%
Rent to Value Ratio