United States Investment Properties for Sale
Browse homes for sale and investment properties in United States. Refine your search by price, property type, or more.
Best cash flowing properties in United States
Active
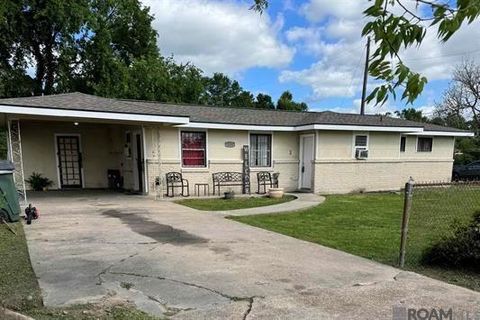
$60,000
2
bds
|
2
ba
|
906
sqft
|
built
1963
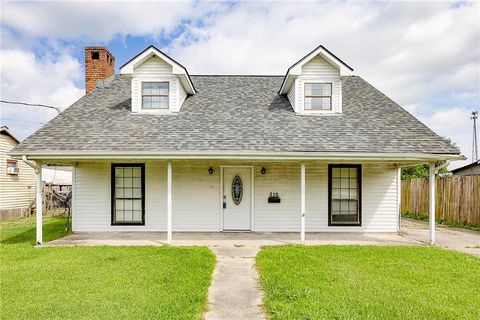
119 Brittany St, Houma, LA 70363
$690
Cash flow
13.4%
Cash-on-Cash Return
13.8%
Cap rate
1.7%
Rent to Value Ratio
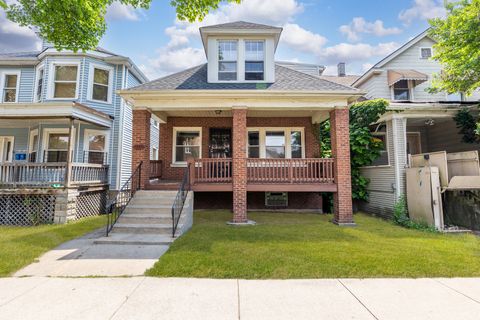
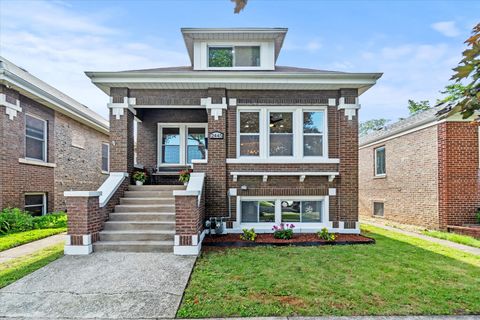
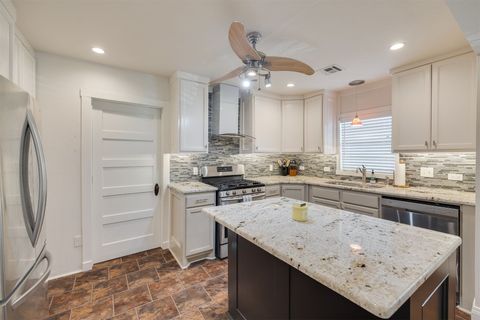
Active
$179,900
6
bds
|
2
ba
|
1,713
sqft
|
built
1912
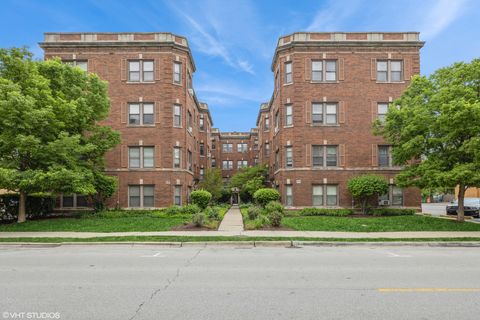
7807 S Burnham Ave, Chicago, IL 60649
$405
Cash flow
11.7%
Cash-on-Cash Return
8.4%
Cap rate
1.1%
Rent to Value Ratio
10,000 out of 417,045 properties for sale in United States
Limited Results Shown
Create a free account, or log in to reveal all property listings and enjoy the complete experience.
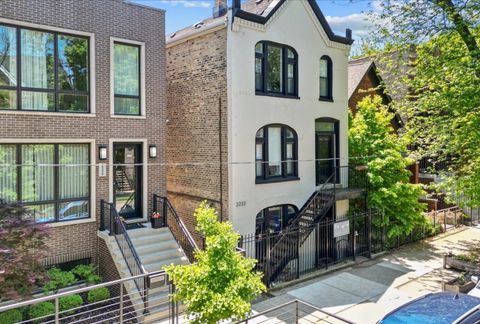
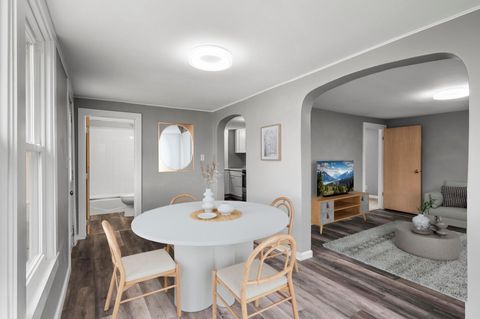
Active
$249,900
1
bds
|
1
ba
|
596
sqft
|
built
1890
2233 W Shakespeare Ave, Chicago, IL 60647
$-559
Cash flow
-11.7%
Cash-on-Cash Return
3.0%
Cap rate
0.7%
Rent to Value Ratio
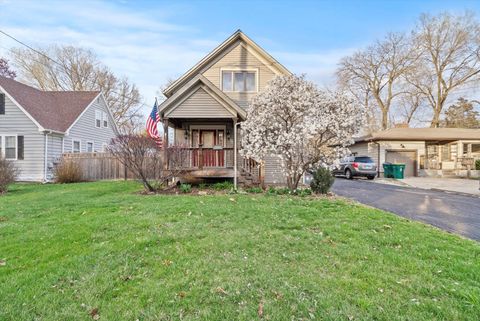
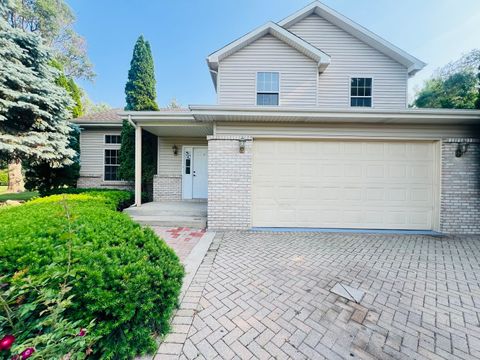
Active
$399,500
3
bds
|
3
ba
|
1,862
sqft
|
built
1914
15405 S Joliet Rd, Plainfield, IL 60544
$-944
Cash flow
-12.3%
Cash-on-Cash Return
2.8%
Cap rate
0.6%
Rent to Value Ratio
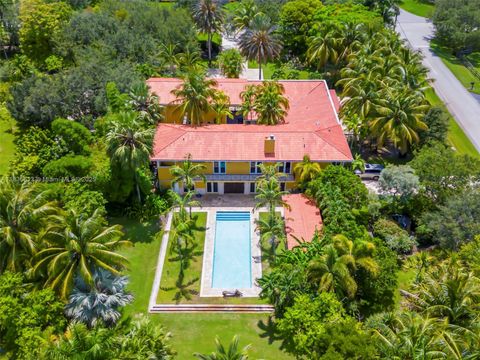
Active
$4,750,000
7
bds
|
10
ba
|
6,744
sqft
|
built
2008
5800 SW 178th Ave, Southwest Ranches, FL 33331
$-20,904
Cash flow
-23.0%
Cash-on-Cash Return
0.9%
Cap rate
0.2%
Rent to Value Ratio
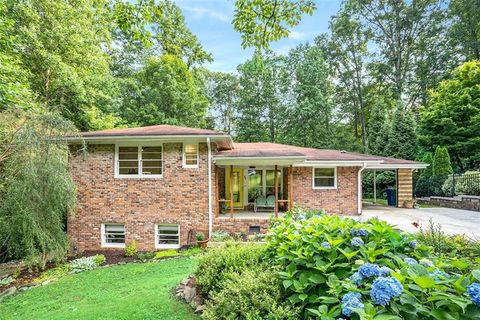
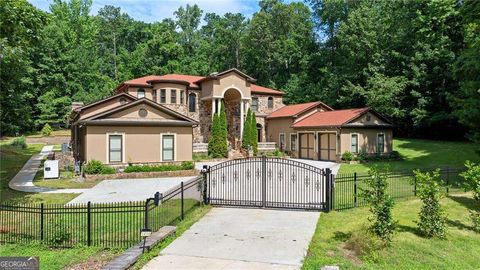
Active
$660,000
4
bds
|
2
ba
|
2,184
sqft
|
built
1959
1706 Remington Rd, Chamblee, GA 30341
$-1,415
Cash flow
-11.2%
Cash-on-Cash Return
3.6%
Cap rate
0.5%
Rent to Value Ratio
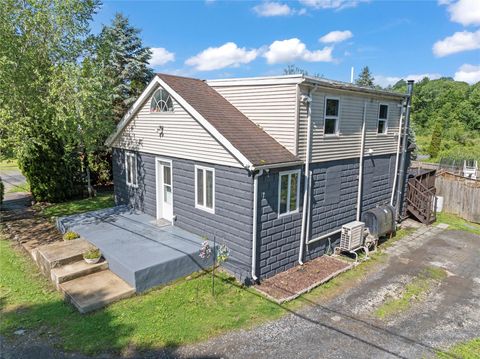
Active
$330,000
2
bds
|
1
ba
|
1,723
sqft
|
built
1930
578 South St, Highland, NY 12528
$-214
Cash flow
-3.4%
Cash-on-Cash Return
5.3%
Cap rate
0.8%
Rent to Value Ratio
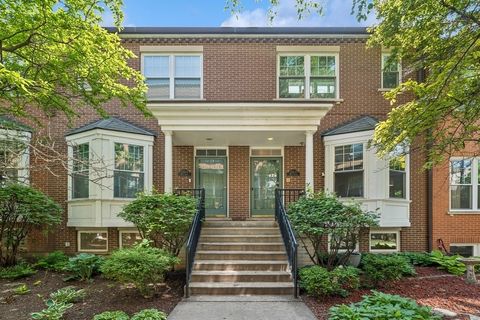
Active
$1,000,000
3
bds
|
4
ba
|
2,270
sqft
|
built
1998
250 W Scott St, Chicago, IL 60610
$-3,117
Cash flow
-16.3%
Cash-on-Cash Return
1.9%
Cap rate
0.5%
Rent to Value Ratio
Active
$230,000
5
bds
|
3
ba
|
2,280
sqft
|
built
2002
210 Church St, Lockport, LA 70374
$85
Cash flow
1.9%
Cash-on-Cash Return
6.1%
Cap rate
0.7%
Rent to Value Ratio
Active
$157,900
1
bds
|
1
ba
|
660
sqft
|
built
1925
50 Forest Ave, Riverside, IL 60546
$-342
Cash flow
-11.3%
Cash-on-Cash Return
3.1%
Cap rate
0.9%
Rent to Value Ratio
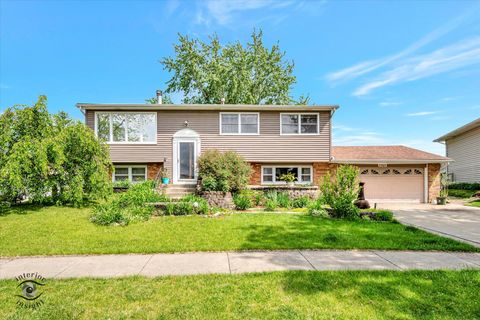
Active
$275,000
3
bds
|
2
ba
|
1,845
sqft
|
built
1960
506 Betty Ln, South Holland, IL 60473
$51
Cash flow
1.0%
Cash-on-Cash Return
5.9%
Cap rate
1.1%
Rent to Value Ratio
Active
$250,000
5
bds
|
2
ba
|
0
sqft
|
built
1948
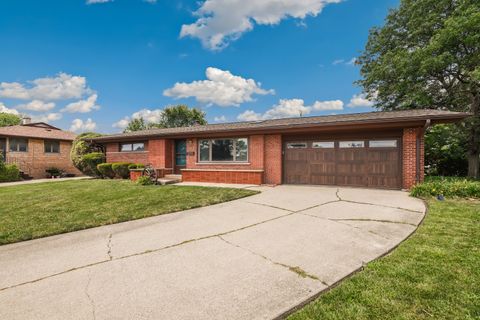
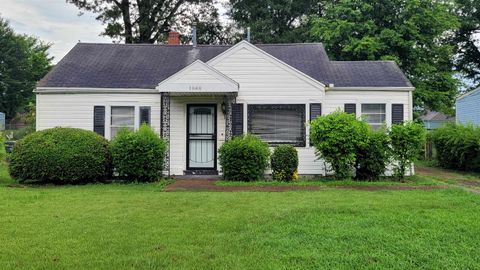
4972 Minden Rd, Memphis, TN 38117
$7
Cash flow
0.1%
Cash-on-Cash Return
5.7%
Cap rate
0.9%
Rent to Value Ratio
Active
$105,000
2
bds
|
1
ba
|
0
sqft
|
built
1954
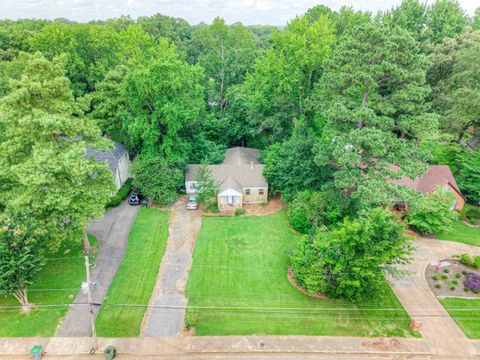
1848 Wynton St, Memphis, TN 38106
$272
Cash flow
13.5%
Cash-on-Cash Return
8.8%
Cap rate
1.1%
Rent to Value Ratio
Active
$289,900
3
bds
|
1
ba
|
1,344
sqft
|
built
7350 N 46th St, Augusta, MI 49012
$-563
Cash flow
-10.1%
Cash-on-Cash Return
3.8%
Cap rate
0.6%
Rent to Value Ratio
Active
$159,900
2
bds
|
1
ba
|
864
sqft
|
built
1972
36855 N Elizabeth Dr, Lake Villa, IL 60046
$87
Cash flow
2.8%
Cash-on-Cash Return
6.3%
Cap rate
1.1%
Rent to Value Ratio
Active
$215,000
3
bds
|
2
ba
|
1,074
sqft
|
built
1957
14322 S Hoxie Ave, Burnham, IL 60633
$-264
Cash flow
-6.4%
Cash-on-Cash Return
4.2%
Cap rate
1.1%
Rent to Value Ratio
Active
$427,000
4
bds
|
4
ba
|
2,770
sqft
|
built
1970
20832 Sparta Ln, Olympia Fields, IL 60461
$-363
Cash flow
-4.4%
Cash-on-Cash Return
4.7%
Cap rate
0.9%
Rent to Value Ratio

Active
$497,900
4
bds
|
3
ba
|
2,368
sqft
|
built
2016
9231 Trafalgar Dr SE, Alto, MI 49302
$-716
Cash flow
-7.5%
Cash-on-Cash Return
4.4%
Cap rate
0.7%
Rent to Value Ratio
Active
$424,900
2
bds
|
2
ba
|
0
sqft
|
built
1915
435 S Front St, Memphis, TN 38103
$-873
Cash flow
-10.7%
Cash-on-Cash Return
3.2%
Cap rate
0.5%
Rent to Value Ratio
Active
$115,000
3
bds
|
1
ba
|
0
sqft
|
built
1955
3358 Beechmont St, Memphis, TN 38127
$237
Cash flow
10.8%
Cash-on-Cash Return
8.1%
Cap rate
1.1%
Rent to Value Ratio
Active
$350,000
3
bds
|
2.5
ba
|
0
sqft
|
built
1996
1130 Hunters Green Cir S, Cordova, TN 38018
$-288
Cash flow
-4.3%
Cash-on-Cash Return
4.7%
Cap rate
0.7%
Rent to Value Ratio
Active
$799,000
3
bds
|
3
ba
|
1,570
sqft
|
built
1987
731 Edgewater Dr, Chula Vista, CA 91913
$-1,825
Cash flow
-11.9%
Cash-on-Cash Return
3.3%
Cap rate
0.5%
Rent to Value Ratio
Active
$1,390,000
3
bds
|
2
ba
|
1,254
sqft
|
built
1971
6809 Lipmann St, San Diego, CA 92122
$-3,441
Cash flow
-12.9%
Cash-on-Cash Return
3.1%
Cap rate
0.4%
Rent to Value Ratio
Active
$225,900
4
bds
|
1
ba
|
1,500
sqft
|
built
1908
9152 S Woodlawn Ave, Chicago, IL 60619
$223
Cash flow
5.2%
Cash-on-Cash Return
6.9%
Cap rate
0.8%
Rent to Value Ratio

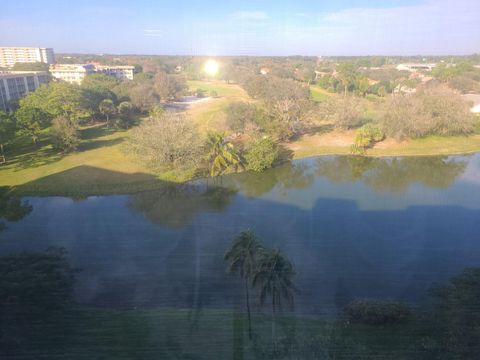
Active
$599,000
2
bds
|
2
ba
|
1,180
sqft
|
built
2008
1900 N Bayshore Dr, Miami, FL 33132
$-2,139
Cash flow
-18.6%
Cash-on-Cash Return
1.9%
Cap rate
0.7%
Rent to Value Ratio

Active
$485,000
4
bds
|
3
ba
|
1,997
sqft
|
built
2020
7702 Candle Rock St, North Las Vegas, NV 89084
$-1,190
Cash flow
-12.8%
Cash-on-Cash Return
3.3%
Cap rate
0.5%
Rent to Value Ratio
Active
$206,800
2
bds
|
2
ba
|
1,080
sqft
|
built
1987
15261 W Carlisle Cir, Park Hill, OK 74451
$-126
Cash flow
-3.2%
Cash-on-Cash Return
4.9%
Cap rate
0.6%
Rent to Value Ratio

Active
$484,900
3
bds
|
2
ba
|
1,615
sqft
|
built
1968
610 NW 38th Ct, Deerfield Beach, FL 33064
$-573
Cash flow
-6.2%
Cash-on-Cash Return
4.7%
Cap rate
0.7%
Rent to Value Ratio
Active
$1,995,911
7
bds
|
0
ba
|
13,668
sqft
|
built
2005
1416 Walcutts Way NW, Marietta, GA 30064
$-6,700
Cash flow
-17.5%
Cash-on-Cash Return
2.1%
Cap rate
0.4%
Rent to Value Ratio
Active
$439,000
4
bds
|
2
ba
|
2,874
sqft
|
built
1923
2445 Highland Ave, Berwyn, IL 60402
$-700
Cash flow
-8.3%
Cash-on-Cash Return
3.8%
Cap rate
0.5%
Rent to Value Ratio
Active
$199,990
2
bds
|
2
ba
|
1,216
sqft
|
built
1981
3499 Oaks Way, Pompano Beach, FL 33069
$-661
Cash flow
-17.2%
Cash-on-Cash Return
2.2%
Cap rate
1.2%
Rent to Value Ratio
Active
$325,000
4
bds
|
2
ba
|
0
sqft
|
built
1974
7707 Bristol Ln, Tinley Park, IL 60477
$-369
Cash flow
-5.9%
Cash-on-Cash Return
4.3%
Cap rate
0.8%
Rent to Value Ratio
Active
$399,900
3
bds
|
4
ba
|
2,100
sqft
|
built
2003
1858 David Ave, Joliet, IL 60433
$-1,557
Cash flow
-20.3%
Cash-on-Cash Return
1.0%
Cap rate
0.4%
Rent to Value Ratio
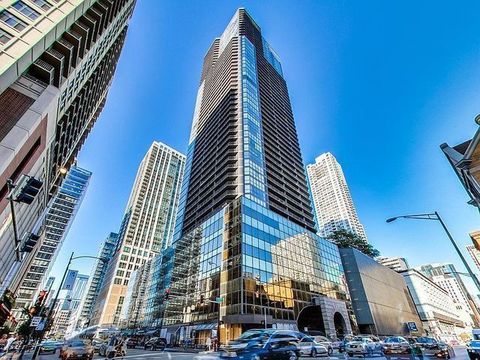
Active
$249,900
1
bds
|
1
ba
|
795
sqft
|
built
1983
10 E Ontario St, Chicago, IL 60611
$-691
Cash flow
-14.4%
Cash-on-Cash Return
2.4%
Cap rate
0.8%
Rent to Value Ratio
Active
$255,000
3
bds
|
1
ba
|
1,107
sqft
|
built
1912
414 Western Ln, Anoka, MN 55303
$-404
Cash flow
-8.3%
Cash-on-Cash Return
3.8%
Cap rate
0.5%
Rent to Value Ratio
Active
$275,000
2
bds
|
1
ba
|
0
sqft
|
built
1925
615 NW 26th St, Oklahoma City, OK 73103
$-301
Cash flow
-5.7%
Cash-on-Cash Return
4.4%
Cap rate
0.6%
Rent to Value Ratio
Active
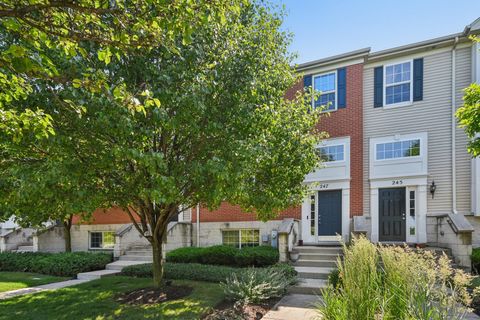
$339,900
4
bds
|
3
ba
|
2,256
sqft
|
built
2008
247 Jackson St, Gilberts, IL 60136
$-480
Cash flow
-7.4%
Cash-on-Cash Return
4.0%
Cap rate
0.8%
Rent to Value Ratio

Active
$118,900
4
bds
|
0
ba
|
0
sqft
|
built
1966
1189 Hartley St, Macon, GA 31206
$182
Cash flow
8.0%
Cash-on-Cash Return
8.0%
Cap rate
1.0%
Rent to Value Ratio
Active
$430,000
4
bds
|
3
ba
|
1,946
sqft
|
built
1999
32526 Pilgrims Ct, Lakemoor, IL 60051
$-1,071
Cash flow
-13.0%
Cash-on-Cash Return
2.7%
Cap rate
0.6%
Rent to Value Ratio
Active
$284,900
3
bds
|
2
ba
|
1,174
sqft
|
built
1958
841 112th Ave NW, Coon Rapids, MN 55448
$-178
Cash flow
-3.3%
Cash-on-Cash Return
4.9%
Cap rate
0.7%
Rent to Value Ratio