Castle Rock, CO Investment Properties for Sale
Browse homes for sale and investment properties in Castle Rock, CO. Refine your search by price, property type, or more.
Best cash flowing properties in Castle Rock, CO

Active
$179,000
1
bds
|
1
ba
|
634
sqft
|
built
1984
1261 S Gilbert St, Castle Rock, CO 80104
$-271
Cash flow
-7.9%
Cash-on-Cash Return
3.9%
Cap rate
0.8%
Rent to Value Ratio

Active
$419,900
2
bds
|
1
ba
|
778
sqft
|
built
1987
45 N Bedford Ave, Castle Rock, CO 80104
$-753
Cash flow
-9.4%
Cash-on-Cash Return
3.5%
Cap rate
0.5%
Rent to Value Ratio
258 out of 262 properties for sale in Castle Rock, CO
Limited Results Shown
Create a free account, or log in to reveal all property listings and enjoy the complete experience.
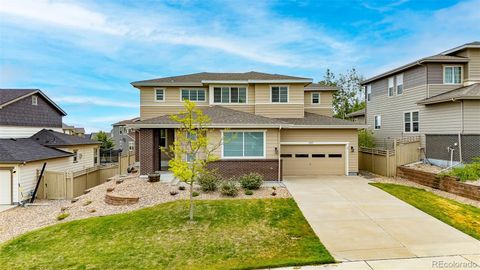
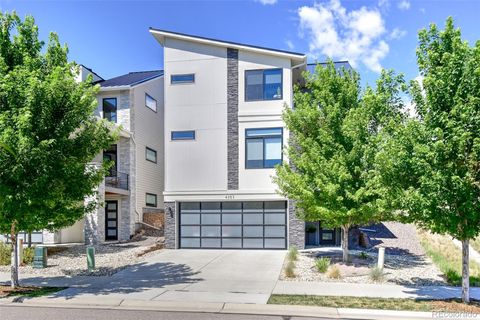
Active
$900,000
3
bds
|
3
ba
|
2,911
sqft
|
built
2016
4378 Fell Mist Way, Castle Rock, CO 80109
$-2,301
Cash flow
-13.3%
Cash-on-Cash Return
2.6%
Cap rate
0.4%
Rent to Value Ratio
Active
$1,100,000
5
bds
|
5
ba
|
4,768
sqft
|
built
2001
3266 Coyote Hills Way, Castle Rock, CO 80109
$-2,956
Cash flow
-14.0%
Cash-on-Cash Return
2.5%
Cap rate
0.4%
Rent to Value Ratio
Active
$875,000
4
bds
|
4
ba
|
3,219
sqft
|
built
2016
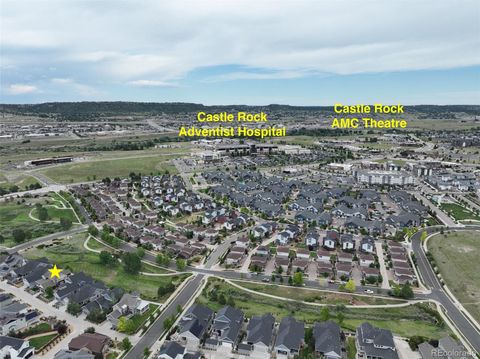
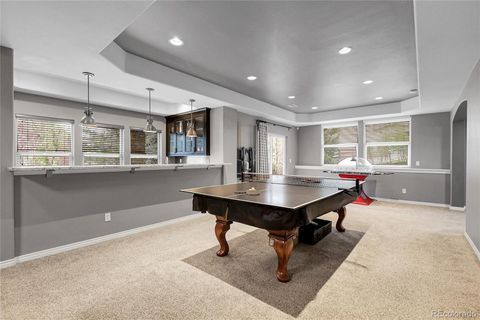
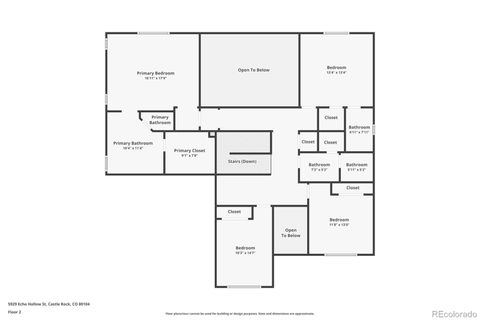
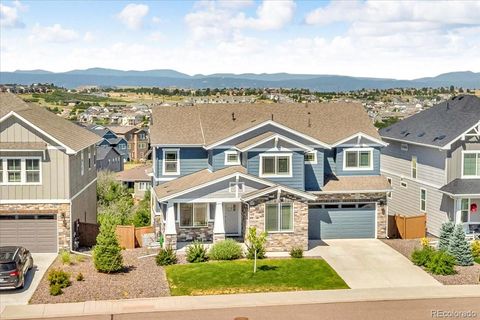
5929 Echo Hollow St, Castle Rock, CO 80104
$-1,914
Cash flow
-11.4%
Cash-on-Cash Return
3.1%
Cap rate
0.4%
Rent to Value Ratio
Active
$950,000
5
bds
|
4
ba
|
4,434
sqft
|
built
2020
1721 Wingfeather Ln, Castle Rock, CO 80108
$-2,446
Cash flow
-13.4%
Cash-on-Cash Return
2.6%
Cap rate
0.4%
Rent to Value Ratio
Active
$839,000
3
bds
|
2
ba
|
2,138
sqft
|
built
2021
6899 Petunia Pl, Castle Rock, CO 80108
$-2,462
Cash flow
-15.3%
Cash-on-Cash Return
2.2%
Cap rate
0.4%
Rent to Value Ratio
Active
$1,280,000
5
bds
|
4
ba
|
5,208
sqft
|
built
2022
3348 Offbeaten Pl, Castle Rock, CO 80108
$-3,272
Cash flow
-13.3%
Cash-on-Cash Return
2.6%
Cap rate
0.4%
Rent to Value Ratio
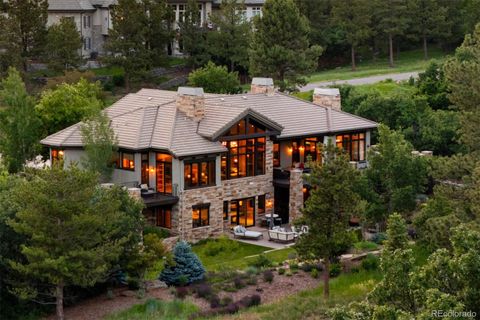
Active
$4,795,000
7
bds
|
8
ba
|
10,846
sqft
|
built
2007
7615 Lemon Gulch Way, Castle Rock, CO 80108
$-21,680
Cash flow
-23.6%
Cash-on-Cash Return
0.3%
Cap rate
0.1%
Rent to Value Ratio
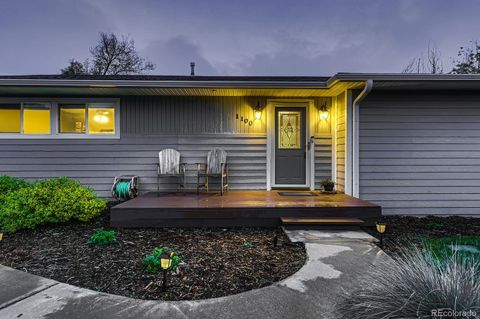
Active
$1,195,000
6
bds
|
5
ba
|
4,249
sqft
|
built
2002
1302 Milbury St, Castle Rock, CO 80104
$-3,476
Cash flow
-15.2%
Cash-on-Cash Return
2.2%
Cap rate
0.3%
Rent to Value Ratio
Active
$1,449,995
5
bds
|
4
ba
|
4,264
sqft
|
built
2001
4781 Mariposa Rd, Castle Rock, CO 80104
$-5,136
Cash flow
-18.5%
Cash-on-Cash Return
1.4%
Cap rate
0.3%
Rent to Value Ratio
Active
$1,450,000
4
bds
|
5
ba
|
4,203
sqft
|
built
2020
6725 Mentha Dr, Castle Rock, CO 80108
$-4,158
Cash flow
-15.0%
Cash-on-Cash Return
2.2%
Cap rate
0.3%
Rent to Value Ratio

Active
$700,000
4
bds
|
4
ba
|
3,573
sqft
|
built
2019
3945 John Ave, Castle Rock, CO 80104
$-1,492
Cash flow
-11.1%
Cash-on-Cash Return
3.1%
Cap rate
0.5%
Rent to Value Ratio
Active
$665,000
4
bds
|
3
ba
|
2,994
sqft
|
built
2020
2060 Peralta Loop, Castle Rock, CO 80104
$-1,355
Cash flow
-10.6%
Cash-on-Cash Return
3.2%
Cap rate
0.5%
Rent to Value Ratio
Active
$699,900
6
bds
|
4
ba
|
4,113
sqft
|
built
2014
7812 Blue Water Dr, Castle Rock, CO 80108
$-1,744
Cash flow
-13.0%
Cash-on-Cash Return
2.7%
Cap rate
0.5%
Rent to Value Ratio
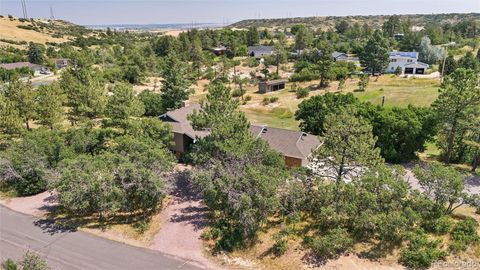
Active
$639,000
4
bds
|
2
ba
|
1,700
sqft
|
built
1961
1100 E Harvey St, Castle Rock, CO 80108
$-1,079
Cash flow
-8.8%
Cash-on-Cash Return
3.7%
Cap rate
0.5%
Rent to Value Ratio
Active
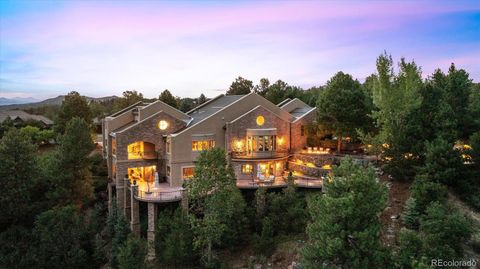
$3,300,000
4
bds
|
4
ba
|
5,828
sqft
|
built
2002
7 Elk Pointe Ln, Castle Rock, CO 80108
$-13,351
Cash flow
-21.1%
Cash-on-Cash Return
0.8%
Cap rate
0.2%
Rent to Value Ratio
Active
$820,000
5
bds
|
5
ba
|
4,156
sqft
|
built
2014
4145 Manorbrier Cir, Castle Rock, CO 80104
$-1,802
Cash flow
-11.5%
Cash-on-Cash Return
3.0%
Cap rate
0.5%
Rent to Value Ratio
Active
$3,450,000
5
bds
|
7
ba
|
6,017
sqft
|
built
1999
786 International Isle Dr, Castle Rock, CO 80108
$-13,944
Cash flow
-21.1%
Cash-on-Cash Return
0.8%
Cap rate
0.2%
Rent to Value Ratio

Active
$2,785,000
6
bds
|
8
ba
|
7,729
sqft
|
built
2009
4605 Tierra Alta Dr, Castle Rock, CO 80104
$-7,364
Cash flow
-13.8%
Cash-on-Cash Return
2.5%
Cap rate
0.4%
Rent to Value Ratio
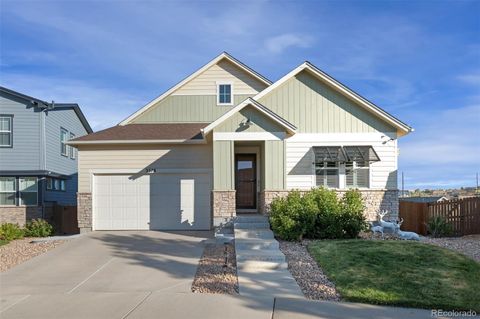
Active
$600,000
3
bds
|
3
ba
|
2,263
sqft
|
built
2021
4781 Rosette St, Castle Rock, CO 80104
$-765
Cash flow
-6.7%
Cash-on-Cash Return
4.1%
Cap rate
0.6%
Rent to Value Ratio
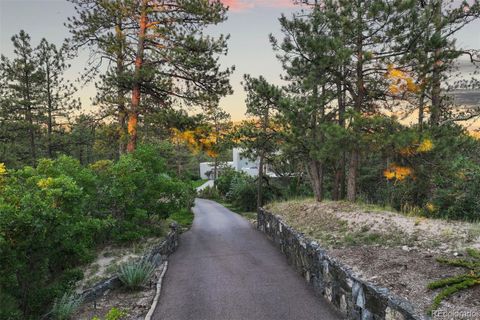
Active
$2,950,000
2
bds
|
2
ba
|
1,607
sqft
|
built
1976
450 E Happy Canyon Rd, Castle Rock, CO 80108
$-10,573
Cash flow
-18.7%
Cash-on-Cash Return
1.4%
Cap rate
0.2%
Rent to Value Ratio
Active
$515,000
3
bds
|
2
ba
|
1,387
sqft
|
built
1997
3879 Primrose Ln, Castle Rock, CO 80109
$-761
Cash flow
-7.7%
Cash-on-Cash Return
3.9%
Cap rate
0.5%
Rent to Value Ratio

Active
$799,500
5
bds
|
3
ba
|
3,253
sqft
|
built
2003
4069 Copper Ct, Castle Rock, CO 80104
$-1,518
Cash flow
-9.9%
Cash-on-Cash Return
3.4%
Cap rate
0.5%
Rent to Value Ratio
Active
$645,000
3
bds
|
3
ba
|
2,853
sqft
|
built
2016
3584 New Haven Cir, Castle Rock, CO 80109
$-1,503
Cash flow
-12.2%
Cash-on-Cash Return
2.9%
Cap rate
0.5%
Rent to Value Ratio

Active
$1,125,000
4
bds
|
5
ba
|
5,797
sqft
|
built
2005
5463 Killen Ave, Castle Rock, CO 80104
$-3,077
Cash flow
-14.3%
Cash-on-Cash Return
2.4%
Cap rate
0.4%
Rent to Value Ratio
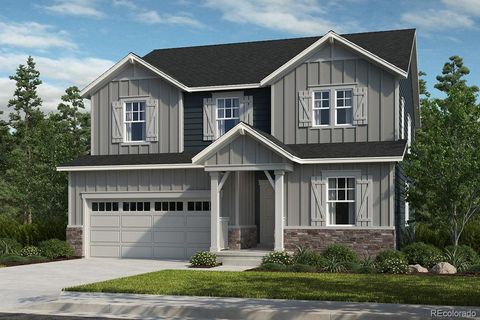
Active
$850,000
3
bds
|
4
ba
|
2,502
sqft
|
built
2018
648 Sage Grouse Cir, Castle Rock, CO 80109
$-1,955
Cash flow
-12.0%
Cash-on-Cash Return
2.9%
Cap rate
0.4%
Rent to Value Ratio
Active
$1,050,000
5
bds
|
4
ba
|
3,109
sqft
|
built
2018
4353 N Meadows Dr, Castle Rock, CO 80109
$-1,991
Cash flow
-9.9%
Cash-on-Cash Return
3.4%
Cap rate
0.5%
Rent to Value Ratio
Active
$620,000
2
bds
|
2
ba
|
1,636
sqft
|
built
2016
3591 New Haven Cir, Castle Rock, CO 80109
$-1,646
Cash flow
-13.9%
Cash-on-Cash Return
2.5%
Cap rate
0.5%
Rent to Value Ratio
Active
$535,000
4
bds
|
2
ba
|
2,050
sqft
|
built
1994
4912 N Silverlace Dr, Castle Rock, CO 80109
$-873
Cash flow
-8.5%
Cash-on-Cash Return
3.7%
Cap rate
0.5%
Rent to Value Ratio

Active
$659,000
3
bds
|
2
ba
|
1,767
sqft
|
built
2022
4365 Hidden Gulch Rd, Castle Rock, CO 80104
$-1,215
Cash flow
-9.6%
Cash-on-Cash Return
3.5%
Cap rate
0.5%
Rent to Value Ratio
Active
$2,750,000
5
bds
|
8
ba
|
7,694
sqft
|
built
2003
360 Morning Star Way, Castle Rock, CO 80108
$-8,115
Cash flow
-15.4%
Cash-on-Cash Return
2.1%
Cap rate
0.4%
Rent to Value Ratio

Active
$570,000
5
bds
|
3
ba
|
2,401
sqft
|
built
1994
5133 Essex Ave, Castle Rock, CO 80104
$-1,087
Cash flow
-9.9%
Cash-on-Cash Return
3.4%
Cap rate
0.5%
Rent to Value Ratio
Active
$664,900
3
bds
|
4
ba
|
2,812
sqft
|
built
2013
3278 Ghost Dance Dr, Castle Rock, CO 80108
$-1,316
Cash flow
-10.3%
Cash-on-Cash Return
3.3%
Cap rate
0.5%
Rent to Value Ratio
Active
$780,000
4
bds
|
3
ba
|
2,761
sqft
|
built
2022
2018 Peachleaf Loop, Castle Rock, CO 80108
$-1,777
Cash flow
-11.9%
Cash-on-Cash Return
2.9%
Cap rate
0.4%
Rent to Value Ratio

Active
$899,900
4
bds
|
3
ba
|
3,786
sqft
|
built
2003
5289 Fairfield Cir, Castle Rock, CO 80104
$-2,311
Cash flow
-13.4%
Cash-on-Cash Return
2.6%
Cap rate
0.4%
Rent to Value Ratio
Active
$1,230,000
4
bds
|
4
ba
|
3,077
sqft
|
built
1969
9474 Bay Ln, Castle Rock, CO 80108
$-2,403
Cash flow
-10.2%
Cash-on-Cash Return
3.3%
Cap rate
0.5%
Rent to Value Ratio

Active
$739,000
5
bds
|
3
ba
|
3,207
sqft
|
built
2018
2789 Echo Park Dr, Castle Rock, CO 80104
$-1,694
Cash flow
-12.0%
Cash-on-Cash Return
2.9%
Cap rate
0.4%
Rent to Value Ratio

Active
$592,310
3
bds
|
3
ba
|
2,417
sqft
|
built
2003
359 Cherry St, Castle Rock, CO 80104
$-1,173
Cash flow
-10.3%
Cash-on-Cash Return
3.3%
Cap rate
0.5%
Rent to Value Ratio

Active
$2,750,000
5
bds
|
5
ba
|
6,643
sqft
|
built
2007
4604 Tierra Alta Dr, Castle Rock, CO 80104
$-7,864
Cash flow
-14.9%
Cash-on-Cash Return
2.2%
Cap rate
0.3%
Rent to Value Ratio