Cedar Springs, MI Investment Properties for Sale
Browse homes for sale and investment properties in Cedar Springs, MI. Refine your search by price, property type, or more.
Best cash flowing properties in Cedar Springs, MI
Active
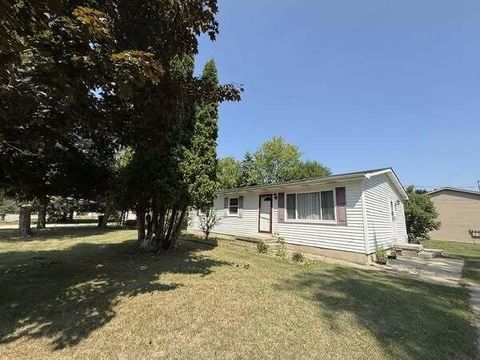
$220,000
3
bds
|
1
ba
|
1,100
sqft
|
built
1950
340 West St, Cedar Springs, MI 49319
$-13
Cash flow
-0.3%
Cash-on-Cash Return
6.1%
Cap rate
0.8%
Rent to Value Ratio
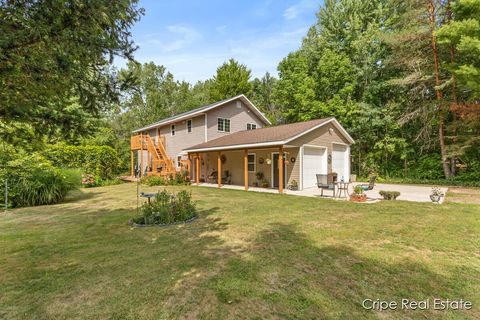
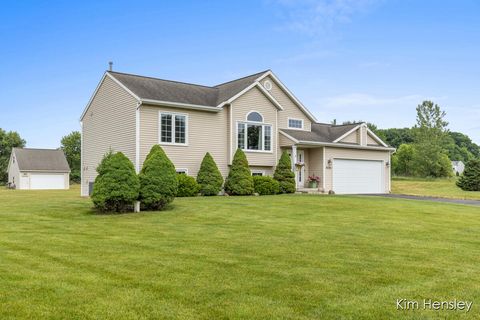
Active
$365,000
4
bds
|
2
ba
|
2,980
sqft
|
built
2012
6037 16 Mile Rd NE, Cedar Springs, MI 49319
$-133
Cash flow
-1.9%
Cash-on-Cash Return
5.7%
Cap rate
0.8%
Rent to Value Ratio
20 out of 21 properties for sale in Cedar Springs, MI
Limited Results Shown
Create a free account, or log in to reveal all property listings and enjoy the complete experience.

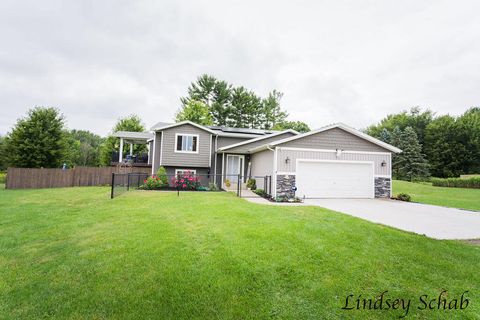
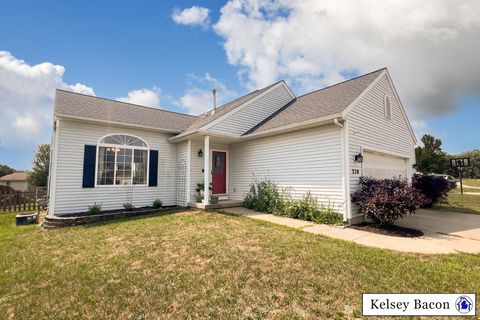
Active
$329,900
4
bds
|
3
ba
|
2,173
sqft
|
built
1989
6767 Wildwood Ct, Cedar Springs, MI 49319
$-243
Cash flow
-3.8%
Cash-on-Cash Return
5.3%
Cap rate
0.8%
Rent to Value Ratio
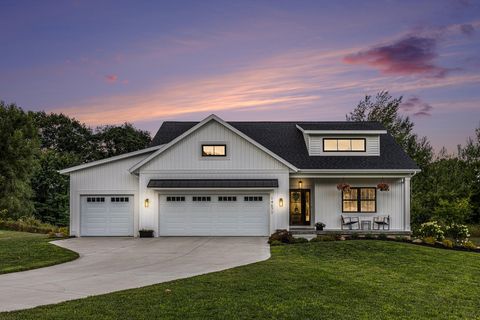
Active
$475,000
4
bds
|
3
ba
|
2,300
sqft
|
built
1995
15333 Cedar Springs Ave, Cedar Springs, MI 49319
$-938
Cash flow
-10.3%
Cash-on-Cash Return
3.8%
Cap rate
0.6%
Rent to Value Ratio
Active
$575,000
4
bds
|
3
ba
|
2,550
sqft
|
built
2022
14671 Aveinida Dr NE, Cedar Springs, MI 49319
$-1,728
Cash flow
-15.7%
Cash-on-Cash Return
2.5%
Cap rate
0.4%
Rent to Value Ratio
Active
$650,000
5
bds
|
3
ba
|
2,699
sqft
|
built
2019
2590 Recluse Dr, Cedar Springs, MI 49319
$-1,789
Cash flow
-14.4%
Cash-on-Cash Return
2.8%
Cap rate
0.5%
Rent to Value Ratio
Active
$399,900
4
bds
|
2
ba
|
1,574
sqft
|
built
2004
4233 Ives Farm Ln NE, Cedar Springs, MI 49319
$-938
Cash flow
-12.2%
Cash-on-Cash Return
3.3%
Cap rate
0.6%
Rent to Value Ratio
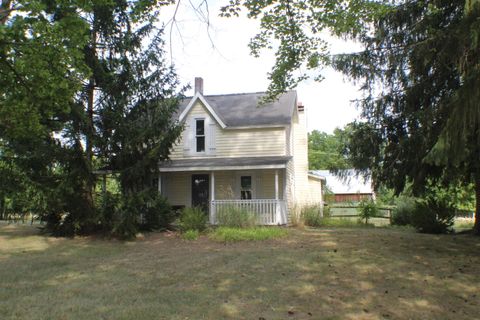
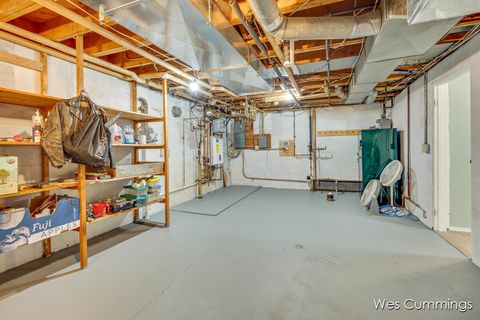
Active
$285,000
2
bds
|
1
ba
|
1,325
sqft
|
built
1900
15272 White Creek Ave NE, Cedar Springs, MI 49319
$-371
Cash flow
-6.8%
Cash-on-Cash Return
4.6%
Cap rate
0.6%
Rent to Value Ratio
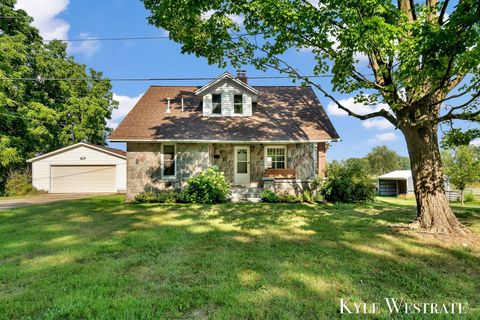
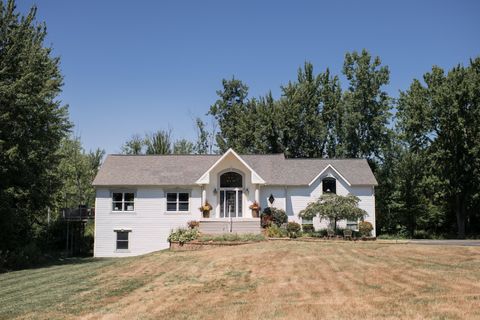
Active
$419,900
4
bds
|
2
ba
|
1,755
sqft
|
built
1915
16500 Simmons Ave NE, Cedar Springs, MI 49319
$-533
Cash flow
-6.6%
Cash-on-Cash Return
4.6%
Cap rate
0.7%
Rent to Value Ratio
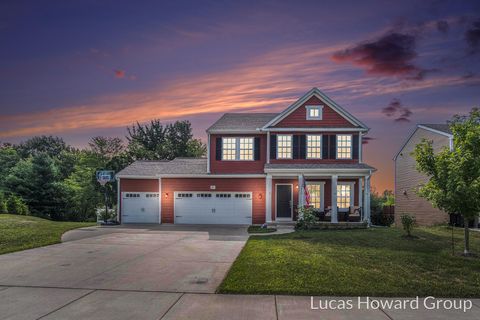
Active
$299,000
4
bds
|
2
ba
|
1,944
sqft
|
built
1999
270 Settlers Pass, Cedar Springs, MI 49319
$-643
Cash flow
-11.2%
Cash-on-Cash Return
3.6%
Cap rate
0.7%
Rent to Value Ratio
Active
$325,000
3
bds
|
2
ba
|
1,876
sqft
|
built
1962
350 E Beech St, Cedar Springs, MI 49319
$-472
Cash flow
-7.6%
Cash-on-Cash Return
4.4%
Cap rate
0.7%
Rent to Value Ratio

Active
$329,000
3
bds
|
2
ba
|
1,906
sqft
|
built
2019
15727 Albrecht Ave NE, Cedar Springs, MI 49319
$-376
Cash flow
-6.0%
Cash-on-Cash Return
4.8%
Cap rate
0.8%
Rent to Value Ratio
Active
$649,900
4
bds
|
4
ba
|
3,400
sqft
|
built
1999
4707 Indian Lakes Rd, Cedar Springs, MI 49319
$-1,682
Cash flow
-13.5%
Cash-on-Cash Return
3.0%
Cap rate
0.4%
Rent to Value Ratio

Active
$365,000
4
bds
|
4
ba
|
2,004
sqft
|
built
1991
12012 Myers Lake Ave NE, Cedar Springs, MI 49319
$-354
Cash flow
-5.1%
Cash-on-Cash Return
5.0%
Cap rate
0.7%
Rent to Value Ratio
Active
$479,000
5
bds
|
4
ba
|
3,492
sqft
|
built
2017
490 Pioneer Trl, Cedar Springs, MI 49319
$-1,062
Cash flow
-11.6%
Cash-on-Cash Return
3.5%
Cap rate
0.6%
Rent to Value Ratio
Active
$575,000
3
bds
|
3
ba
|
2,299
sqft
|
built
2001
13025 Shaner Ave NE, Cedar Springs, MI 49319
$-1,252
Cash flow
-11.4%
Cash-on-Cash Return
3.5%
Cap rate
0.5%
Rent to Value Ratio
Active
$399,900
4
bds
|
2
ba
|
1,537
sqft
|
built
1988
6951 19 Mile Rd NE, Cedar Springs, MI 49319
$-526
Cash flow
-6.9%
Cash-on-Cash Return
4.6%
Cap rate
0.6%
Rent to Value Ratio

Active
$349,900
4
bds
|
3
ba
|
1,822
sqft
|
built
2022
571 Pioneer Trl, Cedar Springs, MI 49319
$-931
Cash flow
-13.9%
Cash-on-Cash Return
3.0%
Cap rate
0.7%
Rent to Value Ratio

Active
$439,900
4
bds
|
2
ba
|
2,542
sqft
|
built
2007
2355 18 Mile Rd NE, Cedar Springs, MI 49319
$-757
Cash flow
-9.0%
Cash-on-Cash Return
4.1%
Cap rate
0.6%
Rent to Value Ratio

Active
$439,999
3
bds
|
2
ba
|
1,710
sqft
|
built
1920
2030 19 Mile Rd NE, Cedar Springs, MI 49319
$-711
Cash flow
-8.4%
Cash-on-Cash Return
4.2%
Cap rate
0.6%
Rent to Value Ratio