Chandler, AZ Investment Properties for Sale
Browse homes for sale and investment properties in Chandler, AZ. Refine your search by price, property type, or more.
Best cash flowing properties in Chandler, AZ
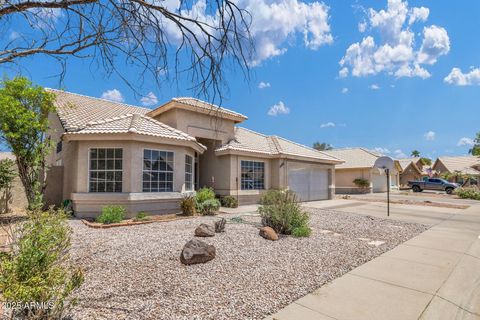
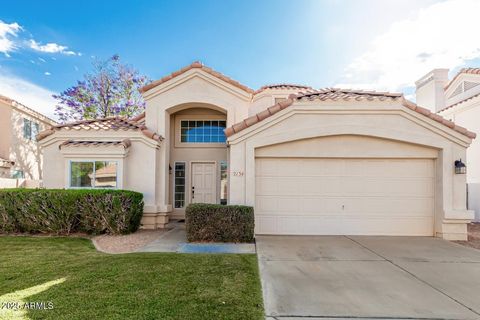
Active
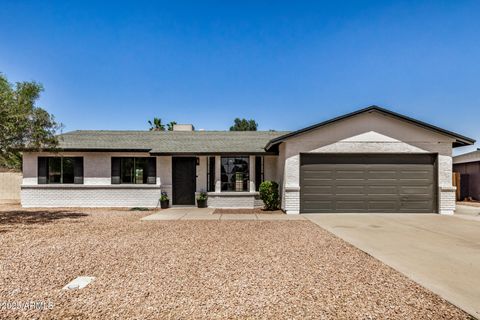
$297,500
2
bds
|
2
ba
|
1,128
sqft
|
built
2006
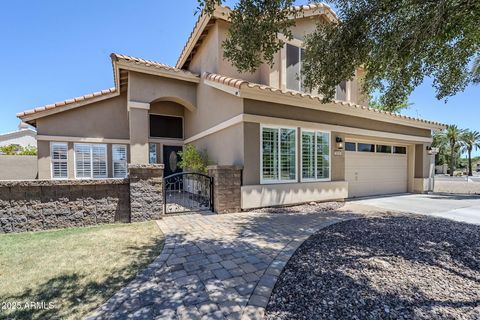
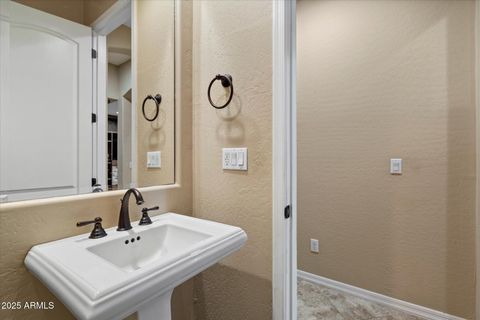
3330 S Gilbert Rd, Chandler, AZ 85286
$-557
Cash flow
-9.8%
Cash-on-Cash Return
4.0%
Cap rate
0.7%
Rent to Value Ratio

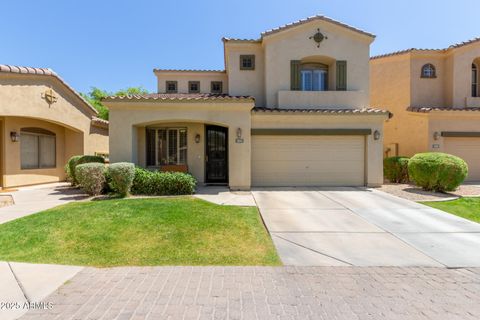
Active
$320,000
2
bds
|
2
ba
|
982
sqft
|
built
1985
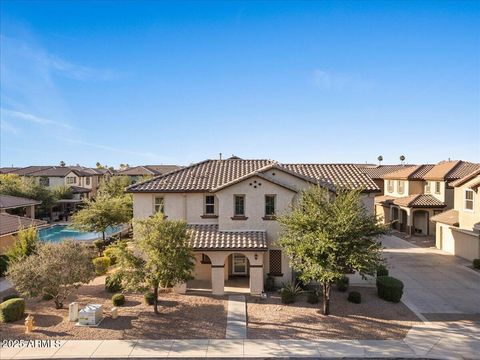
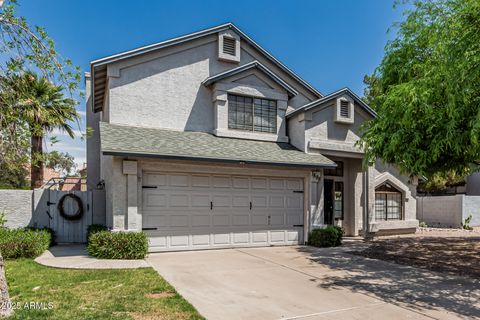
1976 N Lemon Tree Ln, Chandler, AZ 85224
$-710
Cash flow
-11.6%
Cash-on-Cash Return
3.6%
Cap rate
0.6%
Rent to Value Ratio
629 out of 658 properties for sale in Chandler, AZ
Limited Results Shown
Create a free account, or log in to reveal all property listings and enjoy the complete experience.
Active
$1,190,000
6
bds
|
4
ba
|
4,608
sqft
|
built
2005
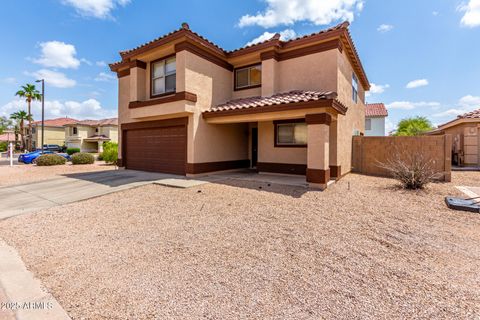
861 E Canyon Way, Chandler, AZ 85249
$-2,845
Cash flow
-12.5%
Cash-on-Cash Return
3.4%
Cap rate
0.5%
Rent to Value Ratio
Active
$1,375,000
4
bds
|
3
ba
|
2,952
sqft
|
built
1999
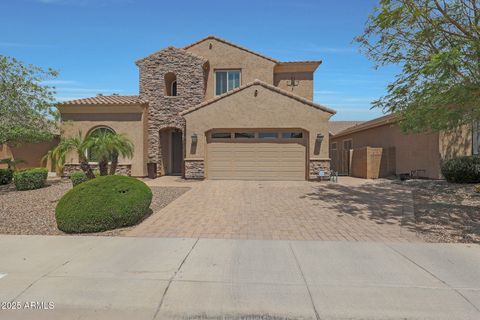
1724 W Blue Ridge Way, Chandler, AZ 85248
$-3,429
Cash flow
-13.0%
Cash-on-Cash Return
3.3%
Cap rate
0.5%
Rent to Value Ratio

Active
$954,999
4
bds
|
3
ba
|
2,632
sqft
|
built
1995
802 N Lisbon Dr, Chandler, AZ 85226
$-3,144
Cash flow
-17.2%
Cash-on-Cash Return
2.3%
Cap rate
0.3%
Rent to Value Ratio

Active
$823,000
4
bds
|
3
ba
|
3,394
sqft
|
built
2005
2144 E Honeysuckle Pl, Chandler, AZ 85286
$-2,548
Cash flow
-16.2%
Cash-on-Cash Return
2.6%
Cap rate
0.4%
Rent to Value Ratio
Active
$849,999
4
bds
|
3
ba
|
2,993
sqft
|
built
2002
3114 E Capricorn Way, Chandler, AZ 85249
$-2,611
Cash flow
-16.0%
Cash-on-Cash Return
2.6%
Cap rate
0.4%
Rent to Value Ratio
Active
$625,000
5
bds
|
2
ba
|
2,600
sqft
|
built
1990
3580 W Dublin St, Chandler, AZ 85226
$-1,565
Cash flow
-13.1%
Cash-on-Cash Return
3.3%
Cap rate
0.4%
Rent to Value Ratio
Active
$540,000
4
bds
|
3
ba
|
2,137
sqft
|
built
2001
2043 W Periwinkle Way, Chandler, AZ 85248
$-1,303
Cash flow
-12.6%
Cash-on-Cash Return
3.4%
Cap rate
0.5%
Rent to Value Ratio
Active
$625,000
3
bds
|
3
ba
|
2,412
sqft
|
built
2015
242 N Crosscreek Dr, Chandler, AZ 85225
$-1,751
Cash flow
-14.6%
Cash-on-Cash Return
2.9%
Cap rate
0.4%
Rent to Value Ratio
Active
$839,000
3
bds
|
3
ba
|
2,404
sqft
|
built
2018
4050 S Thistle Dr, Chandler, AZ 85248
$-1,852
Cash flow
-11.5%
Cash-on-Cash Return
3.6%
Cap rate
0.5%
Rent to Value Ratio
Active
$539,900
4
bds
|
3
ba
|
1,937
sqft
|
built
2021
300 N Gila Springs Blvd, Chandler, AZ 85226
$-1,198
Cash flow
-11.6%
Cash-on-Cash Return
3.6%
Cap rate
0.6%
Rent to Value Ratio
Active
$1,125,000
4
bds
|
3
ba
|
3,206
sqft
|
built
2020
2052 E Scorpio Pl, Chandler, AZ 85249
$-3,822
Cash flow
-17.7%
Cash-on-Cash Return
2.2%
Cap rate
0.3%
Rent to Value Ratio
Active
$350,000
3
bds
|
3
ba
|
1,400
sqft
|
built
1986
3930 W Monterey St, Chandler, AZ 85226
$-773
Cash flow
-11.5%
Cash-on-Cash Return
3.6%
Cap rate
0.6%
Rent to Value Ratio
Active
$975,000
6
bds
|
4
ba
|
4,666
sqft
|
built
2001
1951 W Bartlett Ct, Chandler, AZ 85248
$-2,898
Cash flow
-15.5%
Cash-on-Cash Return
2.7%
Cap rate
0.4%
Rent to Value Ratio
Active
$774,500
5
bds
|
3
ba
|
2,826
sqft
|
built
1990
1311 N Congress Dr, Chandler, AZ 85226
$-2,128
Cash flow
-14.3%
Cash-on-Cash Return
3.0%
Cap rate
0.4%
Rent to Value Ratio

Active
$639,900
5
bds
|
3
ba
|
2,511
sqft
|
built
1999
1254 W Browning Way, Chandler, AZ 85286
$-1,712
Cash flow
-14.0%
Cash-on-Cash Return
3.1%
Cap rate
0.4%
Rent to Value Ratio
Active
$540,000
4
bds
|
3
ba
|
2,275
sqft
|
built
2015
2868 E Binner Dr, Chandler, AZ 85225
$-1,331
Cash flow
-12.9%
Cash-on-Cash Return
3.3%
Cap rate
0.5%
Rent to Value Ratio
Active
$824,000
4
bds
|
3
ba
|
2,948
sqft
|
built
2017
970 W Zion Way, Chandler, AZ 85248
$-2,124
Cash flow
-13.4%
Cash-on-Cash Return
3.2%
Cap rate
0.5%
Rent to Value Ratio
Active
$1,200,000
5
bds
|
4
ba
|
4,608
sqft
|
built
2005
921 E Canyon Way, Chandler, AZ 85249
$-2,605
Cash flow
-11.3%
Cash-on-Cash Return
3.7%
Cap rate
0.5%
Rent to Value Ratio
Active
$505,000
3
bds
|
2
ba
|
1,474
sqft
|
built
1984
2124 E Boston St, Chandler, AZ 85225
$-1,225
Cash flow
-12.7%
Cash-on-Cash Return
3.4%
Cap rate
0.4%
Rent to Value Ratio
Active
$398,500
2
bds
|
2
ba
|
1,159
sqft
|
built
1980
815 W El Prado Rd, Chandler, AZ 85225
$-872
Cash flow
-11.4%
Cash-on-Cash Return
3.6%
Cap rate
0.5%
Rent to Value Ratio
Active
$688,900
4
bds
|
2
ba
|
2,317
sqft
|
built
1996
835 W Beechnut Dr, Chandler, AZ 85248
$-1,793
Cash flow
-13.6%
Cash-on-Cash Return
3.1%
Cap rate
0.4%
Rent to Value Ratio

Active
$1,450,000
4
bds
|
3
ba
|
3,902
sqft
|
built
1996
3665 S Jojoba Way, Chandler, AZ 85248
$-3,406
Cash flow
-12.3%
Cash-on-Cash Return
3.4%
Cap rate
0.5%
Rent to Value Ratio
Active
$875,000
5
bds
|
3
ba
|
3,728
sqft
|
built
2004
1970 E Yellowstone Pl, Chandler, AZ 85249
$-2,570
Cash flow
-15.3%
Cash-on-Cash Return
2.7%
Cap rate
0.4%
Rent to Value Ratio
Active
$550,000
3
bds
|
3
ba
|
1,613
sqft
|
built
1992
2134 W Peninsula Cir, Chandler, AZ 85248
$-1,368
Cash flow
-13.0%
Cash-on-Cash Return
3.3%
Cap rate
0.5%
Rent to Value Ratio
Active
$785,000
4
bds
|
3
ba
|
2,757
sqft
|
built
2003
6870 S Justin Way, Chandler, AZ 85249
$-2,347
Cash flow
-15.6%
Cash-on-Cash Return
2.7%
Cap rate
0.4%
Rent to Value Ratio
Active
$749,900
5
bds
|
3
ba
|
2,905
sqft
|
built
2001
702 E Capricorn Way, Chandler, AZ 85249
$-1,923
Cash flow
-13.4%
Cash-on-Cash Return
3.2%
Cap rate
0.5%
Rent to Value Ratio

Active
$1,575,000
6
bds
|
5
ba
|
5,236
sqft
|
built
2004
1890 E Sagittarius Pl, Chandler, AZ 85249
$-5,940
Cash flow
-19.7%
Cash-on-Cash Return
1.7%
Cap rate
0.3%
Rent to Value Ratio
Active
$1,175,000
4
bds
|
4
ba
|
3,244
sqft
|
built
2008
5226 S Fairchild Ln, Chandler, AZ 85249
$-4,150
Cash flow
-18.4%
Cash-on-Cash Return
2.0%
Cap rate
0.3%
Rent to Value Ratio
Active
$899,900
5
bds
|
4
ba
|
4,377
sqft
|
built
2006
3350 S Holguin Way, Chandler, AZ 85248
$-2,065
Cash flow
-12.0%
Cash-on-Cash Return
3.5%
Cap rate
0.5%
Rent to Value Ratio
Active
$547,500
4
bds
|
3
ba
|
2,166
sqft
|
built
1989
1898 E Kent Ave, Chandler, AZ 85225
$-1,190
Cash flow
-11.3%
Cash-on-Cash Return
3.7%
Cap rate
0.5%
Rent to Value Ratio
Active
$429,000
3
bds
|
3
ba
|
1,837
sqft
|
built
2002
2893 E Cherry Hills Dr, Chandler, AZ 85249
$-887
Cash flow
-10.8%
Cash-on-Cash Return
3.8%
Cap rate
0.5%
Rent to Value Ratio
Active
$894,400
5
bds
|
4
ba
|
3,754
sqft
|
built
2005
2784 E Honeysuckle Pl, Chandler, AZ 85286
$-2,640
Cash flow
-15.4%
Cash-on-Cash Return
2.7%
Cap rate
0.4%
Rent to Value Ratio
Active
$570,000
3
bds
|
3
ba
|
2,414
sqft
|
built
2009
121 W Hackberry Dr, Chandler, AZ 85248
$-1,326
Cash flow
-12.1%
Cash-on-Cash Return
3.5%
Cap rate
0.5%
Rent to Value Ratio
Active
$438,000
3
bds
|
3
ba
|
1,982
sqft
|
built
2004
546 E San Carlos Way, Chandler, AZ 85249
$-832
Cash flow
-9.9%
Cash-on-Cash Return
4.0%
Cap rate
0.6%
Rent to Value Ratio
Active
$320,000
2
bds
|
2
ba
|
982
sqft
|
built
1985
1976 N Lemon Tree Ln, Chandler, AZ 85224
$-710
Cash flow
-11.6%
Cash-on-Cash Return
3.6%
Cap rate
0.6%
Rent to Value Ratio

Active
$585,000
3
bds
|
3
ba
|
2,285
sqft
|
built
2018
3855 S Mc Queen Rd, Chandler, AZ 85286
$-1,451
Cash flow
-12.9%
Cash-on-Cash Return
3.3%
Cap rate
0.5%
Rent to Value Ratio
Active
$525,000
4
bds
|
3
ba
|
2,467
sqft
|
built
2010
4061 E Torrey Pines Ln, Chandler, AZ 85249
$-1,288
Cash flow
-12.8%
Cash-on-Cash Return
3.3%
Cap rate
0.5%
Rent to Value Ratio
Active
$835,000
5
bds
|
3
ba
|
3,229
sqft
|
built
1989
3761 W Kent Dr, Chandler, AZ 85226
$-2,291
Cash flow
-14.3%
Cash-on-Cash Return
3.0%
Cap rate
0.4%
Rent to Value Ratio
Active
$629,900
4
bds
|
3
ba
|
3,008
sqft
|
built
2002
3900 S Velero St, Chandler, AZ 85286
$-1,464
Cash flow
-12.1%
Cash-on-Cash Return
3.5%
Cap rate
0.5%
Rent to Value Ratio
Active
$297,500
2
bds
|
2
ba
|
1,128
sqft
|
built
2006
3330 S Gilbert Rd, Chandler, AZ 85286
$-557
Cash flow
-9.8%
Cash-on-Cash Return
4.0%
Cap rate
0.7%
Rent to Value Ratio