Chiefland, FL Investment Properties for Sale
Browse homes for sale and investment properties in Chiefland, FL. Refine your search by price, property type, or more.
Best cash flowing properties in Chiefland, FL
Active
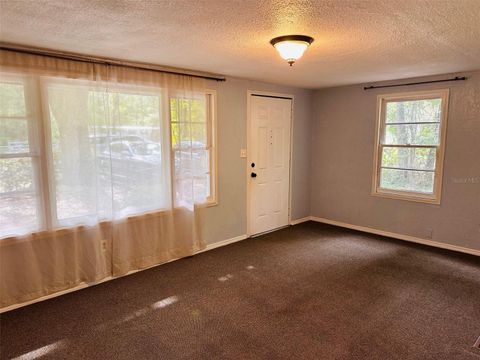
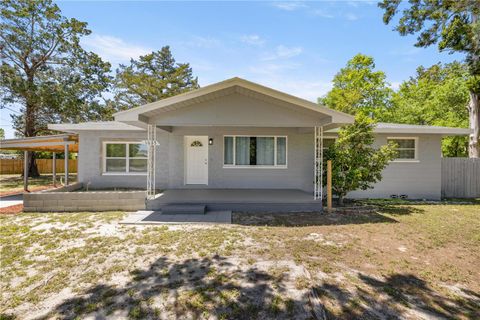
$145,000
3
bds
|
1
ba
|
1,092
sqft
|
built
1963
11933 NW 80th Ct, Chiefland, FL 32626
$125
Cash flow
4.5%
Cash-on-Cash Return
7.2%
Cap rate
1.0%
Rent to Value Ratio
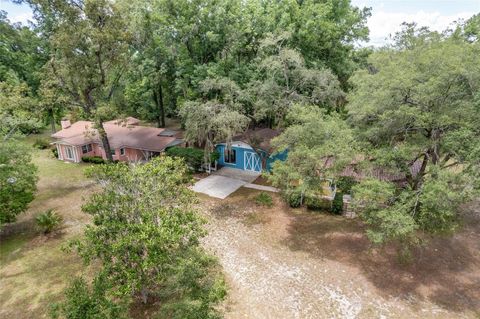
Active
$397,500
5
bds
|
3
ba
|
2,427
sqft
|
built
1972
10490 NW 101st St, Chiefland, FL 32626
$0
Cash flow
n/a
Cash-on-Cash Return
n/a
Cap rate
n/a
Rent to Value Ratio
8 out of 16 properties for sale in Chiefland, FL
Limited Results Shown
Create a free account, or log in to reveal all property listings and enjoy the complete experience.

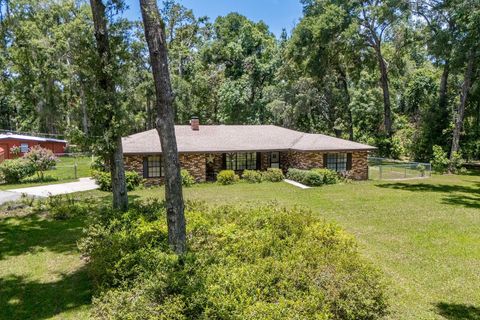
Active
$229,900
3
bds
|
1
ba
|
1,344
sqft
|
built
1972
11731 NW 78th Ter, Chiefland, FL 32626
$-136
Cash flow
-3.1%
Cash-on-Cash Return
5.4%
Cap rate
0.7%
Rent to Value Ratio

Active
$495,000
4
bds
|
2
ba
|
2,028
sqft
|
built
2012
15251 NW 71st Ter, Chiefland, FL 32626
$-1,229
Cash flow
-13.0%
Cash-on-Cash Return
3.2%
Cap rate
0.5%
Rent to Value Ratio
Active
$429,000
3
bds
|
2
ba
|
1,617
sqft
|
built
1977
8991 NW 115th St, Chiefland, FL 32626
$-925
Cash flow
-11.2%
Cash-on-Cash Return
3.6%
Cap rate
0.5%
Rent to Value Ratio
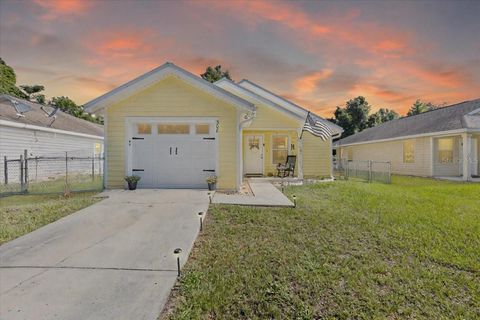
Active
$217,000
3
bds
|
2
ba
|
1,163
sqft
|
built
2008
308 SW 2nd Ave, Chiefland, FL 32626
$-109
Cash flow
-2.6%
Cash-on-Cash Return
5.5%
Cap rate
0.8%
Rent to Value Ratio
Active
$225,000
3
bds
|
1
ba
|
1,300
sqft
|
built
1960
1025 NE 4th St, Chiefland, FL 32626
$-436
Cash flow
-10.1%
Cash-on-Cash Return
3.8%
Cap rate
0.6%
Rent to Value Ratio
Active
$870,000
3
bds
|
3
ba
|
1,928
sqft
|
built
2022
5300 NW 52nd Ct, Chiefland, FL 32626
$-3,132
Cash flow
-18.8%
Cash-on-Cash Return
1.8%
Cap rate
0.3%
Rent to Value Ratio