Boulder County Investment Properties for Sale
Browse homes for sale and investment properties in Boulder County. Refine your search by price, property type, or more.
Best cash flowing properties in Boulder County
Active
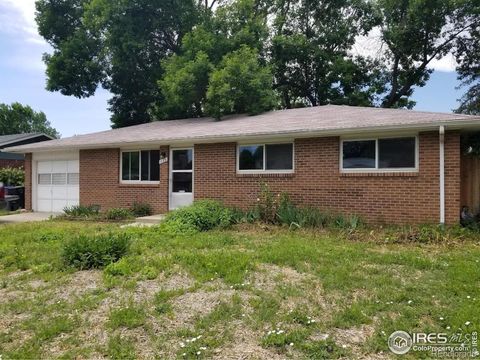
$410,000
3
bds
|
1
ba
|
1,000
sqft
|
built
1973
829 Hubbard Dr, Longmont, CO 80504
$-566
Cash flow
-7.2%
Cash-on-Cash Return
4.0%
Cap rate
0.5%
Rent to Value Ratio
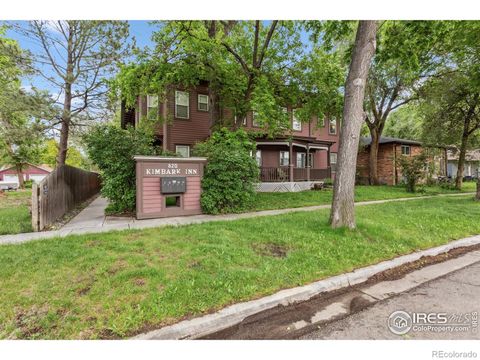
Active
$369,000
2
bds
|
2
ba
|
1,282
sqft
|
built
1999
820 Kimbark St, Longmont, CO 80501
$-610
Cash flow
-8.6%
Cash-on-Cash Return
3.7%
Cap rate
0.6%
Rent to Value Ratio
718 out of 802 properties for sale in Boulder County
Limited Results Shown
Create a free account, or log in to reveal all property listings and enjoy the complete experience.
Active
$4,500,000
5
bds
|
3
ba
|
3,654
sqft
|
built
1976
630 Northstar Ct, Boulder, CO 80304
$-19,484
Cash flow
-22.6%
Cash-on-Cash Return
0.5%
Cap rate
0.1%
Rent to Value Ratio
Active
$1,190,000
2
bds
|
2
ba
|
1,617
sqft
|
built
2002
1301 Canyon Blvd, Boulder, CO 80302
$-4,381
Cash flow
-19.2%
Cash-on-Cash Return
1.3%
Cap rate
0.4%
Rent to Value Ratio
Active
$575,000
3
bds
|
2
ba
|
956
sqft
|
built
2019
725 Amelia Ln, Lafayette, CO 80026
$-1,126
Cash flow
-10.2%
Cash-on-Cash Return
3.3%
Cap rate
0.5%
Rent to Value Ratio
Active
$13,000,000
4
bds
|
5
ba
|
6,300
sqft
|
built
2021
3621 21st St, Boulder, CO 80304
$-60,013
Cash flow
-24.1%
Cash-on-Cash Return
0.1%
Cap rate
0.1%
Rent to Value Ratio
Active
$4,300,000
4
bds
|
5
ba
|
5,338
sqft
|
built
2017
1525 Jennine Pl, Boulder, CO 80304
$-16,863
Cash flow
-20.5%
Cash-on-Cash Return
1.0%
Cap rate
0.2%
Rent to Value Ratio
Active
$995,000
3
bds
|
3
ba
|
2,854
sqft
|
built
2002
139 Ponderosa Dr, Nederland, CO 80466
$-2,246
Cash flow
-11.8%
Cash-on-Cash Return
3.0%
Cap rate
0.4%
Rent to Value Ratio
Active
$7,995,000
5
bds
|
7
ba
|
7,160
sqft
|
built
2004
166 Valley View Way, Boulder, CO 80304
$-32,715
Cash flow
-21.3%
Cash-on-Cash Return
0.8%
Cap rate
0.1%
Rent to Value Ratio
Active
$1,649,000
5
bds
|
3
ba
|
1,926
sqft
|
built
1935
911 Lincoln Pl, Boulder, CO 80302
$-5,358
Cash flow
-17.0%
Cash-on-Cash Return
1.8%
Cap rate
0.3%
Rent to Value Ratio
Active
$975,000
2
bds
|
2
ba
|
953
sqft
|
built
2014
1707 Walnut St, Boulder, CO 80302
$-3,056
Cash flow
-16.4%
Cash-on-Cash Return
1.9%
Cap rate
0.3%
Rent to Value Ratio
Active
$1,570,000
3
bds
|
4
ba
|
2,588
sqft
|
built
2007
2826 Broadway St, Boulder, CO 80304
$-3,867
Cash flow
-12.9%
Cash-on-Cash Return
2.7%
Cap rate
0.5%
Rent to Value Ratio
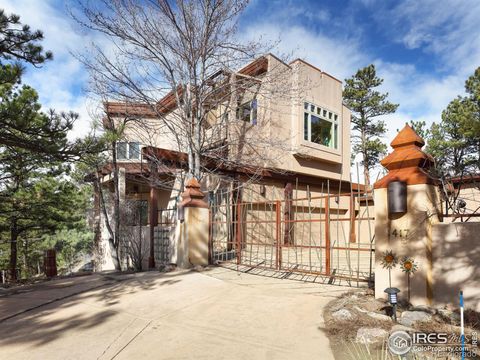
Active
$2,495,000
3
bds
|
4
ba
|
5,530
sqft
|
built
1994
1417 Rembrandt Rd, Boulder, CO 80302
$-7,620
Cash flow
-15.9%
Cash-on-Cash Return
2.0%
Cap rate
0.3%
Rent to Value Ratio
Active
$2,200,000
3
bds
|
1
ba
|
1,080
sqft
|
built
1959
913 Utica Ave, Boulder, CO 80304
$-8,547
Cash flow
-20.3%
Cash-on-Cash Return
1.0%
Cap rate
0.2%
Rent to Value Ratio
Active
$3,180,000
5
bds
|
4
ba
|
5,053
sqft
|
built
1917
851 14th St, Boulder, CO 80302
$-11,392
Cash flow
-18.7%
Cash-on-Cash Return
1.4%
Cap rate
0.2%
Rent to Value Ratio
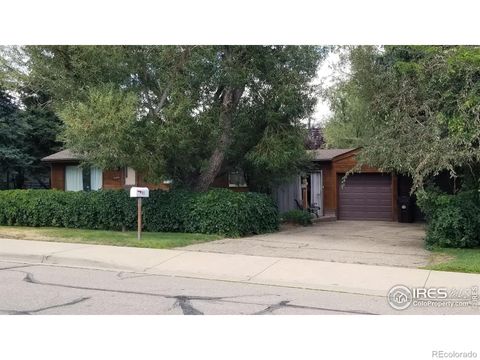
Active
$998,500
3
bds
|
2
ba
|
1,976
sqft
|
built
1973
100 Wildcat Ln, Boulder, CO 80304
$-2,050
Cash flow
-10.7%
Cash-on-Cash Return
3.2%
Cap rate
0.5%
Rent to Value Ratio
Active
$2,995,000
4
bds
|
5
ba
|
4,093
sqft
|
built
1984
3945 Promontory Ct, Boulder, CO 80304
$-10,988
Cash flow
-19.1%
Cash-on-Cash Return
1.3%
Cap rate
0.2%
Rent to Value Ratio
Active
$1,250,000
3
bds
|
2
ba
|
2,019
sqft
|
built
1995
3001 Eagle Ridge Rd, Longmont, CO 80503
$-2,590
Cash flow
-10.8%
Cash-on-Cash Return
3.2%
Cap rate
0.5%
Rent to Value Ratio
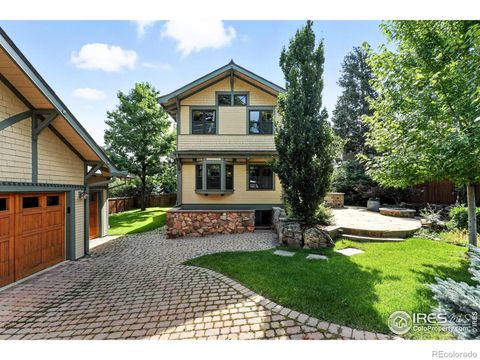
Active
$1,185,000
3
bds
|
4
ba
|
2,911
sqft
|
built
2006
237 Puma Dr, Boulder, CO 80302
$-3,629
Cash flow
-16.0%
Cash-on-Cash Return
2.0%
Cap rate
0.3%
Rent to Value Ratio
Active
$605,000
3
bds
|
2
ba
|
1,554
sqft
|
built
1978
2725 Juniper Ave, Boulder, CO 80304
$-1,600
Cash flow
-13.8%
Cash-on-Cash Return
2.5%
Cap rate
0.5%
Rent to Value Ratio
Active
$375,000
1
bds
|
2
ba
|
800
sqft
|
built
1987
7434 Singing Hills Dr, Boulder, CO 80301
$-679
Cash flow
-9.4%
Cash-on-Cash Return
3.5%
Cap rate
0.6%
Rent to Value Ratio
Active
$1,750,000
2
bds
|
1
ba
|
1,403
sqft
|
built
1885
1312 Steamboat Valley Rd, Lyons, CO 80540
$-6,616
Cash flow
-19.7%
Cash-on-Cash Return
1.1%
Cap rate
0.2%
Rent to Value Ratio
Active
$5,995,000
5
bds
|
6
ba
|
4,032
sqft
|
built
2020
2670 6th St, Boulder, CO 80304
$-23,238
Cash flow
-20.2%
Cash-on-Cash Return
1.0%
Cap rate
0.2%
Rent to Value Ratio
Active
$415,000
2
bds
|
1
ba
|
747
sqft
|
built
1982
4763 White Rock Cir, Boulder, CO 80301
$-1,194
Cash flow
-15.0%
Cash-on-Cash Return
2.2%
Cap rate
0.5%
Rent to Value Ratio
Active
$1,100,000
4
bds
|
4
ba
|
3,696
sqft
|
built
2008
3766 Ridgeway St, Boulder, CO 80301
$-2,501
Cash flow
-11.9%
Cash-on-Cash Return
3.0%
Cap rate
0.4%
Rent to Value Ratio
Active
$629,500
2
bds
|
3
ba
|
1,250
sqft
|
built
2002
1065 Laramie Blvd, Boulder, CO 80304
$-1,213
Cash flow
-10.1%
Cash-on-Cash Return
3.4%
Cap rate
0.5%
Rent to Value Ratio
Active
$2,950,000
4
bds
|
4
ba
|
4,448
sqft
|
built
1998
910 Kalmia Ave, Boulder, CO 80304
$-11,767
Cash flow
-20.8%
Cash-on-Cash Return
0.9%
Cap rate
0.2%
Rent to Value Ratio
Active
$999,000
5
bds
|
4
ba
|
3,209
sqft
|
built
2018
1195 Fox Hills Ct, Erie, CO 80516
$-2,387
Cash flow
-12.5%
Cash-on-Cash Return
2.8%
Cap rate
0.4%
Rent to Value Ratio
Active
$699,000
3
bds
|
3
ba
|
2,127
sqft
|
built
1999
301 Widgeon Dr, Longmont, CO 80503
$-1,591
Cash flow
-11.9%
Cash-on-Cash Return
2.9%
Cap rate
0.4%
Rent to Value Ratio
Active
$2,750,000
3
bds
|
4
ba
|
4,138
sqft
|
built
2001
95 Rowell Dr, Lyons, CO 80540
$-9,779
Cash flow
-18.6%
Cash-on-Cash Return
1.4%
Cap rate
0.2%
Rent to Value Ratio
Active
$725,000
5
bds
|
3
ba
|
2,164
sqft
|
built
1910
736 Kimbark St, Longmont, CO 80501
$-1,401
Cash flow
-10.1%
Cash-on-Cash Return
3.4%
Cap rate
0.5%
Rent to Value Ratio
Active
$999,000
3
bds
|
3
ba
|
2,050
sqft
|
built
1963
15 Pawnee Dr, Boulder, CO 80303
$-2,121
Cash flow
-11.1%
Cash-on-Cash Return
3.1%
Cap rate
0.5%
Rent to Value Ratio
Active
$2,500,000
5
bds
|
6
ba
|
6,112
sqft
|
built
1993
2835 Links Dr, Boulder, CO 80301
$-6,716
Cash flow
-14.0%
Cash-on-Cash Return
2.5%
Cap rate
0.4%
Rent to Value Ratio

Active
$740,000
3
bds
|
2
ba
|
1,636
sqft
|
built
1983
38 Navajo Trl, Nederland, CO 80466
$-1,482
Cash flow
-10.4%
Cash-on-Cash Return
3.3%
Cap rate
0.5%
Rent to Value Ratio
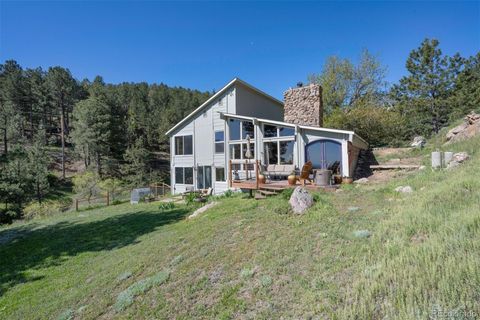
Active
$1,950,000
4
bds
|
4
ba
|
3,842
sqft
|
built
1984
6183 Red Hill Rd, Boulder, CO 80302
$-5,874
Cash flow
-15.7%
Cash-on-Cash Return
2.1%
Cap rate
0.3%
Rent to Value Ratio
Active
$3,400,000
4
bds
|
6
ba
|
4,850
sqft
|
built
1995
90 Hawk Ln, Boulder, CO 80304
$-11,113
Cash flow
-17.1%
Cash-on-Cash Return
1.8%
Cap rate
0.3%
Rent to Value Ratio
Active
$2,890,000
5
bds
|
6
ba
|
9,510
sqft
|
built
2006
1615 Stardance Cir, Longmont, CO 80504
$-8,534
Cash flow
-15.4%
Cash-on-Cash Return
2.1%
Cap rate
0.3%
Rent to Value Ratio
Active
$550,000
1
bds
|
1
ba
|
616
sqft
|
built
1972
474 Hummer Dr, Nederland, CO 80466
$-1,266
Cash flow
-12.0%
Cash-on-Cash Return
2.9%
Cap rate
0.4%
Rent to Value Ratio
Active
$2,450,000
3
bds
|
5
ba
|
3,064
sqft
|
built
1988
1521 Mapleton Ave, Boulder, CO 80304
$-7,863
Cash flow
-16.7%
Cash-on-Cash Return
1.8%
Cap rate
0.3%
Rent to Value Ratio
Active
$534,900
3
bds
|
3
ba
|
2,342
sqft
|
built
2018
883 Widgeon Cir, Longmont, CO 80503
$-912
Cash flow
-8.9%
Cash-on-Cash Return
3.6%
Cap rate
0.6%
Rent to Value Ratio