Boulder County Investment Properties for Sale
Browse homes for sale and investment properties in Boulder County. Refine your search by price, property type, or more.
Best cash flowing properties in Boulder County
Active
$354,900
2
bds
|
2
ba
|
961
sqft
|
built
1994
4840 Twin Lakes Rd, Boulder, CO 80301
$-960
Cash flow
-14.1%
Cash-on-Cash Return
3.0%
Cap rate
0.6%
Rent to Value Ratio
Active
$375,000
2
bds
|
1
ba
|
963
sqft
|
built
1968
3365 Chisholm Trl, Boulder, CO 80301
$-1,024
Cash flow
-14.2%
Cash-on-Cash Return
3.0%
Cap rate
0.6%
Rent to Value Ratio
1,200 out of 1,340 properties for sale in Boulder County
Limited Results Shown
Create a free account, or log in to reveal all property listings and enjoy the complete experience.
Active
$2,695,000
5
bds
|
5
ba
|
4,392
sqft
|
built
1988
2545 Tamarack Ave, Boulder, CO 80304
$-9,062
Cash flow
-17.5%
Cash-on-Cash Return
2.2%
Cap rate
0.3%
Rent to Value Ratio
Active
$1,795,000
5
bds
|
3
ba
|
1,926
sqft
|
built
1935
911 Lincoln Pl, Boulder, CO 80302
$-6,954
Cash flow
-20.2%
Cash-on-Cash Return
1.6%
Cap rate
0.3%
Rent to Value Ratio
Active
$3,650,000
5
bds
|
5
ba
|
5,957
sqft
|
built
2005
1652 Poplar Ave, Boulder, CO 80304
$-15,671
Cash flow
-22.4%
Cash-on-Cash Return
1.1%
Cap rate
0.2%
Rent to Value Ratio
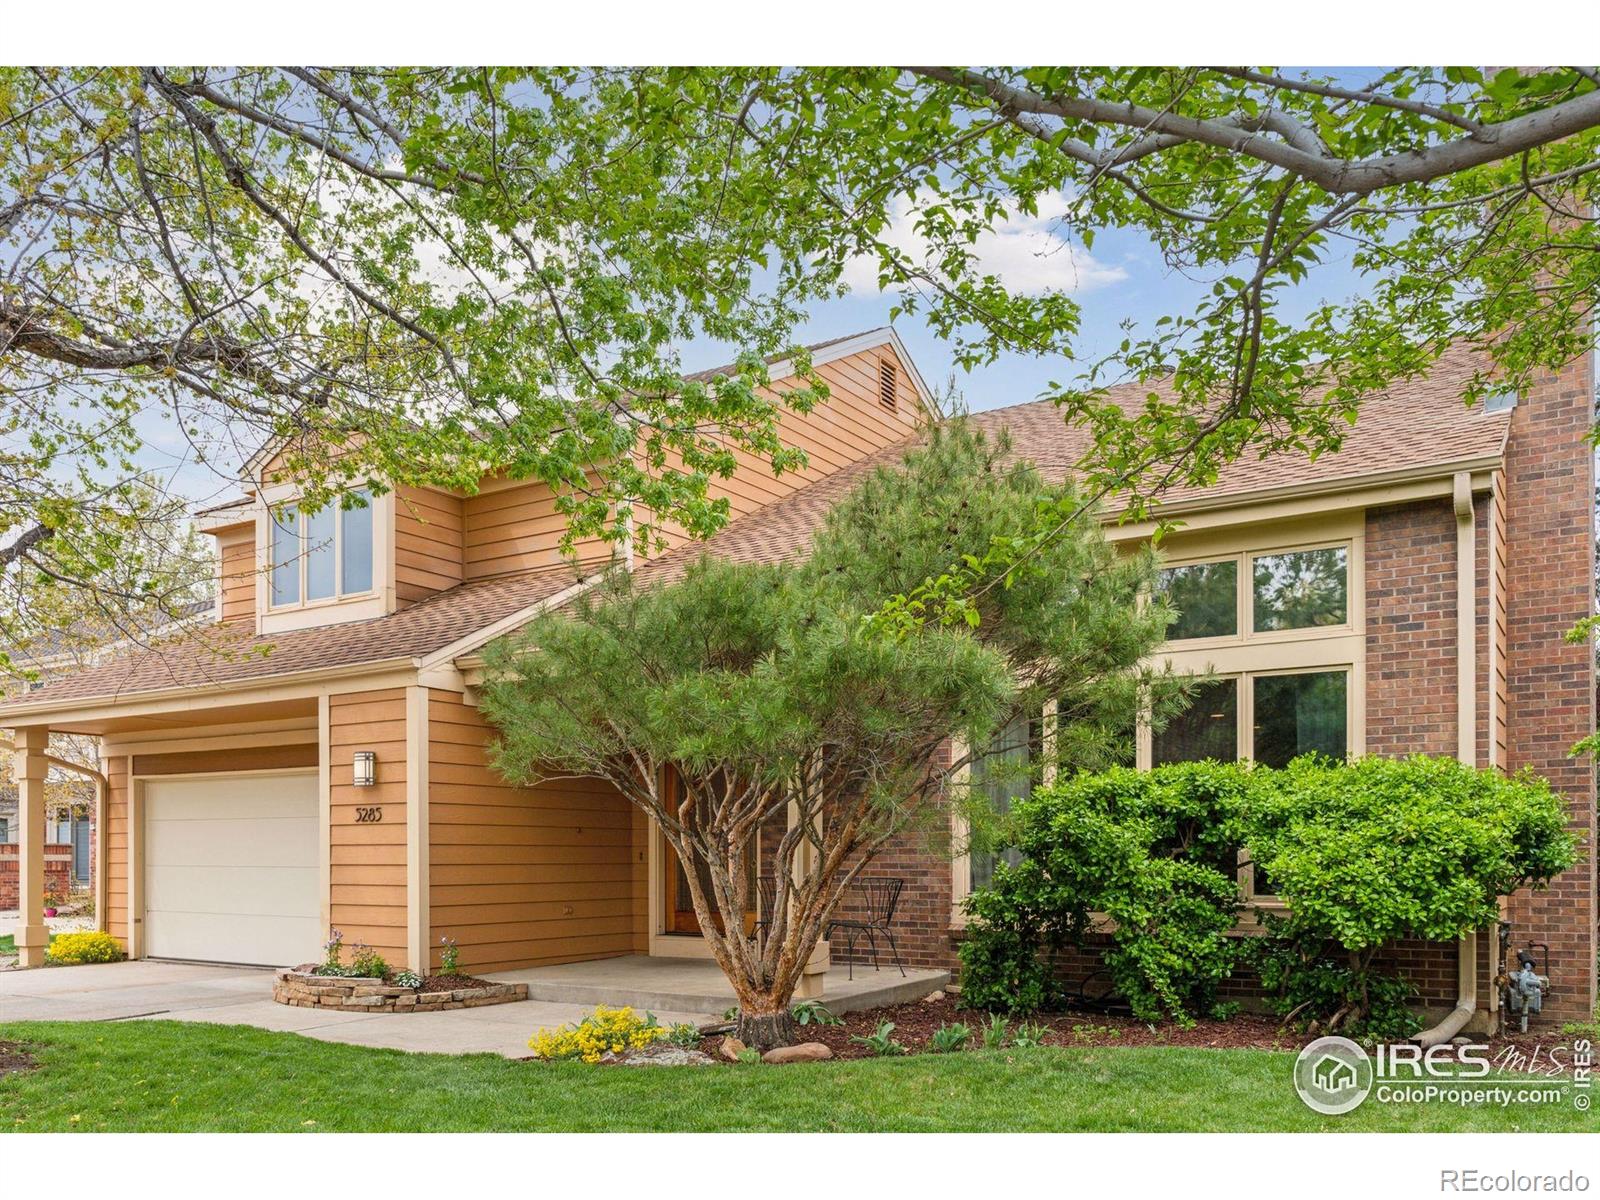
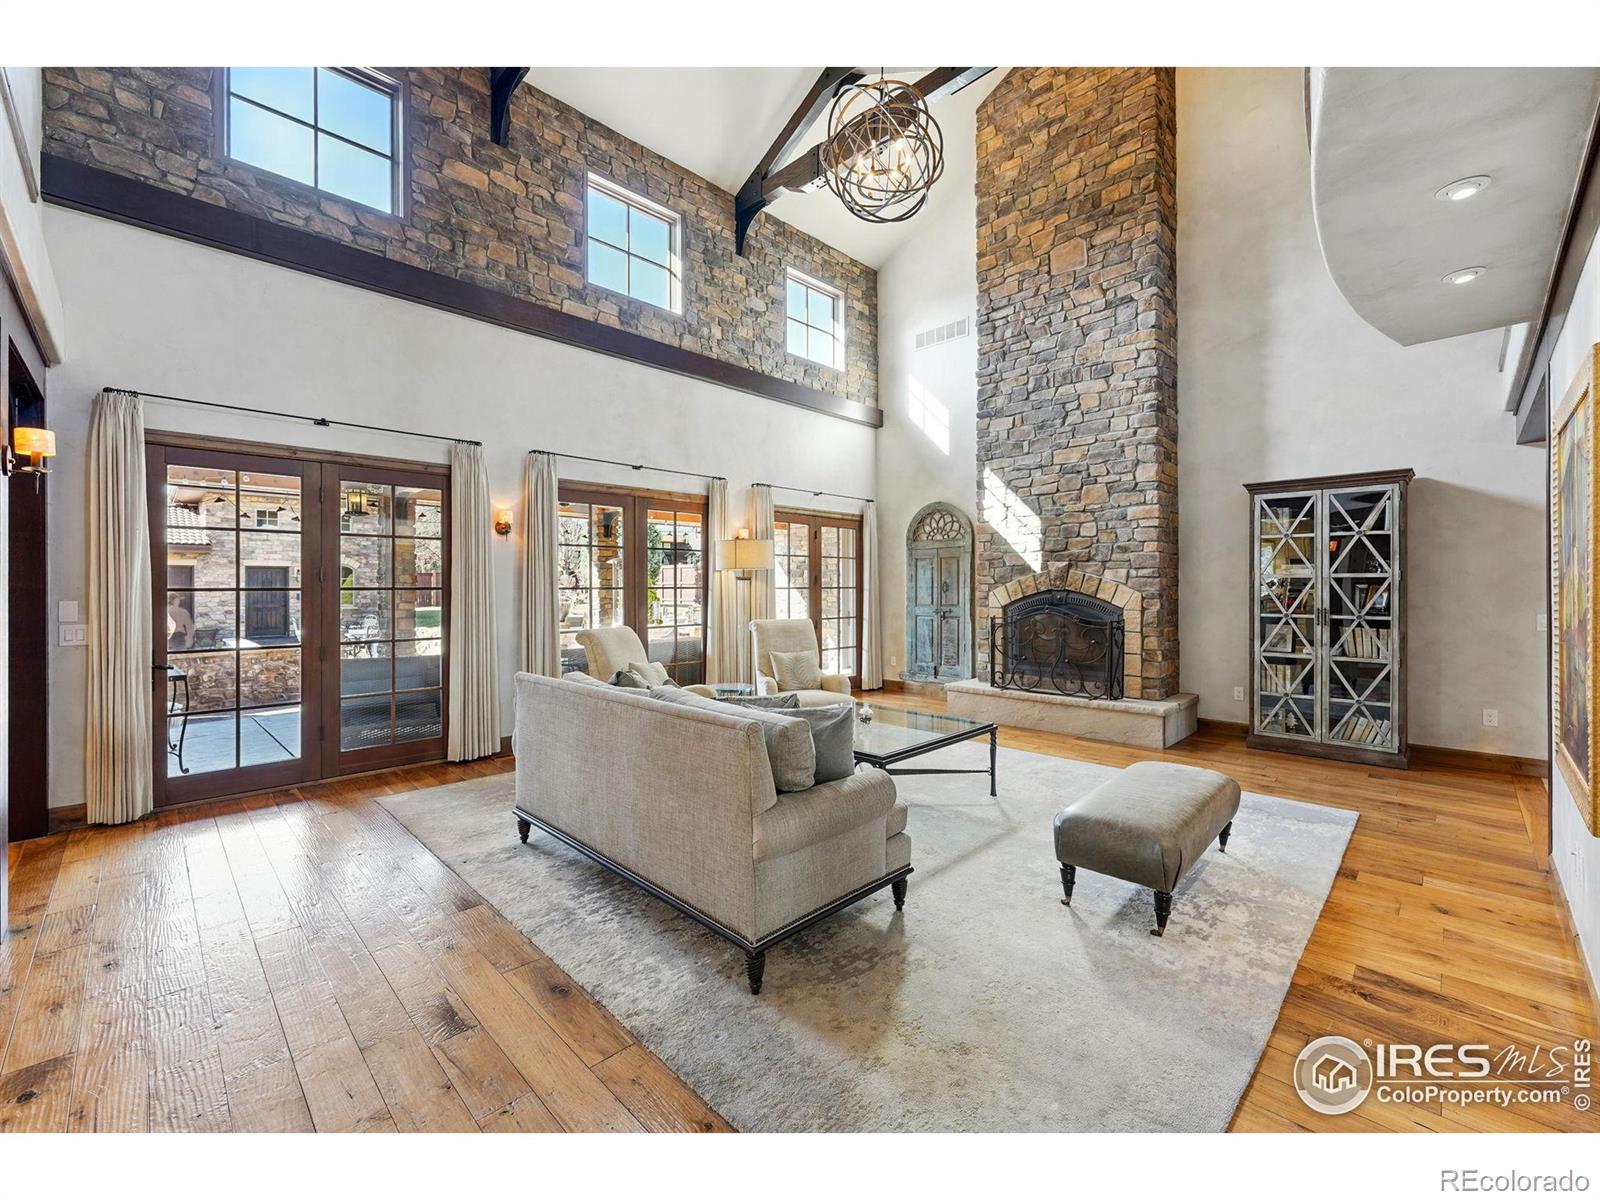
Active
$1,598,000
3
bds
|
3
ba
|
3,336
sqft
|
built
1981
5285 Gallatin Pl, Boulder, CO 80303
$-6,203
Cash flow
-20.3%
Cash-on-Cash Return
1.6%
Cap rate
0.2%
Rent to Value Ratio
Active
$2,690,000
5
bds
|
4
ba
|
3,448
sqft
|
built
1940
1516 Columbine Ave, Boulder, CO 80302
$-10,470
Cash flow
-20.3%
Cash-on-Cash Return
1.6%
Cap rate
0.3%
Rent to Value Ratio
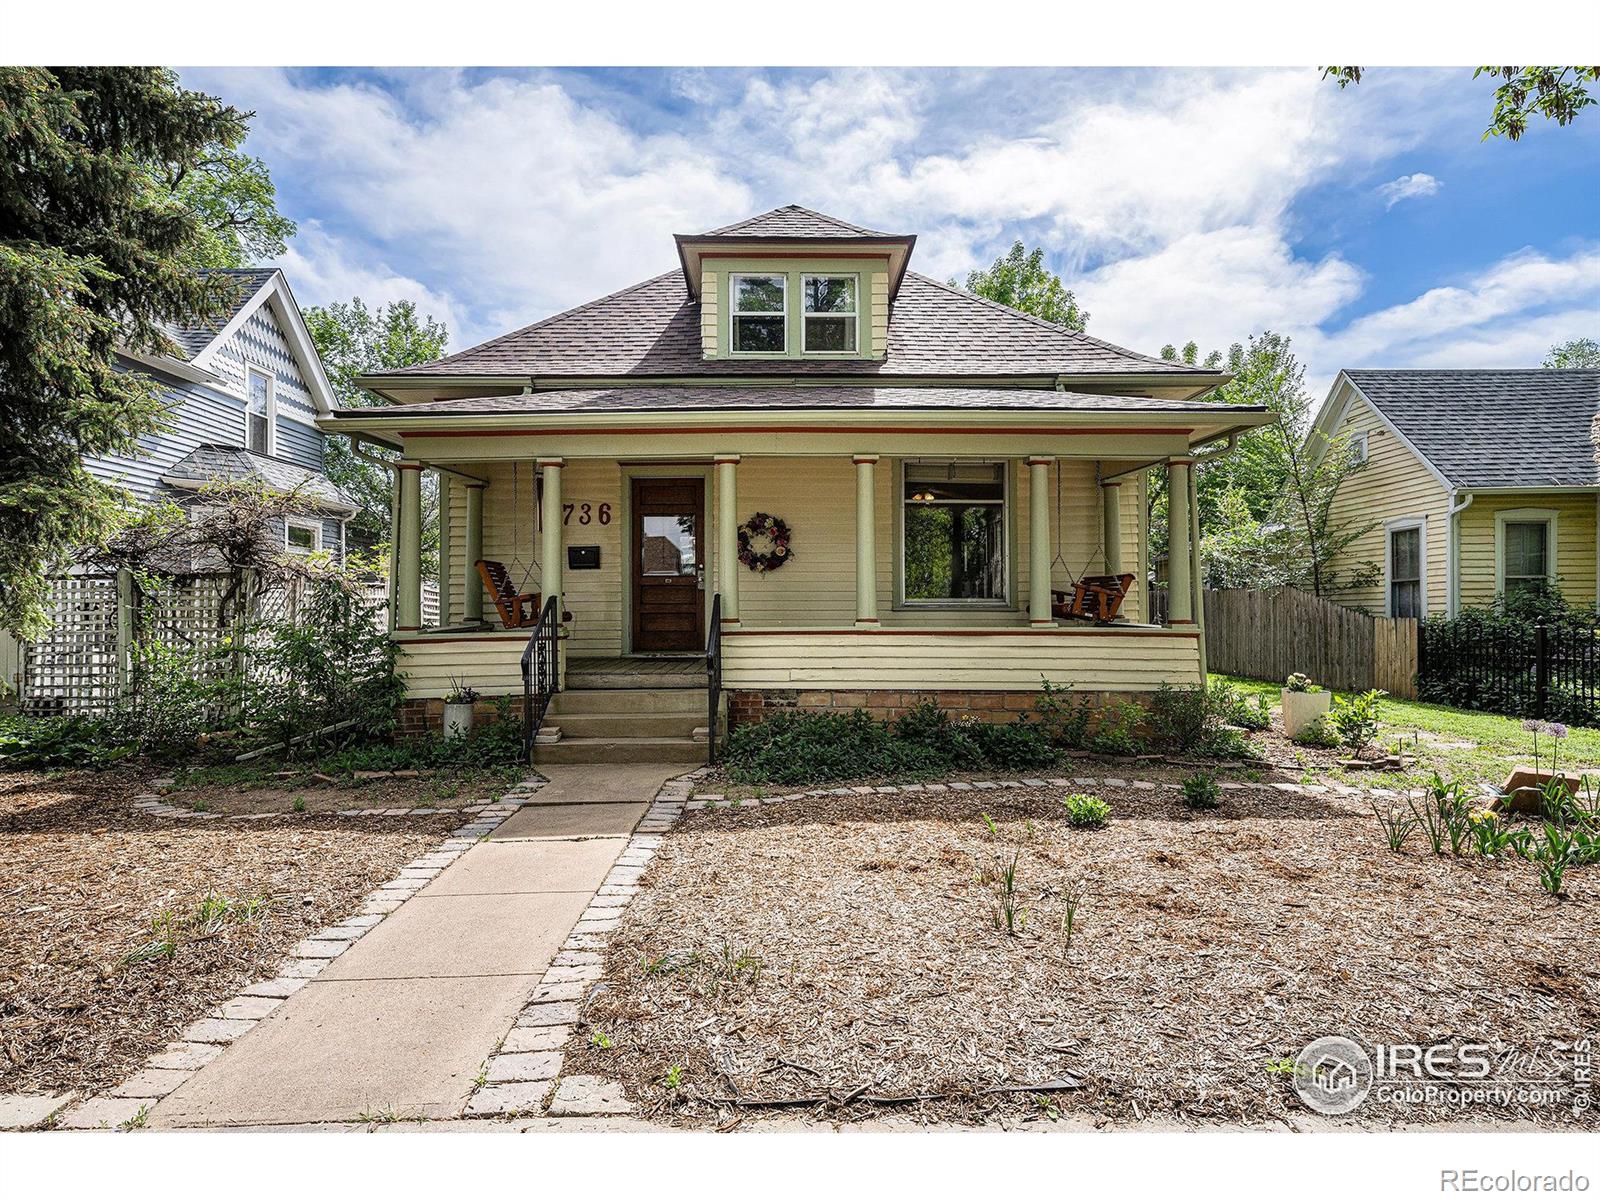
Active
$749,000
5
bds
|
3
ba
|
2,164
sqft
|
built
1910
736 Kimbark St, Longmont, CO 80501
$-1,892
Cash flow
-13.2%
Cash-on-Cash Return
3.3%
Cap rate
0.5%
Rent to Value Ratio
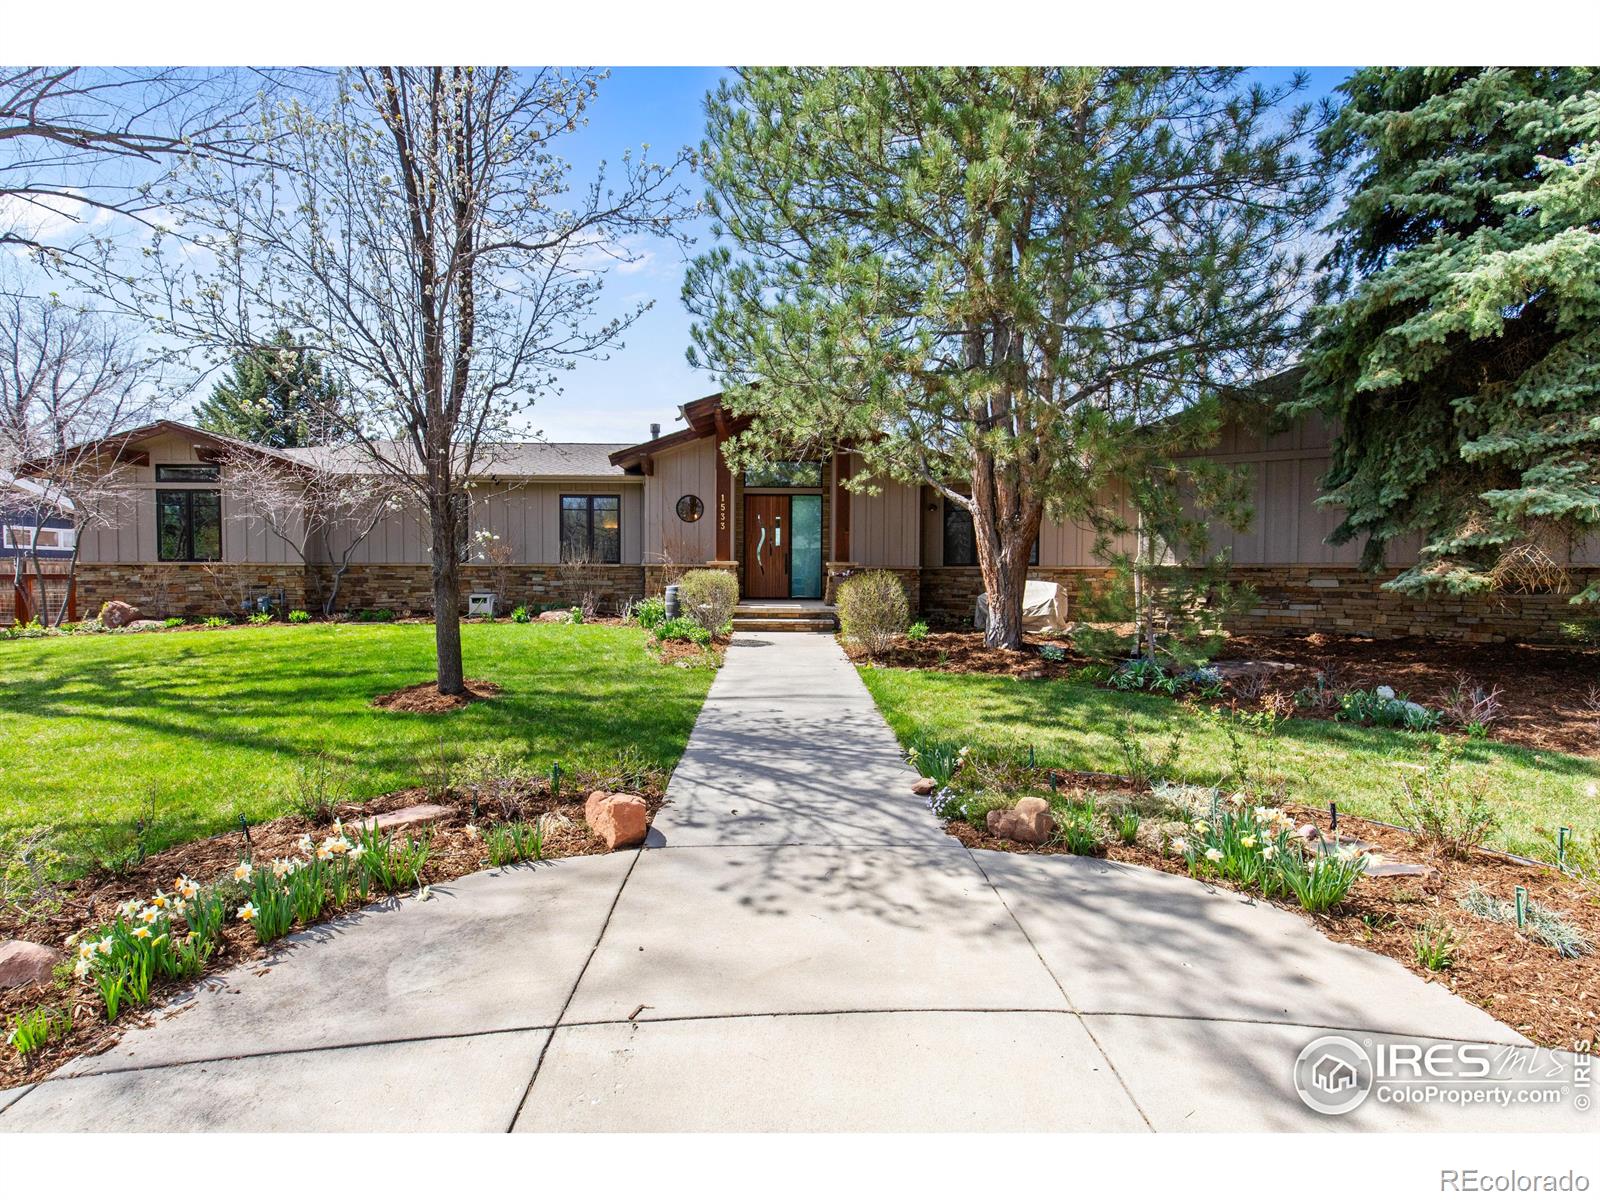
Active
$3,600,000
4
bds
|
4
ba
|
4,312
sqft
|
built
2008
1533 Old Tale Rd, Boulder, CO 80303
$-15,916
Cash flow
-23.1%
Cash-on-Cash Return
1.0%
Cap rate
0.2%
Rent to Value Ratio
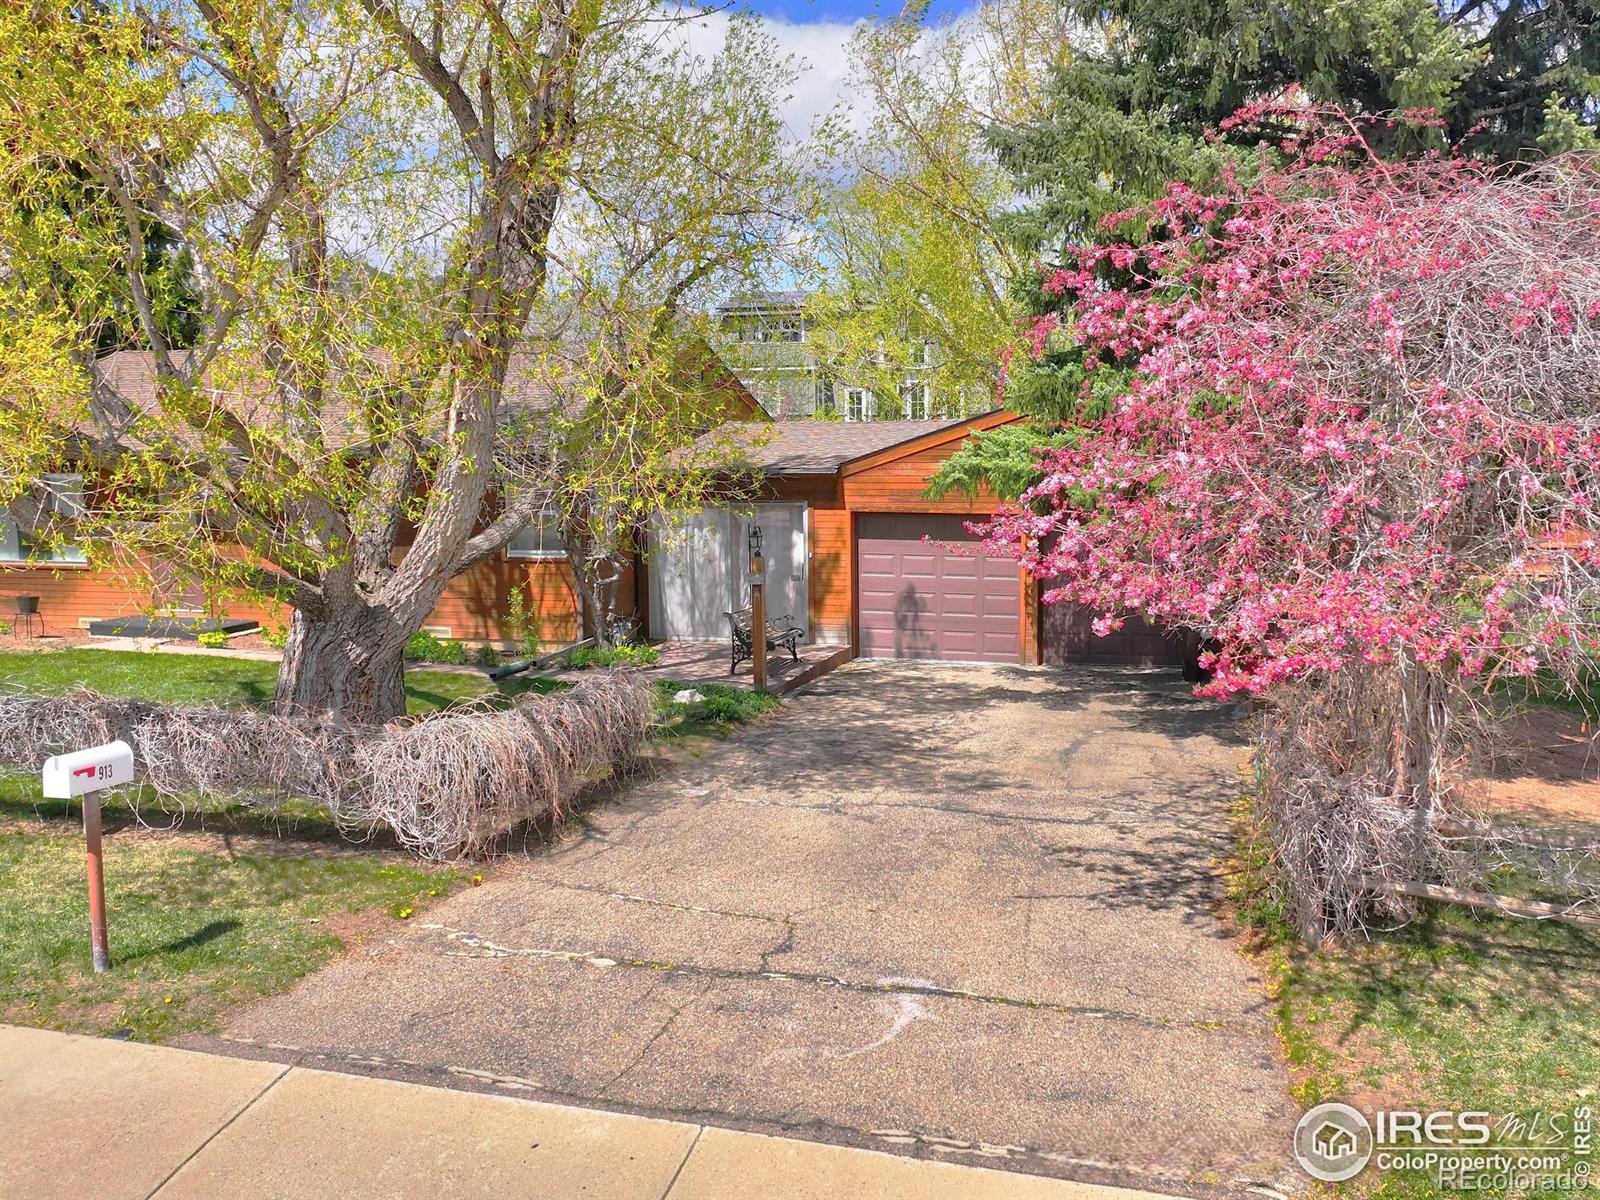
Active
$2,200,000
3
bds
|
1
ba
|
1,080
sqft
|
built
1959
913 Utica Ave, Boulder, CO 80304
$-9,657
Cash flow
-22.9%
Cash-on-Cash Return
1.0%
Cap rate
0.2%
Rent to Value Ratio
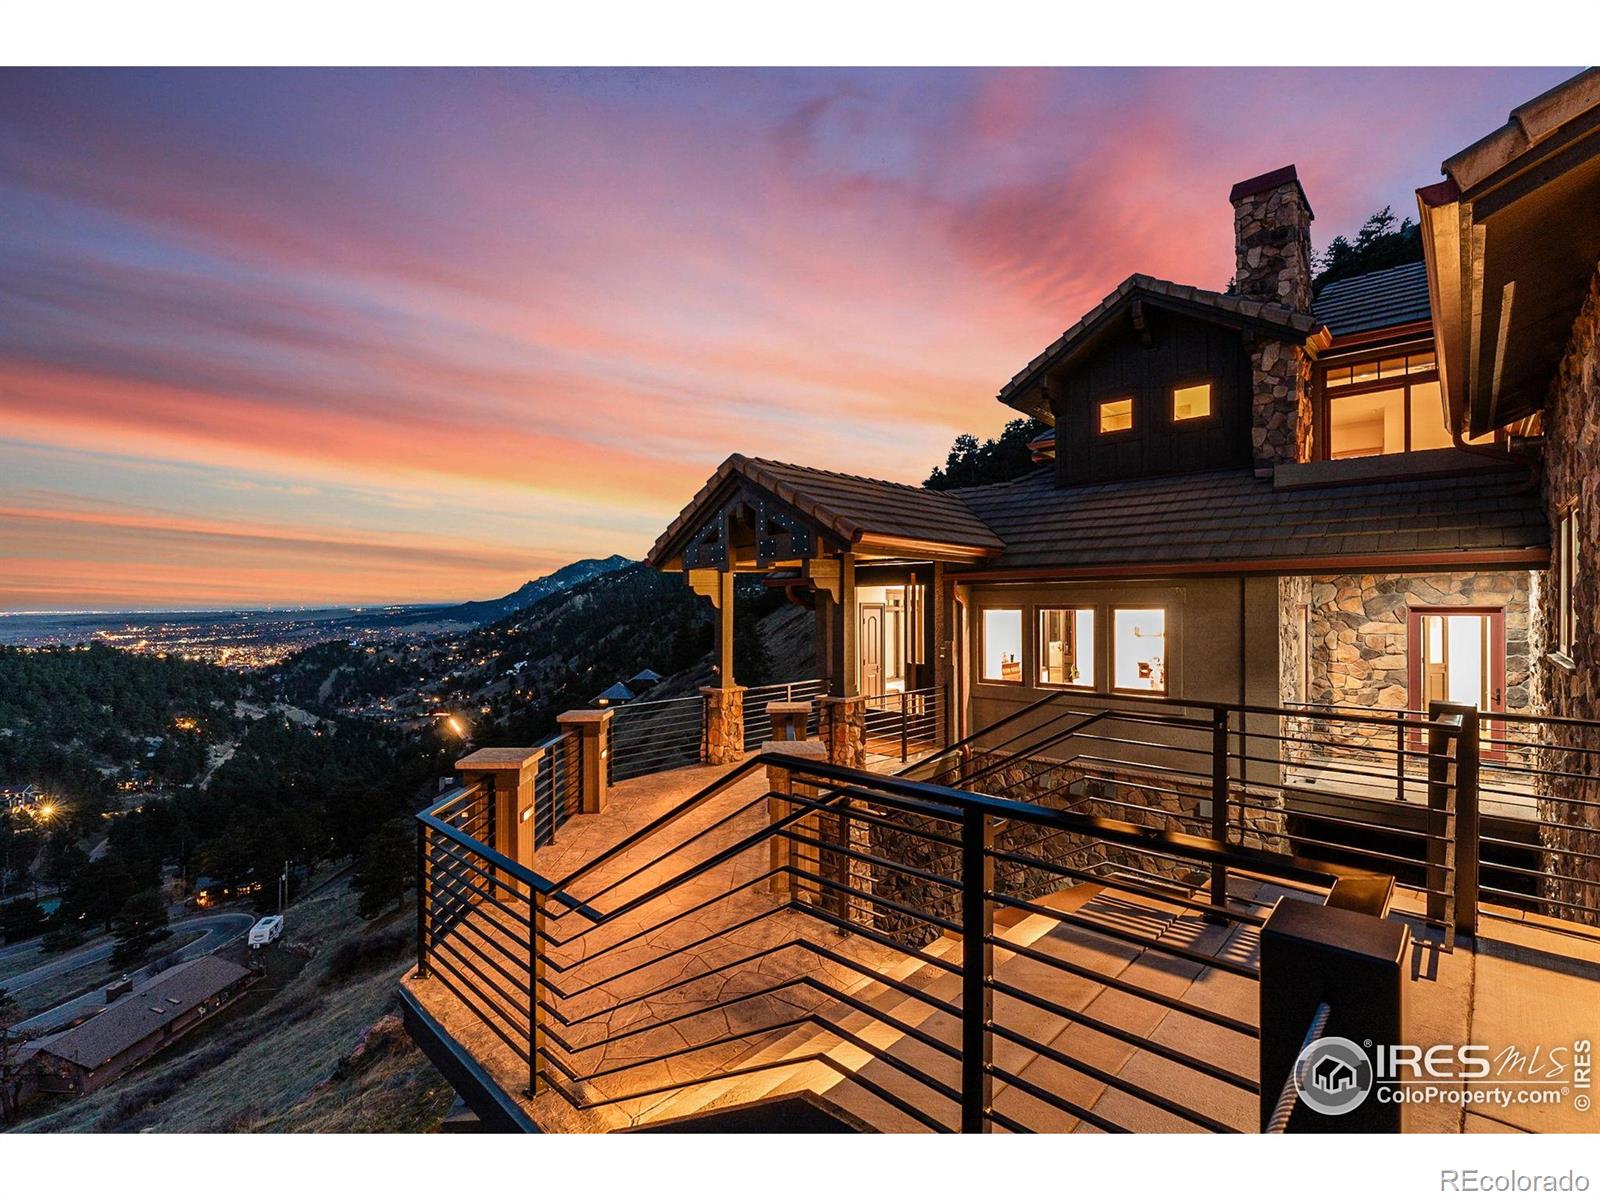
Active
$7,995,000
5
bds
|
7
ba
|
7,160
sqft
|
built
2004
166 Valley View Way, Boulder, CO 80304
$-36,748
Cash flow
-24.0%
Cash-on-Cash Return
0.8%
Cap rate
0.1%
Rent to Value Ratio
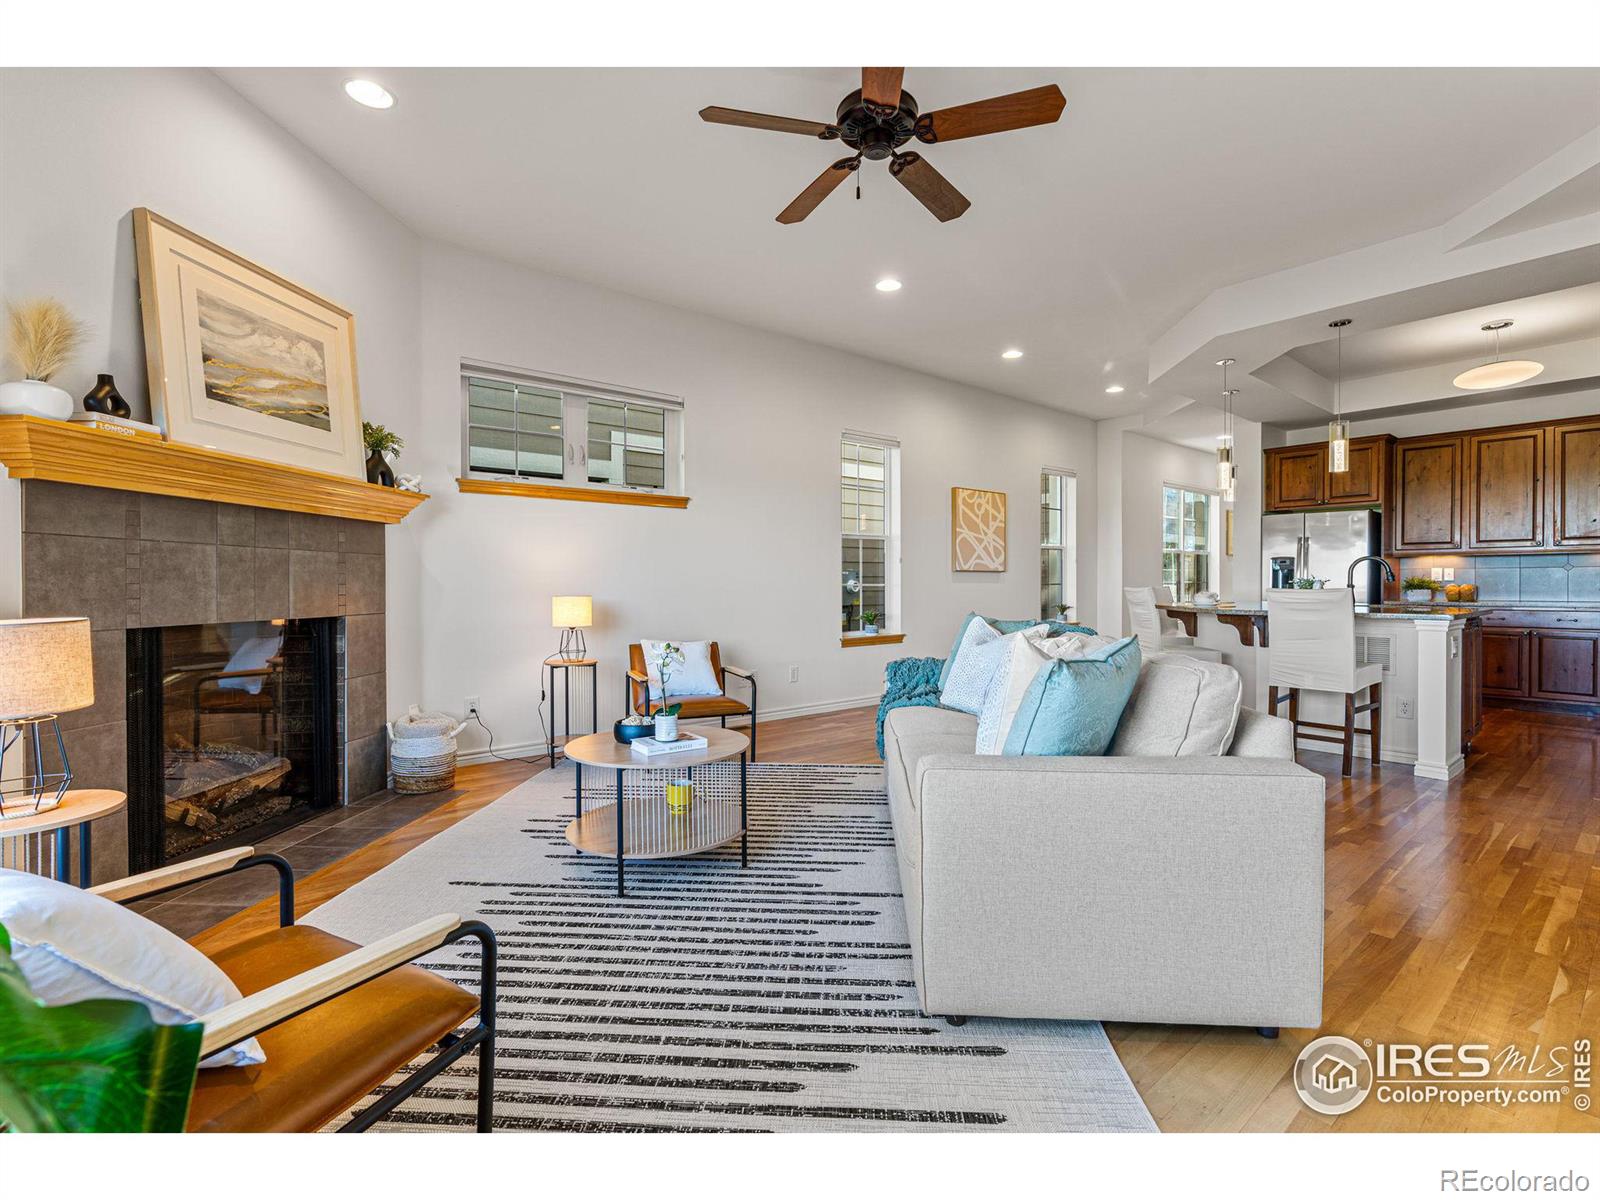
Active
$1,100,000
4
bds
|
4
ba
|
3,696
sqft
|
built
2008
3766 Ridgeway St, Boulder, CO 80301
$-3,055
Cash flow
-14.5%
Cash-on-Cash Return
3.0%
Cap rate
0.4%
Rent to Value Ratio
Active
$550,000
2
bds
|
2
ba
|
1,357
sqft
|
built
1971
1850 Folsom St, Boulder, CO 80302
$-2,178
Cash flow
-20.7%
Cash-on-Cash Return
1.5%
Cap rate
0.6%
Rent to Value Ratio
Active
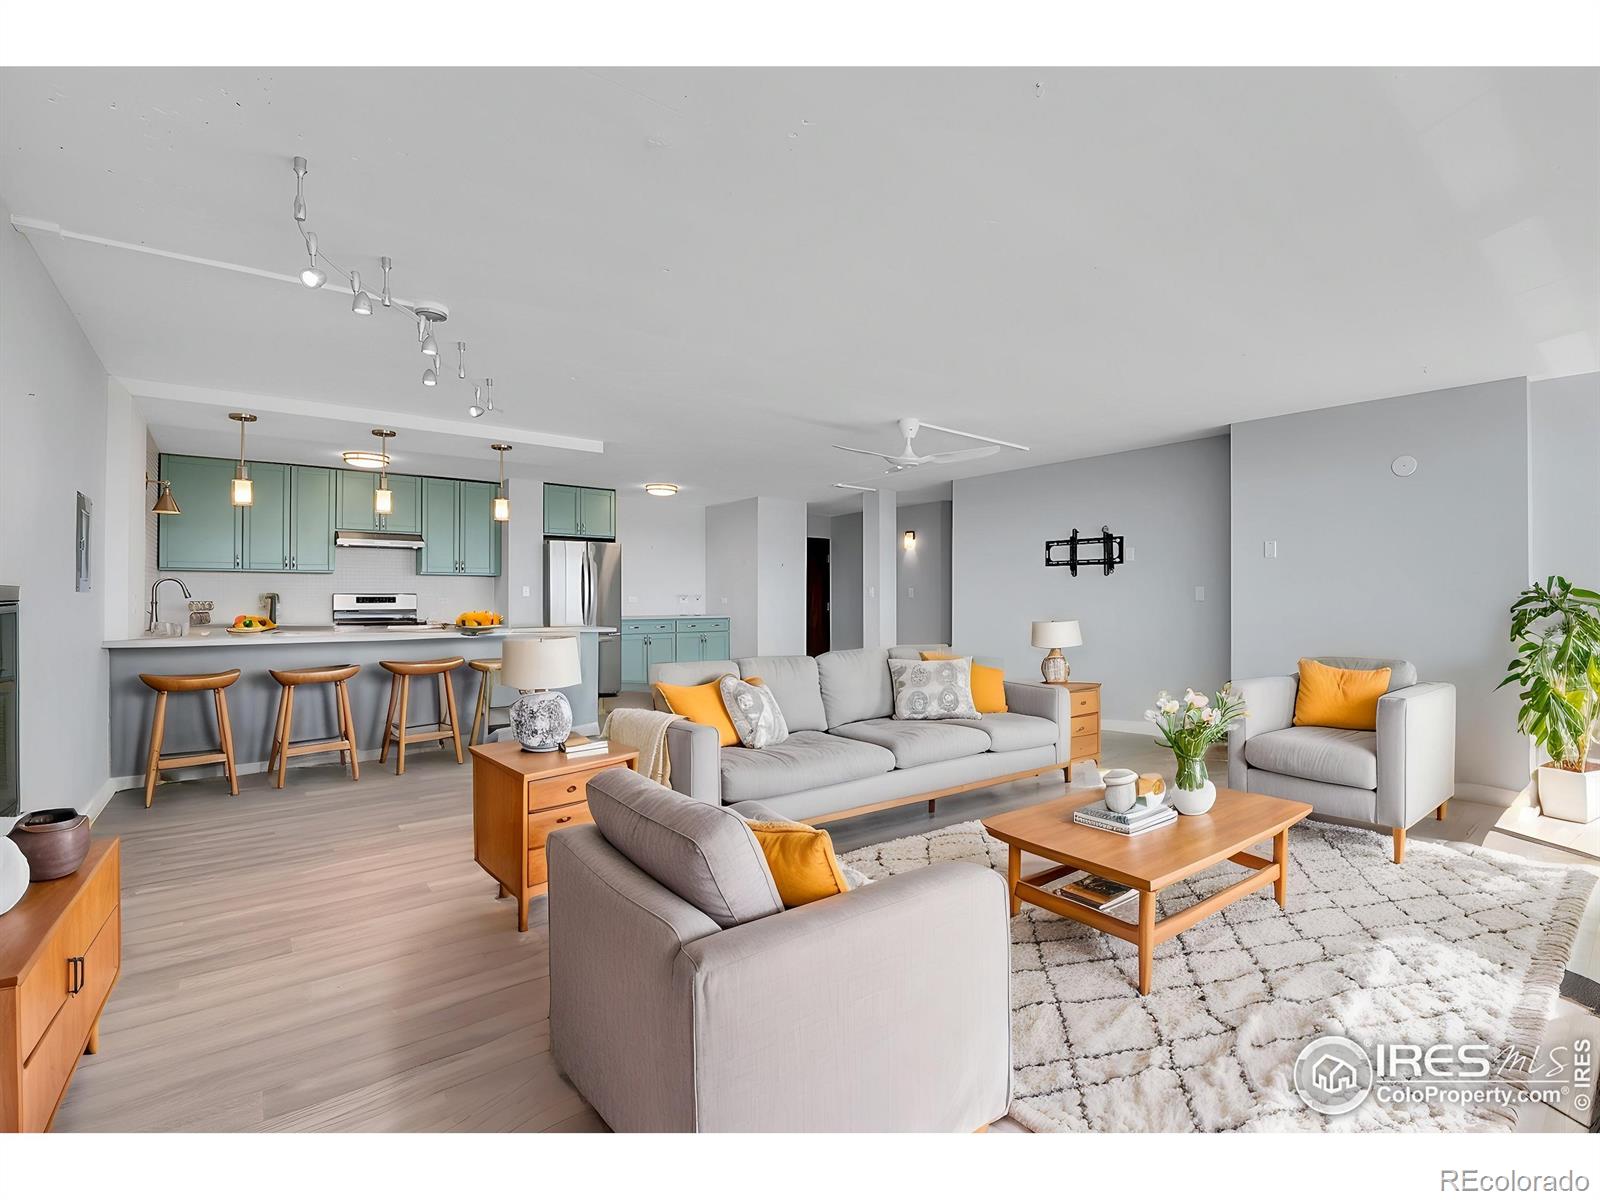
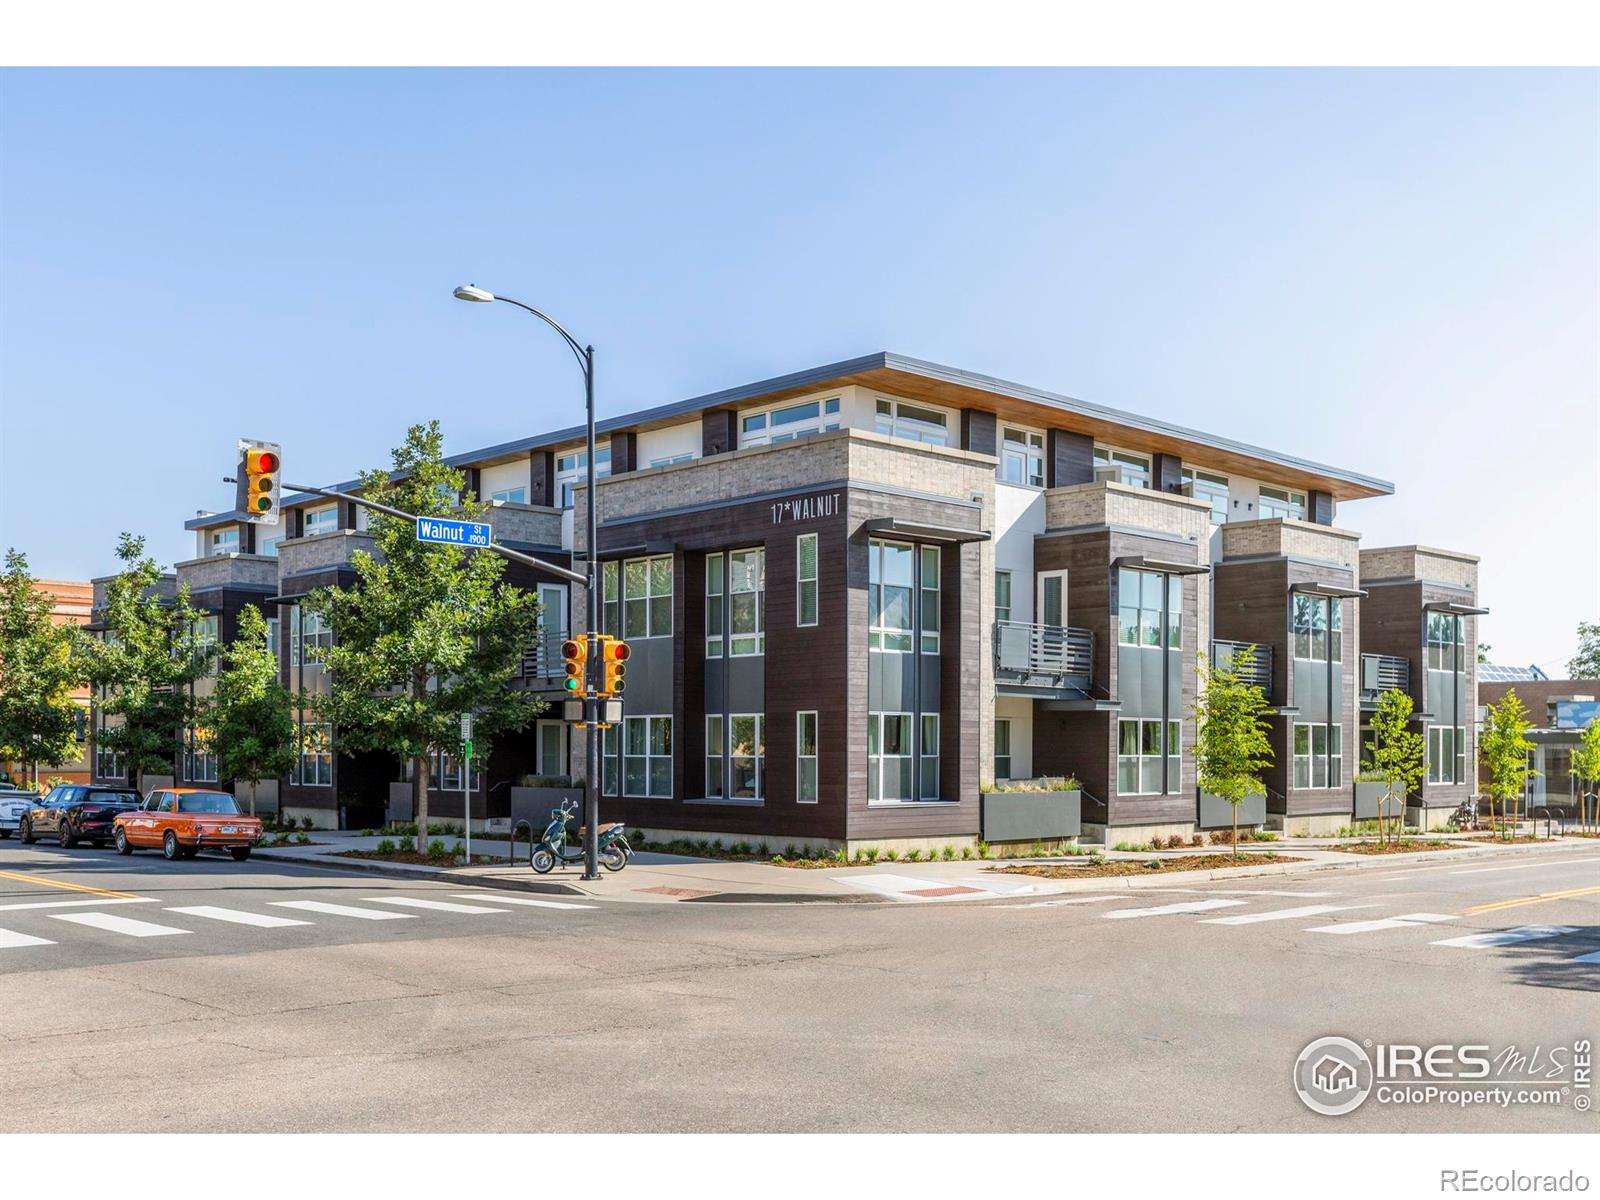
$1,095,000
2
bds
|
2
ba
|
1,230
sqft
|
built
2014
1707 Walnut St, Boulder, CO 80302
$-3,880
Cash flow
-18.5%
Cash-on-Cash Return
2.0%
Cap rate
0.4%
Rent to Value Ratio
Active
$354,900
2
bds
|
2
ba
|
961
sqft
|
built
1994
4840 Twin Lakes Rd, Boulder, CO 80301
$-960
Cash flow
-14.1%
Cash-on-Cash Return
3.0%
Cap rate
0.6%
Rent to Value Ratio
Active
$1,198,000
1
bds
|
2
ba
|
1,538
sqft
|
built
2005
1360 Walnut St, Boulder, CO 80302
$-4,867
Cash flow
-21.2%
Cash-on-Cash Return
1.4%
Cap rate
0.3%
Rent to Value Ratio
Active
$4,195,000
4
bds
|
4
ba
|
4,367
sqft
|
built
1927
3059 6th St, Boulder, CO 80304
$-18,805
Cash flow
-23.4%
Cash-on-Cash Return
0.9%
Cap rate
0.2%
Rent to Value Ratio
Active
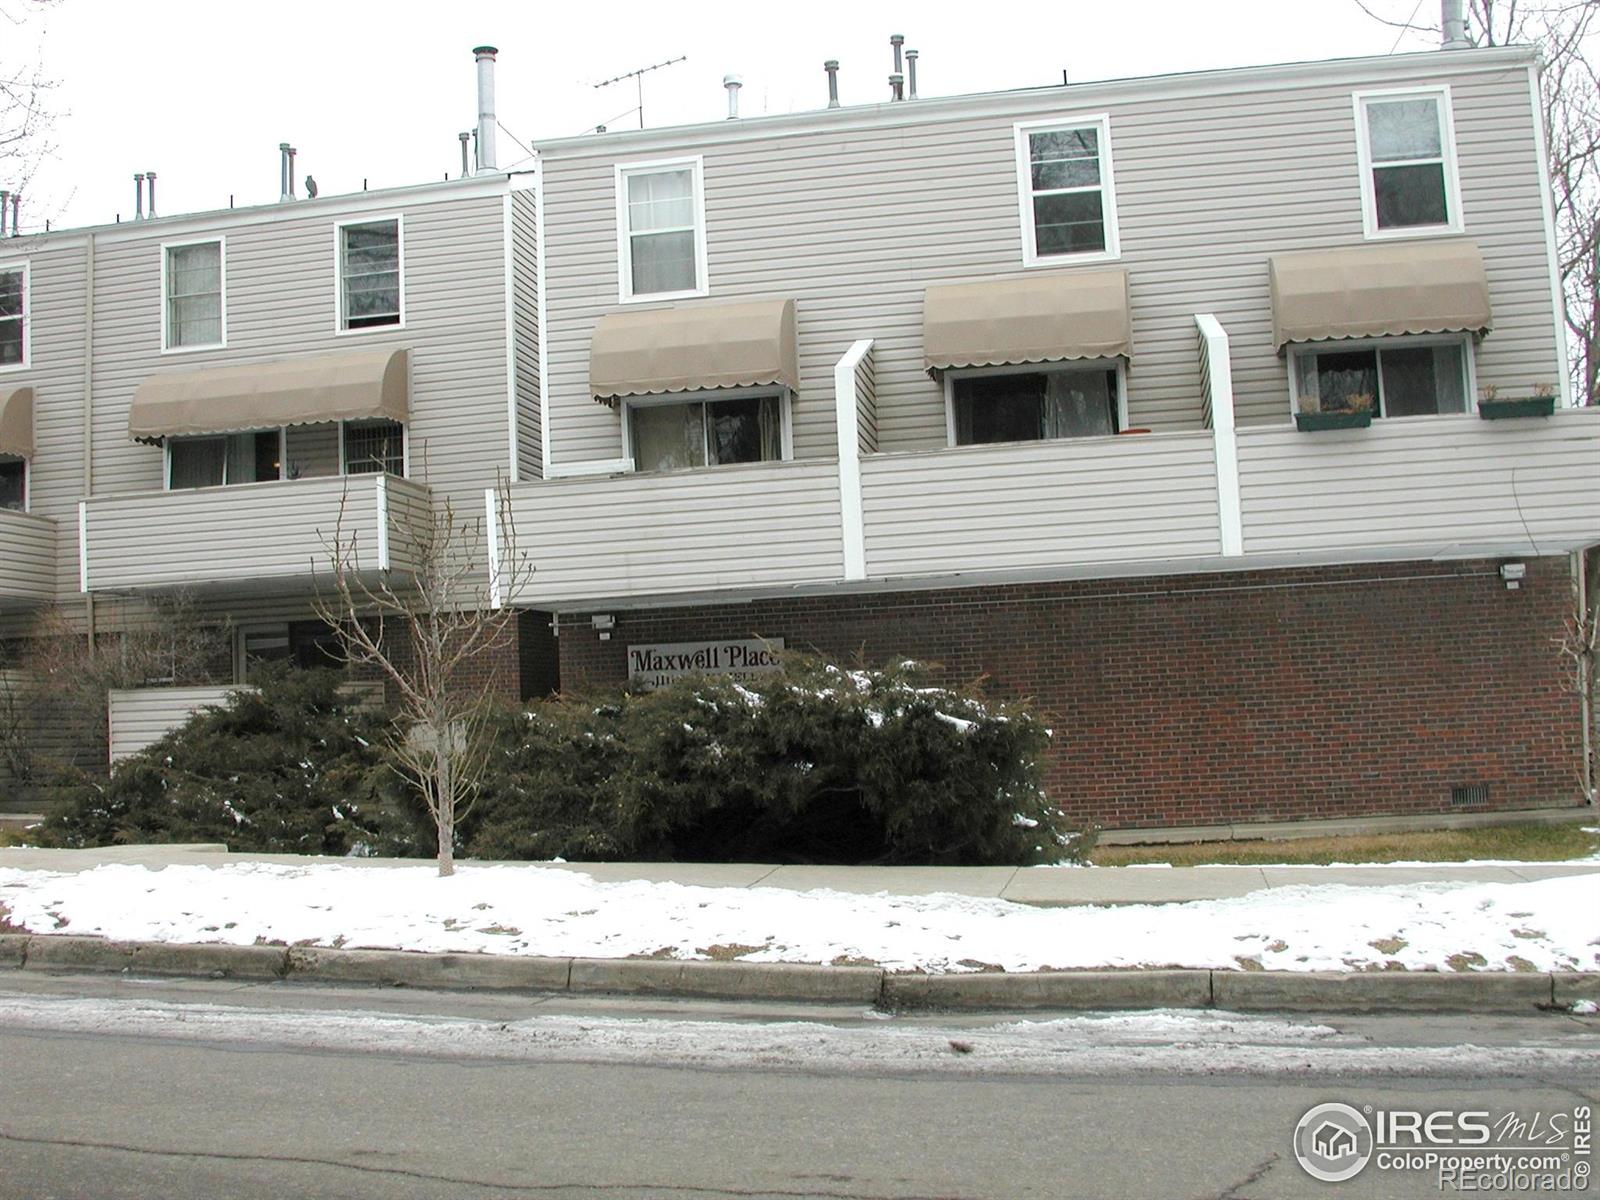
$344,900
1
bds
|
1
ba
|
520
sqft
|
built
1971
1111 Maxwell Ave, Boulder, CO 80304
$-1,101
Cash flow
-16.7%
Cash-on-Cash Return
2.5%
Cap rate
0.5%
Rent to Value Ratio
Active
$1,800,000
3
bds
|
4
ba
|
2,588
sqft
|
built
2007
2826 Broadway St, Boulder, CO 80304
$-5,863
Cash flow
-17.0%
Cash-on-Cash Return
2.4%
Cap rate
0.4%
Rent to Value Ratio
Active
$375,000
2
bds
|
1
ba
|
963
sqft
|
built
1968
3365 Chisholm Trl, Boulder, CO 80301
$-1,024
Cash flow
-14.2%
Cash-on-Cash Return
3.0%
Cap rate
0.6%
Rent to Value Ratio
Active
$385,000
1
bds
|
1
ba
|
462
sqft
|
built
1984
3025 Broadway St, Boulder, CO 80304
$-1,215
Cash flow
-16.5%
Cash-on-Cash Return
2.5%
Cap rate
0.5%
Rent to Value Ratio
Active
$645,000
1
bds
|
1
ba
|
663
sqft
|
built
2005
1360 Walnut St, Boulder, CO 80302
$-2,370
Cash flow
-19.2%
Cash-on-Cash Return
1.9%
Cap rate
0.4%
Rent to Value Ratio
Active
$345,500
1
bds
|
1
ba
|
474
sqft
|
built
1984
3025 Broadway St, Boulder, CO 80304
$-1,147
Cash flow
-17.3%
Cash-on-Cash Return
2.3%
Cap rate
0.5%
Rent to Value Ratio
Active
$487,450
2
bds
|
1
ba
|
816
sqft
|
built
1971
1111 Maxwell Ave, Boulder, CO 80304
$-2,000
Cash flow
-21.4%
Cash-on-Cash Return
1.4%
Cap rate
0.4%
Rent to Value Ratio
Active
$1,300,000
4
bds
|
4
ba
|
2,651
sqft
|
built
1995
93 Pine Needle Rd, Boulder, CO 80304
$-3,718
Cash flow
-14.9%
Cash-on-Cash Return
2.9%
Cap rate
0.4%
Rent to Value Ratio
Active
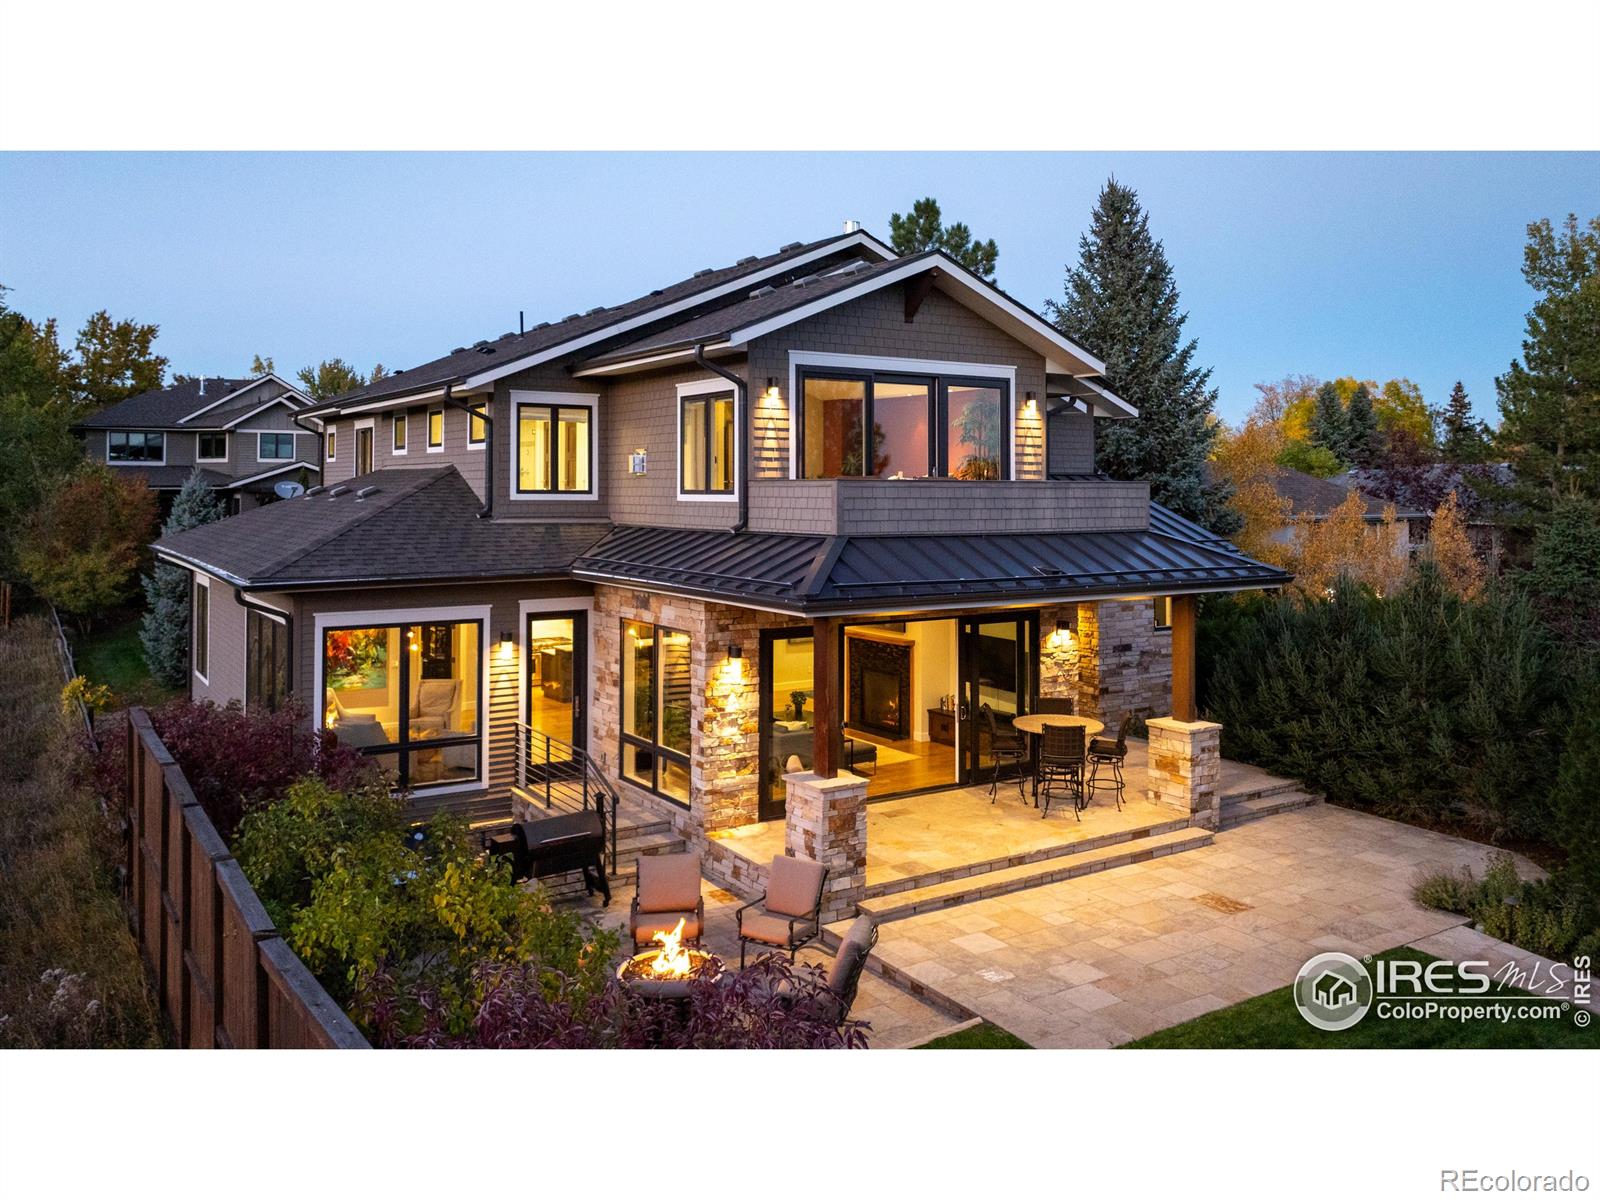
$2,995,000
4
bds
|
5
ba
|
4,093
sqft
|
built
1984
3945 Promontory Ct, Boulder, CO 80304
$-12,499
Cash flow
-21.8%
Cash-on-Cash Return
1.3%
Cap rate
0.2%
Rent to Value Ratio
Active
$740,000
3
bds
|
3
ba
|
2,127
sqft
|
built
1999
301 Widgeon Dr, Longmont, CO 80503
$-2,158
Cash flow
-15.2%
Cash-on-Cash Return
2.8%
Cap rate
0.4%
Rent to Value Ratio
Active
$1,695,000
3
bds
|
0
ba
|
0
sqft
|
built
1922
2221 Columbine Ave, Boulder, CO 80302
$-7,134
Cash flow
-22.0%
Cash-on-Cash Return
1.2%
Cap rate
0.2%
Rent to Value Ratio
Active
$928,000
6
bds
|
2
ba
|
2,347
sqft
|
built
1957
2994 23rd St, Boulder, CO 80304
$-2,695
Cash flow
-15.2%
Cash-on-Cash Return
2.8%
Cap rate
0.4%
Rent to Value Ratio
Active
$3,465,000
4
bds
|
4
ba
|
4,333
sqft
|
built
1992
987 Lost Angel Rd, Boulder, CO 80302
$-12,727
Cash flow
-19.2%
Cash-on-Cash Return
1.9%
Cap rate
0.3%
Rent to Value Ratio
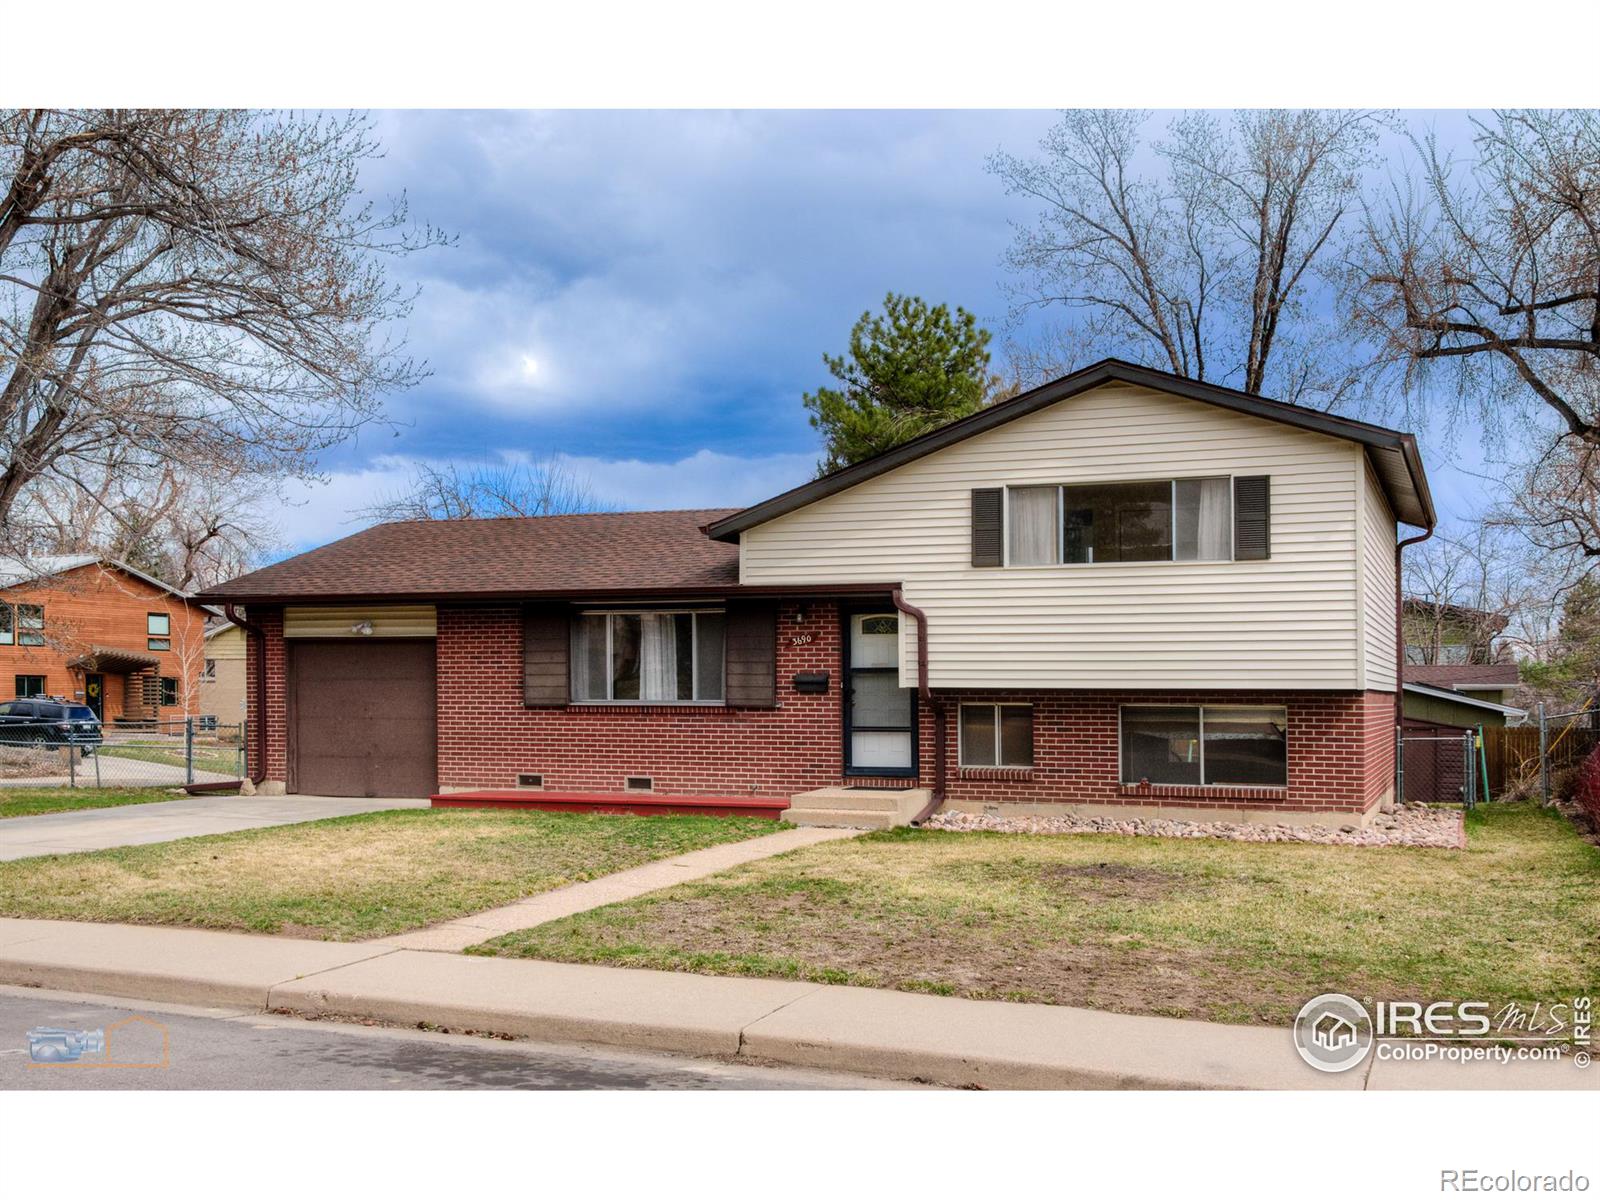
Active under contract
$935,000
3
bds
|
2
ba
|
1,804
sqft
|
built
1962
3690 Conifer Ct, Boulder, CO 80304
$-2,588
Cash flow
-14.4%
Cash-on-Cash Return
3.0%
Cap rate
0.4%
Rent to Value Ratio
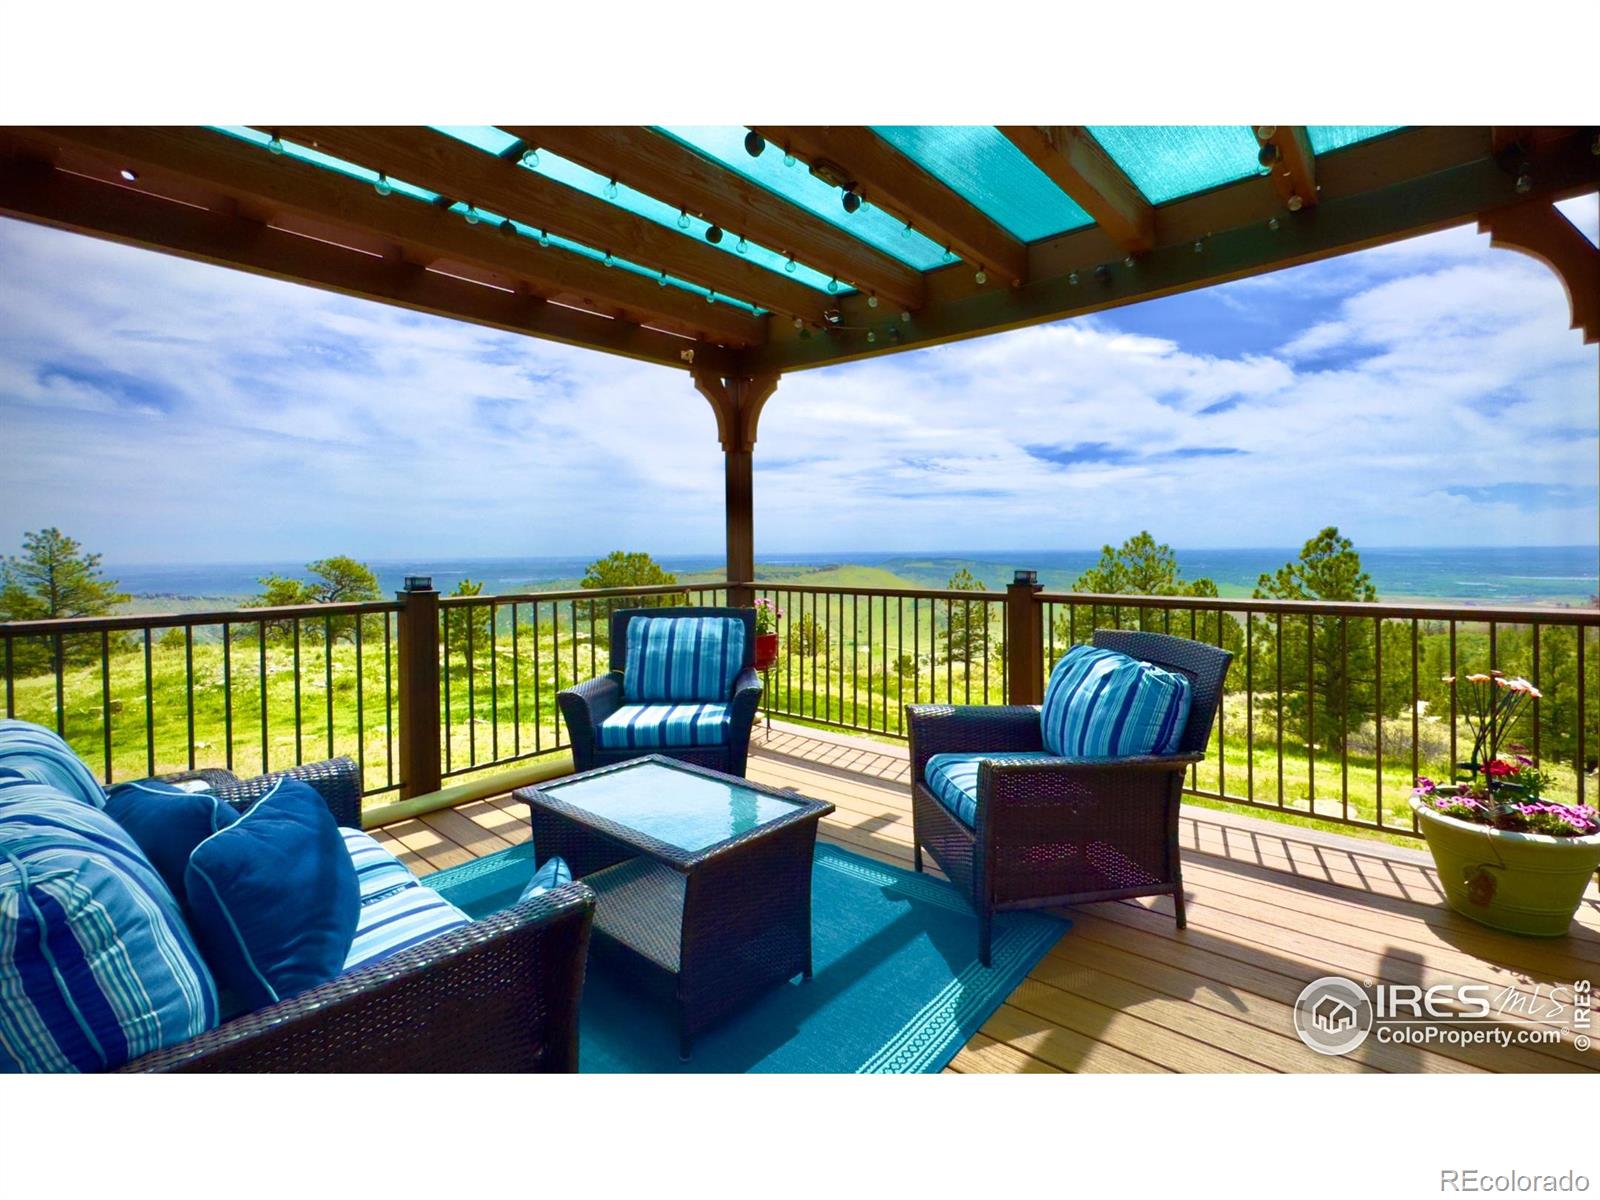
Active
$1,495,000
4
bds
|
3
ba
|
3,090
sqft
|
built
1977
15757 Mossrock Dr, Longmont, CO 80503
$-5,651
Cash flow
-19.7%
Cash-on-Cash Return
1.7%
Cap rate
0.3%
Rent to Value Ratio
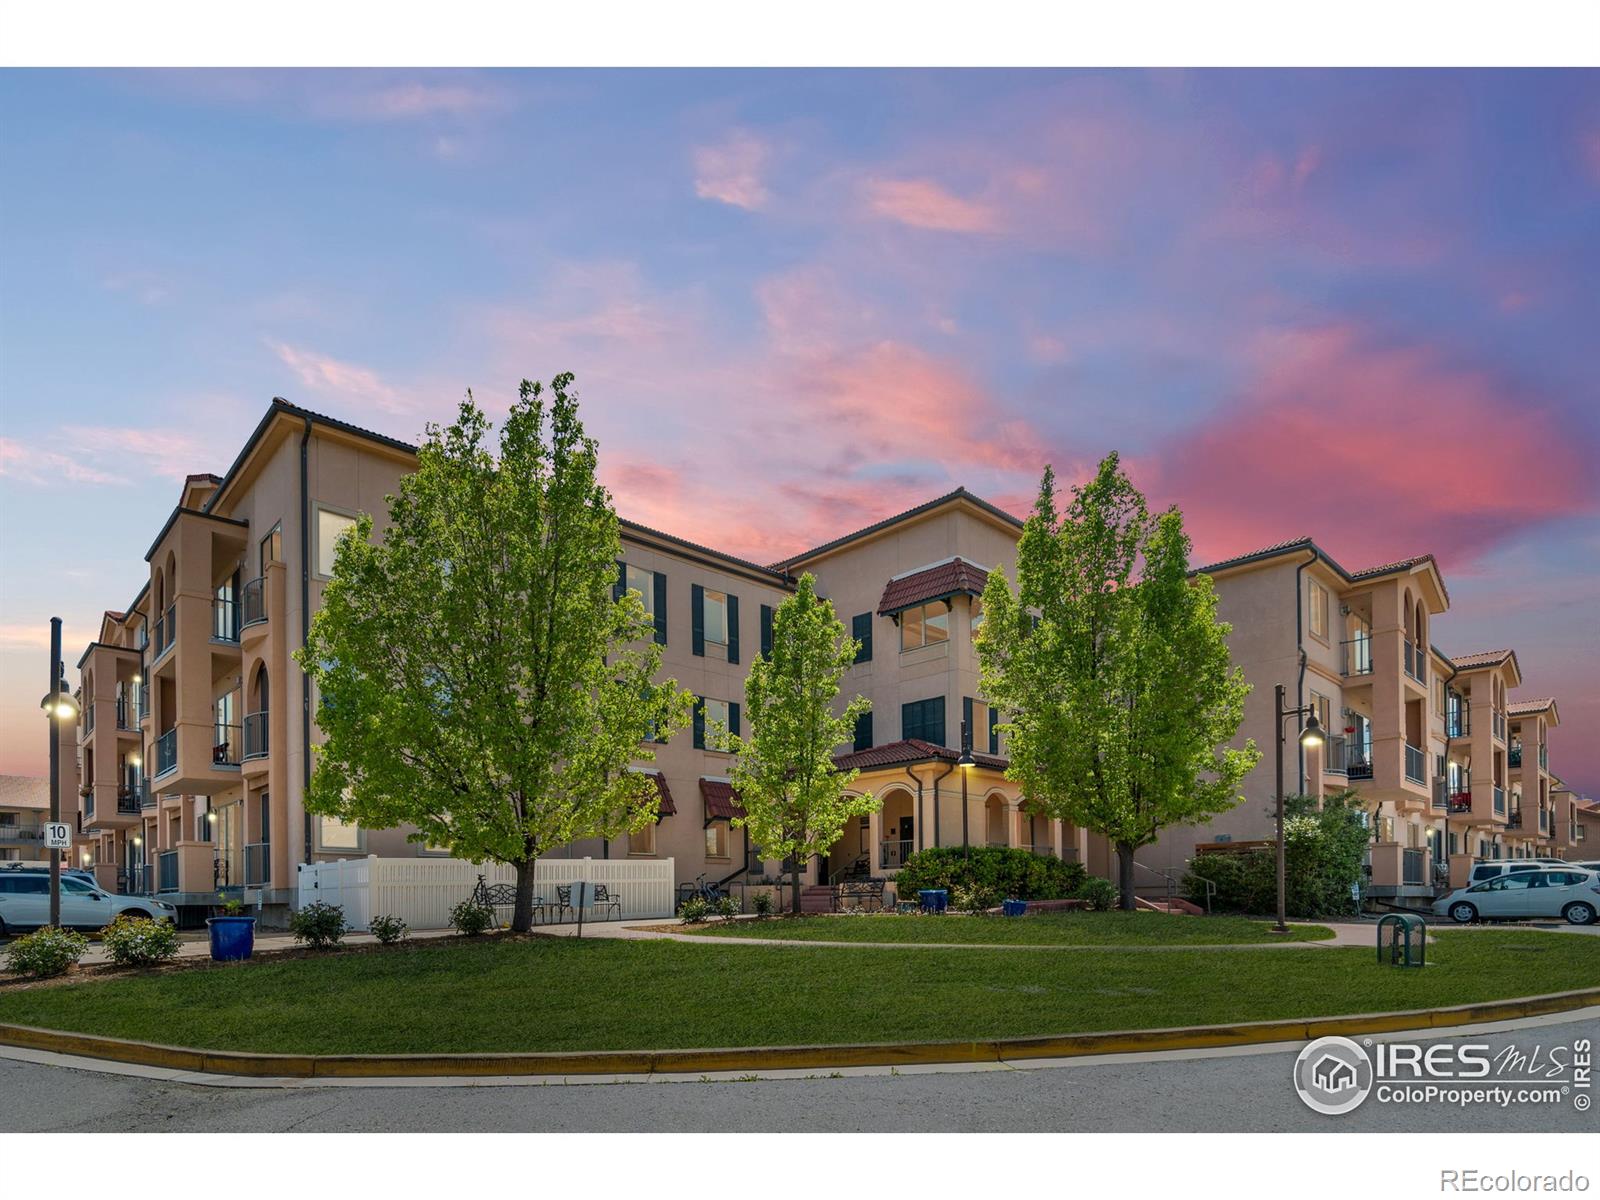
Active
$569,000
2
bds
|
2
ba
|
1,051
sqft
|
built
2004
4500 Baseline Rd, Boulder, CO 80303
$-2,284
Cash flow
-20.9%
Cash-on-Cash Return
1.5%
Cap rate
0.4%
Rent to Value Ratio
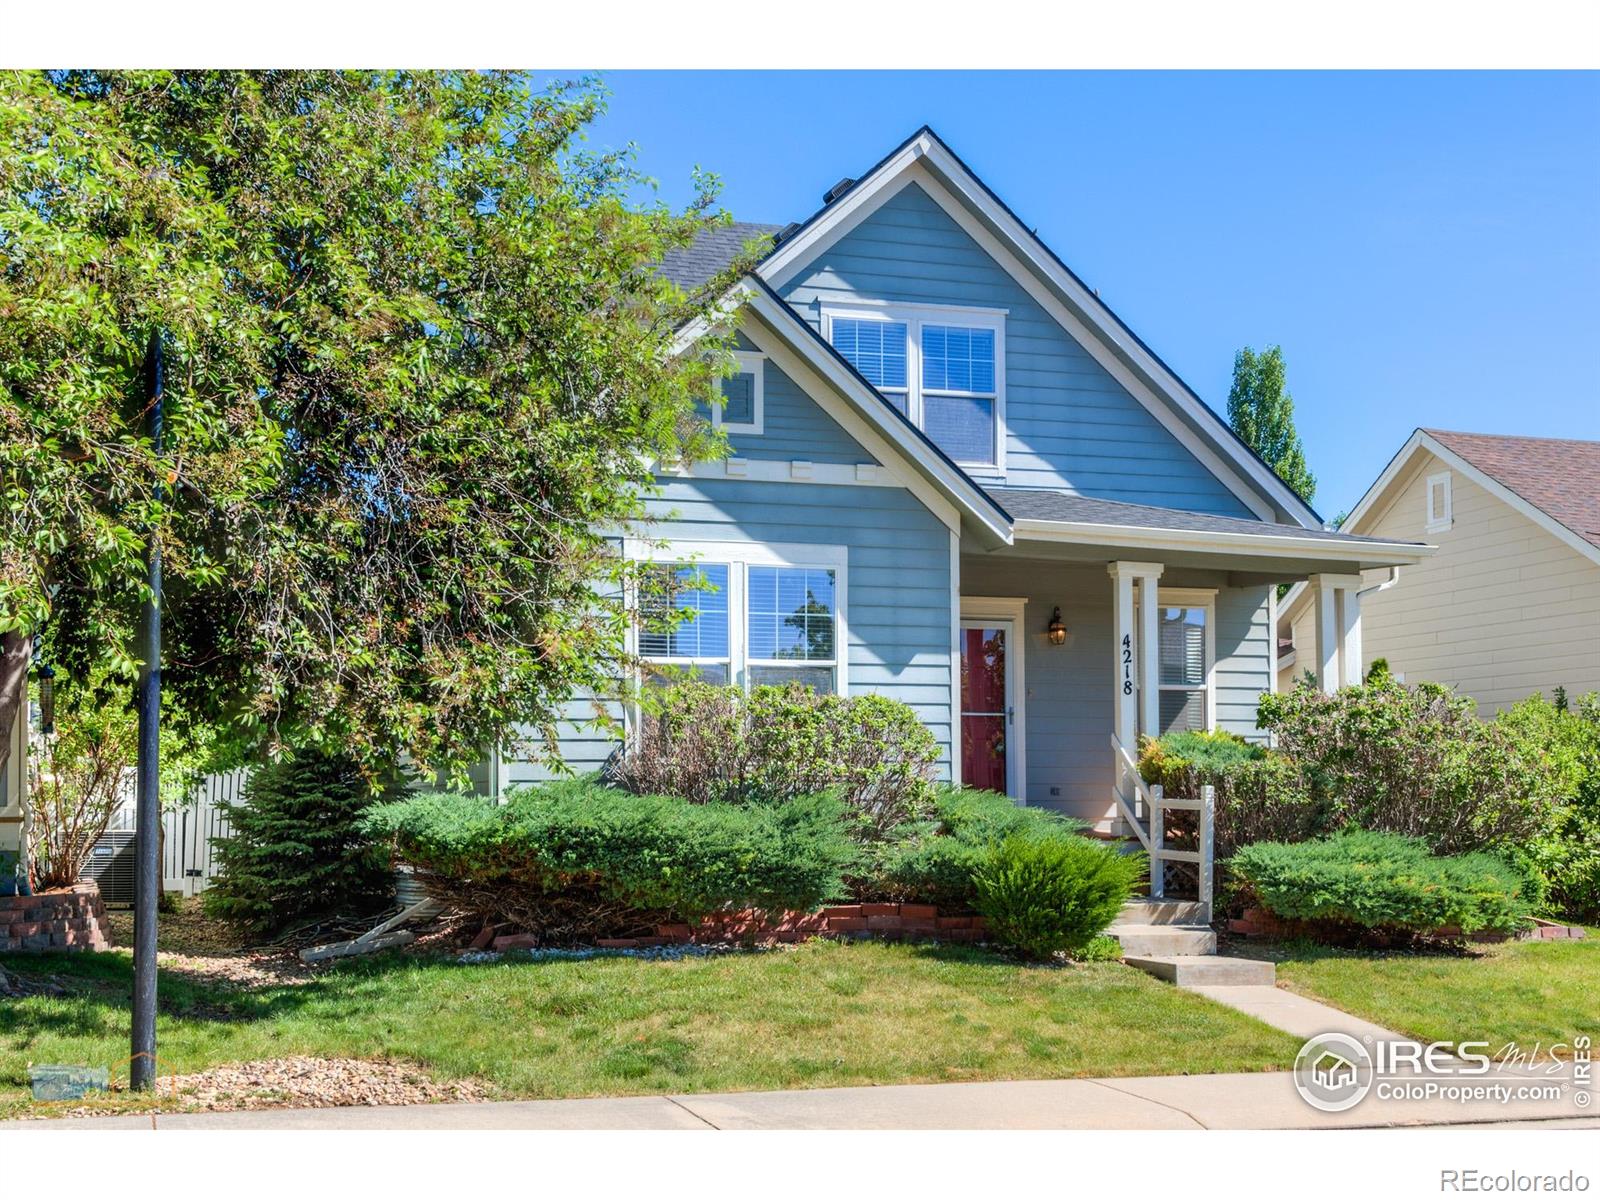
Active
$715,000
3
bds
|
3
ba
|
1,996
sqft
|
built
2004
4218 San Marco Dr, Longmont, CO 80503
$-1,977
Cash flow
-14.4%
Cash-on-Cash Return
3.0%
Cap rate
0.4%
Rent to Value Ratio
Active
$4,300,000
4
bds
|
5
ba
|
5,338
sqft
|
built
2017
1525 Jennine Pl, Boulder, CO 80304
$-19,032
Cash flow
-23.1%
Cash-on-Cash Return
1.0%
Cap rate
0.2%
Rent to Value Ratio
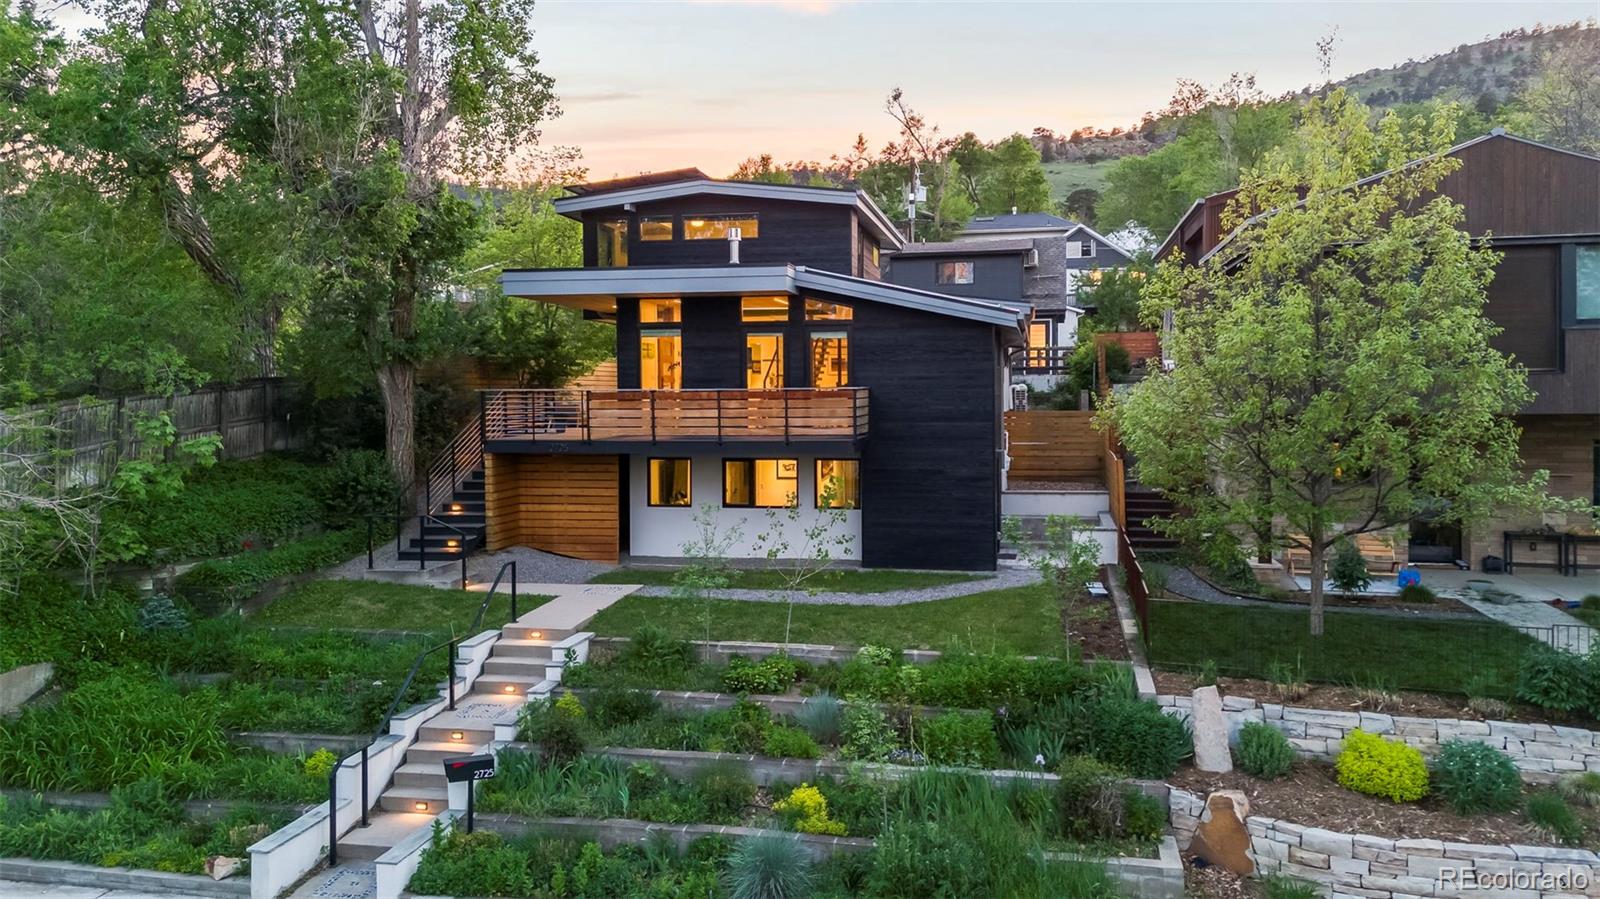
Active
$3,695,000
5
bds
|
5
ba
|
3,471
sqft
|
built
1960
2725 6th St, Boulder, CO 80304
$-15,297
Cash flow
-21.6%
Cash-on-Cash Return
1.3%
Cap rate
0.2%
Rent to Value Ratio
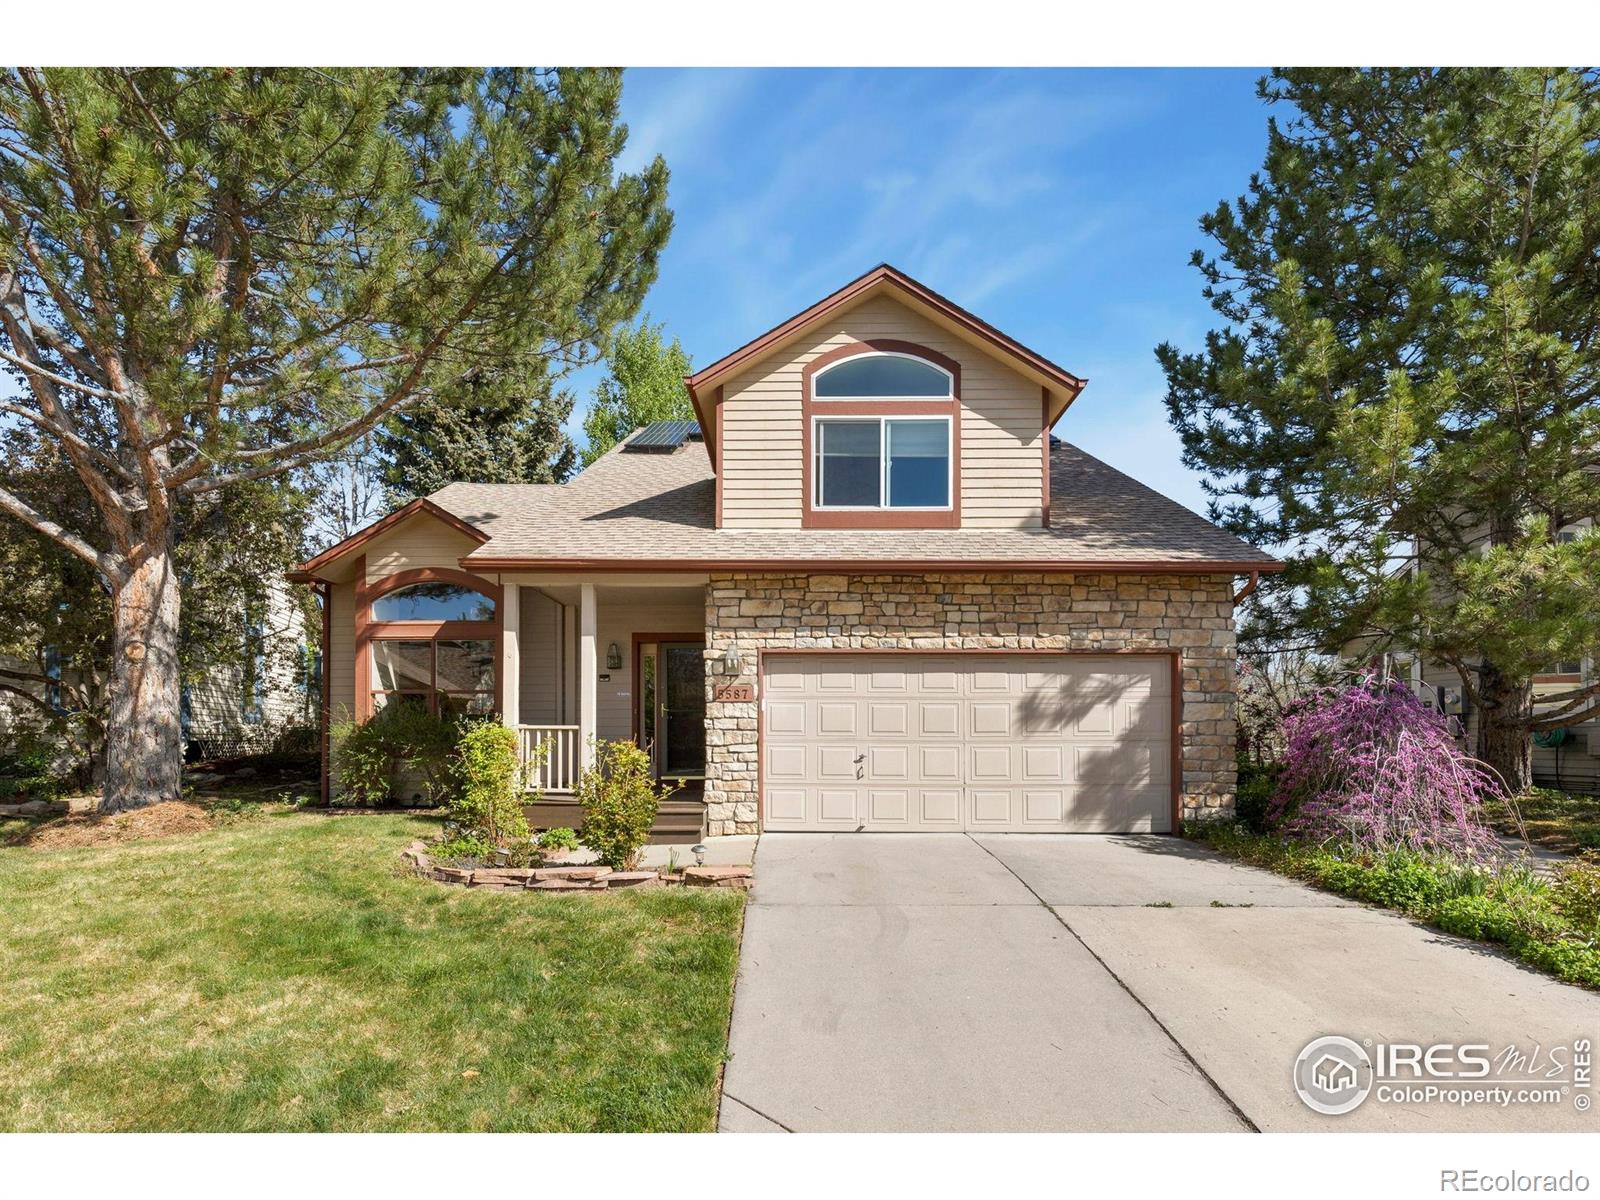
Active
$750,000
4
bds
|
4
ba
|
2,138
sqft
|
built
1989
5587 Glendale Gulch Cir, Boulder, CO 80301
$-2,256
Cash flow
-15.7%
Cash-on-Cash Return
2.7%
Cap rate
0.4%
Rent to Value Ratio

Active
$18,000,000
7
bds
|
10
ba
|
8,978
sqft
|
built
2021
706 Juniper Ave, Boulder, CO 80304
$-93,214
Cash flow
-27.0%
Cash-on-Cash Return
0.1%
Cap rate
0.0%
Rent to Value Ratio
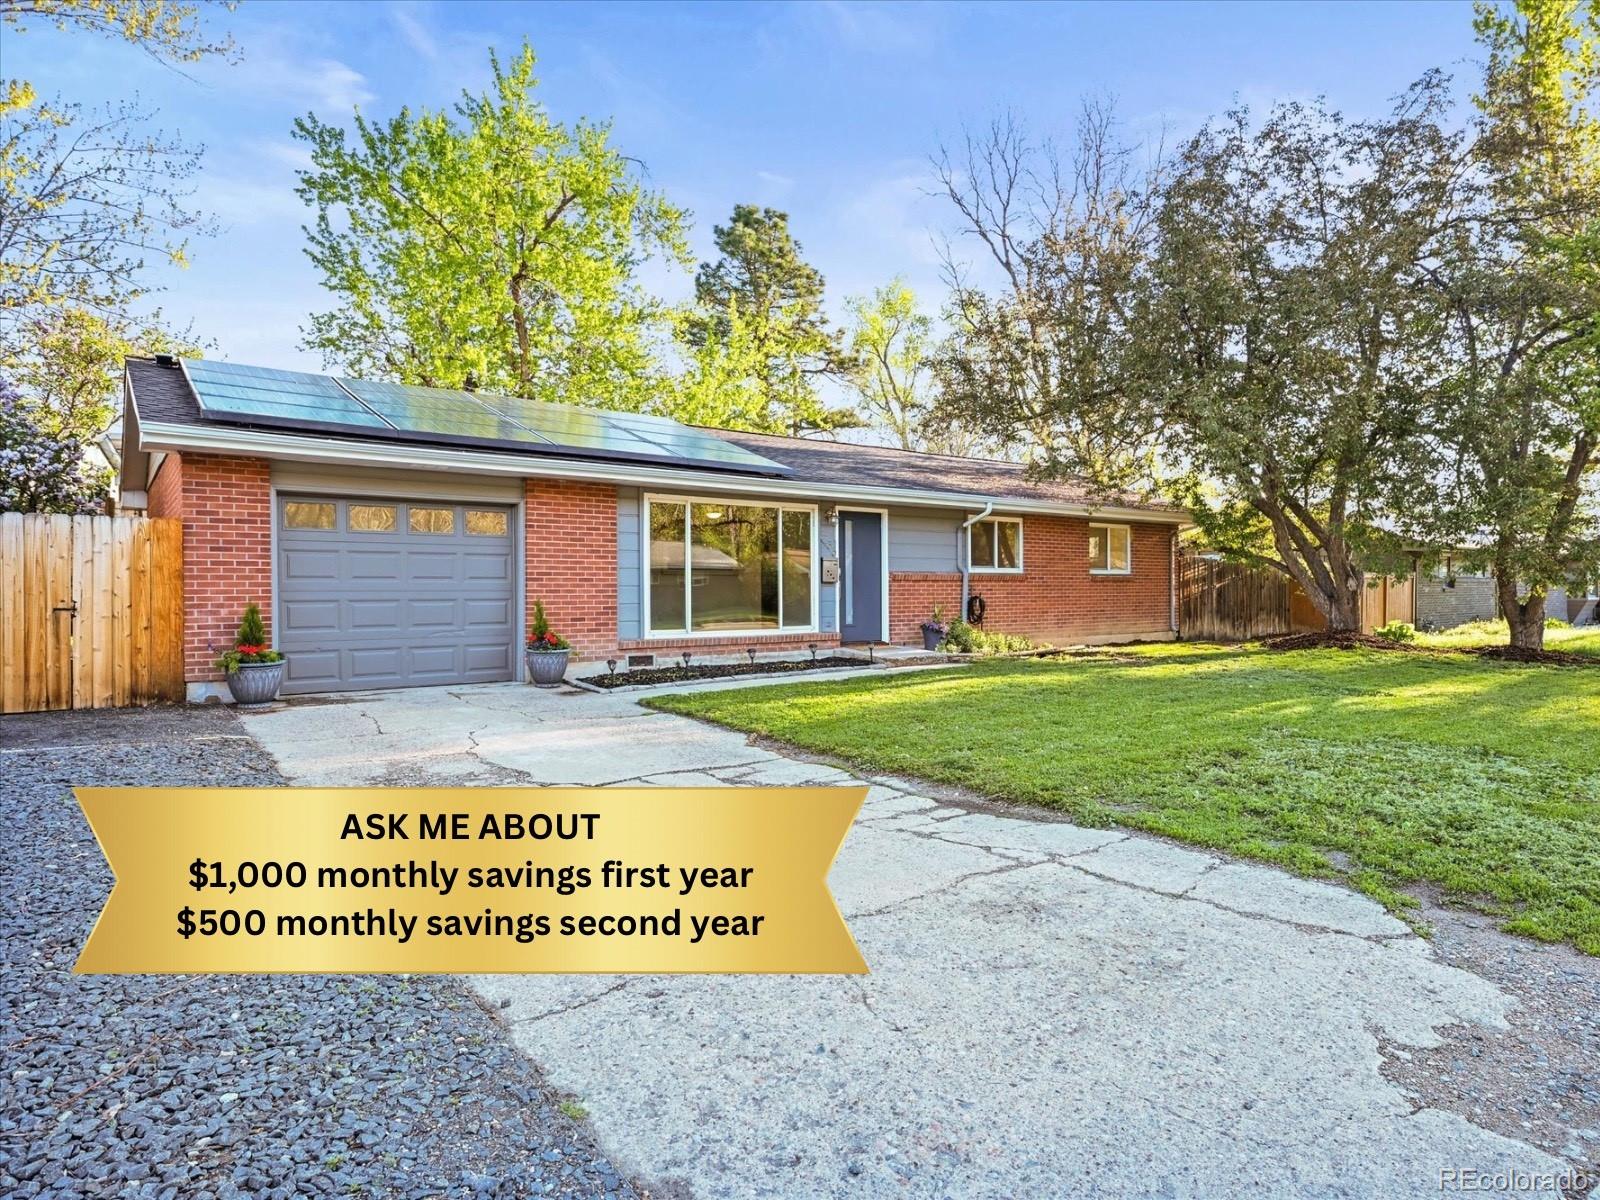
Closed
$950,000
3
bds
|
1
ba
|
1,320
sqft
|
built
1957
2235 Edgewood Dr, Boulder, CO 80304
$-3,062
Cash flow
-16.8%
Cash-on-Cash Return
2.4%
Cap rate
0.4%
Rent to Value Ratio
Active
$1,695,000
4
bds
|
2
ba
|
1,781
sqft
|
built
1985
2255 18th St, Boulder, CO 80302
$-5,726
Cash flow
-17.6%
Cash-on-Cash Return
2.2%
Cap rate
0.3%
Rent to Value Ratio
Active
$4,500,000
5
bds
|
3
ba
|
3,654
sqft
|
built
1976
630 Northstar Ct, Boulder, CO 80304
$-21,754
Cash flow
-25.2%
Cash-on-Cash Return
0.5%
Cap rate
0.1%
Rent to Value Ratio
Active
$725,000
5
bds
|
3
ba
|
2,464
sqft
|
built
1977
6396 Twin Lakes Rd, Boulder, CO 80301
$-2,033
Cash flow
-14.6%
Cash-on-Cash Return
2.9%
Cap rate
0.4%
Rent to Value Ratio