Boulder County Investment Properties for Sale
Browse homes for sale and investment properties in Boulder County. Refine your search by price, property type, or more.
Best cash flowing properties in Boulder County

Active
$249,000
2
bds
|
1
ba
|
901
sqft
|
built
1972
1608 Cottonwood Dr, Louisville, CO 80027
$-347
Cash flow
-7.3%
Cash-on-Cash Return
4.6%
Cap rate
0.8%
Rent to Value Ratio

Active under contract
$395,000
3
bds
|
2
ba
|
1,377
sqft
|
built
1973
1605 Longbow Ct, Lafayette, CO 80026
$-1,058
Cash flow
-14.0%
Cash-on-Cash Return
3.1%
Cap rate
0.5%
Rent to Value Ratio
1,184 out of 1,321 properties for sale in Boulder County
Limited Results Shown
Create a free account, or log in to reveal all property listings and enjoy the complete experience.

Active
$999,000
4
bds
|
3
ba
|
2,598
sqft
|
built
2020
1920 Marfell St, Erie, CO 80516
$-2,830
Cash flow
-14.8%
Cash-on-Cash Return
2.9%
Cap rate
0.5%
Rent to Value Ratio

Pending
$1,690,000
5
bds
|
4
ba
|
4,086
sqft
|
built
1998
4094 Bimini Ct, Boulder, CO 80301
$-5,320
Cash flow
-16.4%
Cash-on-Cash Return
2.5%
Cap rate
0.4%
Rent to Value Ratio
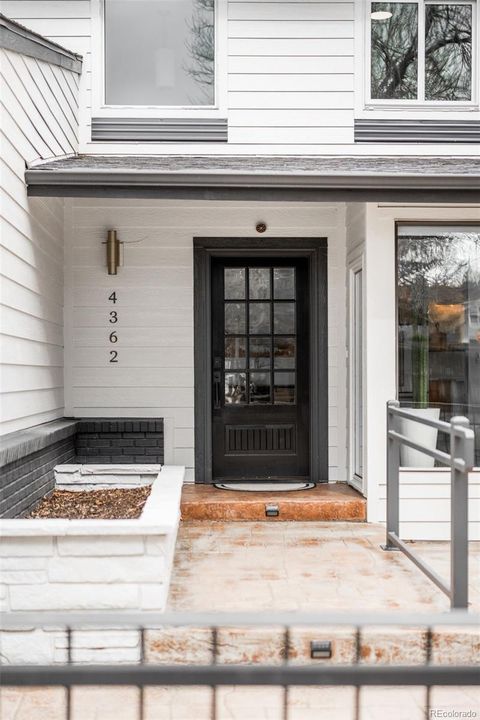
Active
$2,150,000
4
bds
|
3
ba
|
2,388
sqft
|
built
1981
4362 Peach Ct, Boulder, CO 80301
$-6,751
Cash flow
-16.4%
Cash-on-Cash Return
2.5%
Cap rate
0.4%
Rent to Value Ratio

Active
$2,395,000
4
bds
|
3
ba
|
3,292
sqft
|
built
1970
3380 Longwood Ave, Boulder, CO 80305
$-10,131
Cash flow
-22.1%
Cash-on-Cash Return
1.2%
Cap rate
0.2%
Rent to Value Ratio

Active
$1,200,000
3
bds
|
2
ba
|
1,200
sqft
|
built
1985
2276 Goss Cir, Boulder, CO 80302
$-4,553
Cash flow
-19.8%
Cash-on-Cash Return
1.7%
Cap rate
0.3%
Rent to Value Ratio
Active
$430,000
4
bds
|
4
ba
|
1,784
sqft
|
built
1998
1419 Red Mountain Dr, Longmont, CO 80504
$-1,204
Cash flow
-14.6%
Cash-on-Cash Return
2.9%
Cap rate
0.5%
Rent to Value Ratio

Active
$3,995,000
5
bds
|
5
ba
|
5,593
sqft
|
built
1970
7088 Indian Peaks Trl, Boulder, CO 80301
$-16,180
Cash flow
-21.1%
Cash-on-Cash Return
1.4%
Cap rate
0.2%
Rent to Value Ratio

Active under contract
$1,095,000
4
bds
|
4
ba
|
3,330
sqft
|
built
2002
3122 Notabon Ct, Lafayette, CO 80026
$-3,639
Cash flow
-17.3%
Cash-on-Cash Return
2.3%
Cap rate
0.4%
Rent to Value Ratio

Active under contract
$535,000
2
bds
|
3
ba
|
1,725
sqft
|
built
1997
281 Rockview Dr, Superior, CO 80027
$-1,685
Cash flow
-16.4%
Cash-on-Cash Return
2.5%
Cap rate
0.5%
Rent to Value Ratio
Active under contract
$395,000
3
bds
|
2
ba
|
1,377
sqft
|
built
1973
1605 Longbow Ct, Lafayette, CO 80026
$-1,058
Cash flow
-14.0%
Cash-on-Cash Return
3.1%
Cap rate
0.5%
Rent to Value Ratio

Active
$725,000
4
bds
|
3
ba
|
2,900
sqft
|
built
1998
255 Divide View Dr, Golden, CO 80403
$-1,622
Cash flow
-11.7%
Cash-on-Cash Return
3.6%
Cap rate
0.5%
Rent to Value Ratio

Active
$4,495,000
5
bds
|
5
ba
|
6,484
sqft
|
built
1995
9610 Avocet Ln, Lafayette, CO 80026
$-18,597
Cash flow
-21.6%
Cash-on-Cash Return
1.3%
Cap rate
0.2%
Rent to Value Ratio

Active under contract
$629,799
3
bds
|
2
ba
|
1,920
sqft
|
built
1985
803 W Lucerne Dr, Lafayette, CO 80026
$-1,774
Cash flow
-14.7%
Cash-on-Cash Return
2.9%
Cap rate
0.4%
Rent to Value Ratio
Active
$649,999
5
bds
|
3
ba
|
1,885
sqft
|
built
1979
1065 Modred St, Lafayette, CO 80026
$-1,714
Cash flow
-13.8%
Cash-on-Cash Return
3.1%
Cap rate
0.4%
Rent to Value Ratio

Active
$690,000
3
bds
|
3
ba
|
1,520
sqft
|
built
1998
2905 E Yarrow Cir, Superior, CO 80027
$-1,862
Cash flow
-14.1%
Cash-on-Cash Return
3.0%
Cap rate
0.4%
Rent to Value Ratio

Active
$583,000
3
bds
|
3
ba
|
1,616
sqft
|
built
2000
588 Beauprez Ave, Lafayette, CO 80026
$-1,818
Cash flow
-16.3%
Cash-on-Cash Return
2.5%
Cap rate
0.5%
Rent to Value Ratio

Active under contract
$1,375,000
6
bds
|
4
ba
|
3,980
sqft
|
built
1998
1996 Clipper Dr, Lafayette, CO 80026
$-3,508
Cash flow
-13.3%
Cash-on-Cash Return
3.2%
Cap rate
0.5%
Rent to Value Ratio

Active
$2,995,000
4
bds
|
4
ba
|
5,215
sqft
|
built
2018
724 Johnson St, Louisville, CO 80027
$-10,615
Cash flow
-18.5%
Cash-on-Cash Return
2.0%
Cap rate
0.3%
Rent to Value Ratio
Active
$249,000
2
bds
|
1
ba
|
901
sqft
|
built
1972
1608 Cottonwood Dr, Louisville, CO 80027
$-347
Cash flow
-7.3%
Cash-on-Cash Return
4.6%
Cap rate
0.8%
Rent to Value Ratio

Pending
$1,150,000
3
bds
|
2
ba
|
1,280
sqft
|
built
1900
13183 N 95th St, Longmont, CO 80504
$-3,734
Cash flow
-16.9%
Cash-on-Cash Return
2.4%
Cap rate
0.3%
Rent to Value Ratio

Active
$655,000
4
bds
|
4
ba
|
2,361
sqft
|
built
2002
2144 Santa Fe Dr, Longmont, CO 80504
$-1,725
Cash flow
-13.7%
Cash-on-Cash Return
3.1%
Cap rate
0.4%
Rent to Value Ratio

Active
$385,000
1
bds
|
1
ba
|
570
sqft
|
built
1989
2727 Folsom St, Boulder, CO 80304
$-1,288
Cash flow
-17.5%
Cash-on-Cash Return
2.3%
Cap rate
0.5%
Rent to Value Ratio

Active
$1,250,000
4
bds
|
4
ba
|
3,650
sqft
|
built
2019
2113 Fountain Cir, Erie, CO 80516
$-4,662
Cash flow
-19.5%
Cash-on-Cash Return
1.8%
Cap rate
0.3%
Rent to Value Ratio

Active
$1,395,000
5
bds
|
4
ba
|
3,122
sqft
|
built
1986
1067 W Alder St, Louisville, CO 80027
$-4,592
Cash flow
-17.2%
Cash-on-Cash Return
2.3%
Cap rate
0.3%
Rent to Value Ratio

Active
$1,450,000
3
bds
|
3
ba
|
1,870
sqft
|
built
1949
7800 Hygiene Rd, Longmont, CO 80503
$-5,544
Cash flow
-19.9%
Cash-on-Cash Return
1.7%
Cap rate
0.2%
Rent to Value Ratio

Active
$645,000
2
bds
|
1
ba
|
878
sqft
|
built
1951
1201 Balsam Ave, Boulder, CO 80304
$-2,201
Cash flow
-17.8%
Cash-on-Cash Return
2.2%
Cap rate
0.4%
Rent to Value Ratio

Active
$1,479,000
6
bds
|
5
ba
|
5,723
sqft
|
built
2004
2005 Calico Ct, Longmont, CO 80503
$-5,573
Cash flow
-19.7%
Cash-on-Cash Return
1.7%
Cap rate
0.3%
Rent to Value Ratio

Active
$1,477,000
3
bds
|
3
ba
|
2,164
sqft
|
built
1972
8586 N 55th St, Longmont, CO 80503
$-4,592
Cash flow
-16.2%
Cash-on-Cash Return
2.5%
Cap rate
0.4%
Rent to Value Ratio
Active
$399,500
2
bds
|
2
ba
|
1,005
sqft
|
built
1994
770 Copper Ln, Louisville, CO 80027
$-1,260
Cash flow
-16.5%
Cash-on-Cash Return
2.5%
Cap rate
0.6%
Rent to Value Ratio

Active
$1,150,000
2
bds
|
1
ba
|
837
sqft
|
built
1910
740 Hawthorn Ave, Boulder, CO 80304
$-4,064
Cash flow
-18.4%
Cash-on-Cash Return
2.0%
Cap rate
0.3%
Rent to Value Ratio

Active
$829,900
5
bds
|
4
ba
|
2,900
sqft
|
built
1996
2047 Erie Ln, Superior, CO 80027
$-2,375
Cash flow
-14.9%
Cash-on-Cash Return
2.8%
Cap rate
0.4%
Rent to Value Ratio

Active
$739,000
2
bds
|
3
ba
|
2,436
sqft
|
built
1965
223 Copperdale Ln, Golden, CO 80403
$-1,660
Cash flow
-11.7%
Cash-on-Cash Return
3.6%
Cap rate
0.5%
Rent to Value Ratio

Active under contract
$2,295,000
5
bds
|
4
ba
|
3,626
sqft
|
built
1991
5695 Aurora Pl, Boulder, CO 80303
$-9,590
Cash flow
-21.8%
Cash-on-Cash Return
1.3%
Cap rate
0.2%
Rent to Value Ratio

Active
$2,340,000
5
bds
|
4
ba
|
4,275
sqft
|
built
2019
3681 Paonia St, Boulder, CO 80301
$-7,385
Cash flow
-16.5%
Cash-on-Cash Return
2.5%
Cap rate
0.4%
Rent to Value Ratio

Active
$1,925,000
3
bds
|
3
ba
|
3,066
sqft
|
built
1991
7785 Darvey Ln, Longmont, CO 80504
$-8,346
Cash flow
-22.6%
Cash-on-Cash Return
1.1%
Cap rate
0.2%
Rent to Value Ratio

Active
$995,000
4
bds
|
4
ba
|
2,548
sqft
|
built
1978
1449 Adams Pl, Louisville, CO 80027
$-2,894
Cash flow
-15.2%
Cash-on-Cash Return
2.8%
Cap rate
0.4%
Rent to Value Ratio

Active
$1,075,000
3
bds
|
2
ba
|
1,008
sqft
|
built
1962
1110 Hartford Dr, Boulder, CO 80305
$-3,911
Cash flow
-19.0%
Cash-on-Cash Return
1.9%
Cap rate
0.3%
Rent to Value Ratio

Active
$2,000,000
3
bds
|
3
ba
|
2,864
sqft
|
built
1964
525 13th St, Boulder, CO 80302
$-7,535
Cash flow
-19.7%
Cash-on-Cash Return
1.7%
Cap rate
0.3%
Rent to Value Ratio

Active under contract
$1,200,000
6
bds
|
4
ba
|
4,300
sqft
|
built
1996
2133 Indian Peaks Cir, Longmont, CO 80504
$-4,083
Cash flow
-17.8%
Cash-on-Cash Return
2.2%
Cap rate
0.3%
Rent to Value Ratio

Pending
$650,000
3
bds
|
4
ba
|
3,020
sqft
|
built
1994
517 Rider Ridge Dr, Longmont, CO 80504
$-1,715
Cash flow
-13.8%
Cash-on-Cash Return
3.1%
Cap rate
0.4%
Rent to Value Ratio