Boulder County Investment Properties for Sale
Browse homes for sale and investment properties in Boulder County. Refine your search by price, property type, or more.
Best cash flowing properties in Boulder County
Active
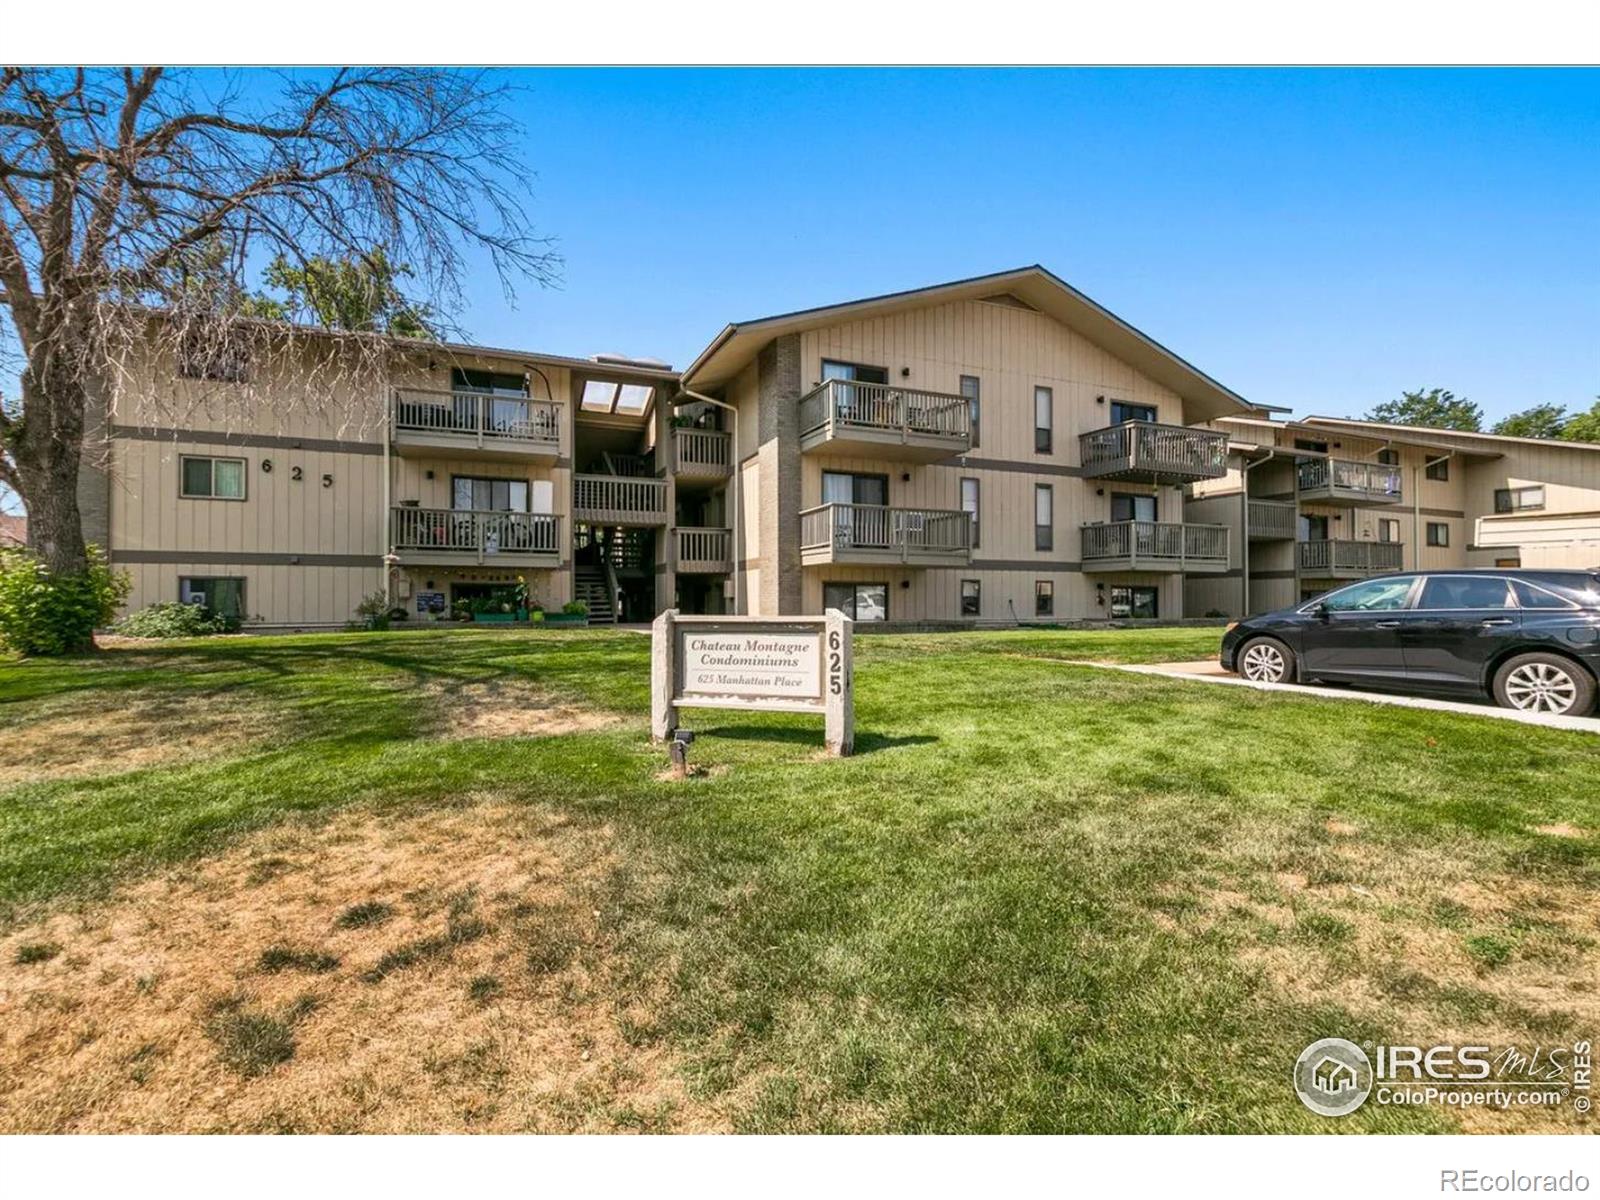
$238,500
2
bds
|
2
ba
|
819
sqft
|
built
1976
625 Manhattan Pl, Boulder, CO 80303
$-301
Cash flow
-6.6%
Cash-on-Cash Return
4.8%
Cap rate
0.9%
Rent to Value Ratio
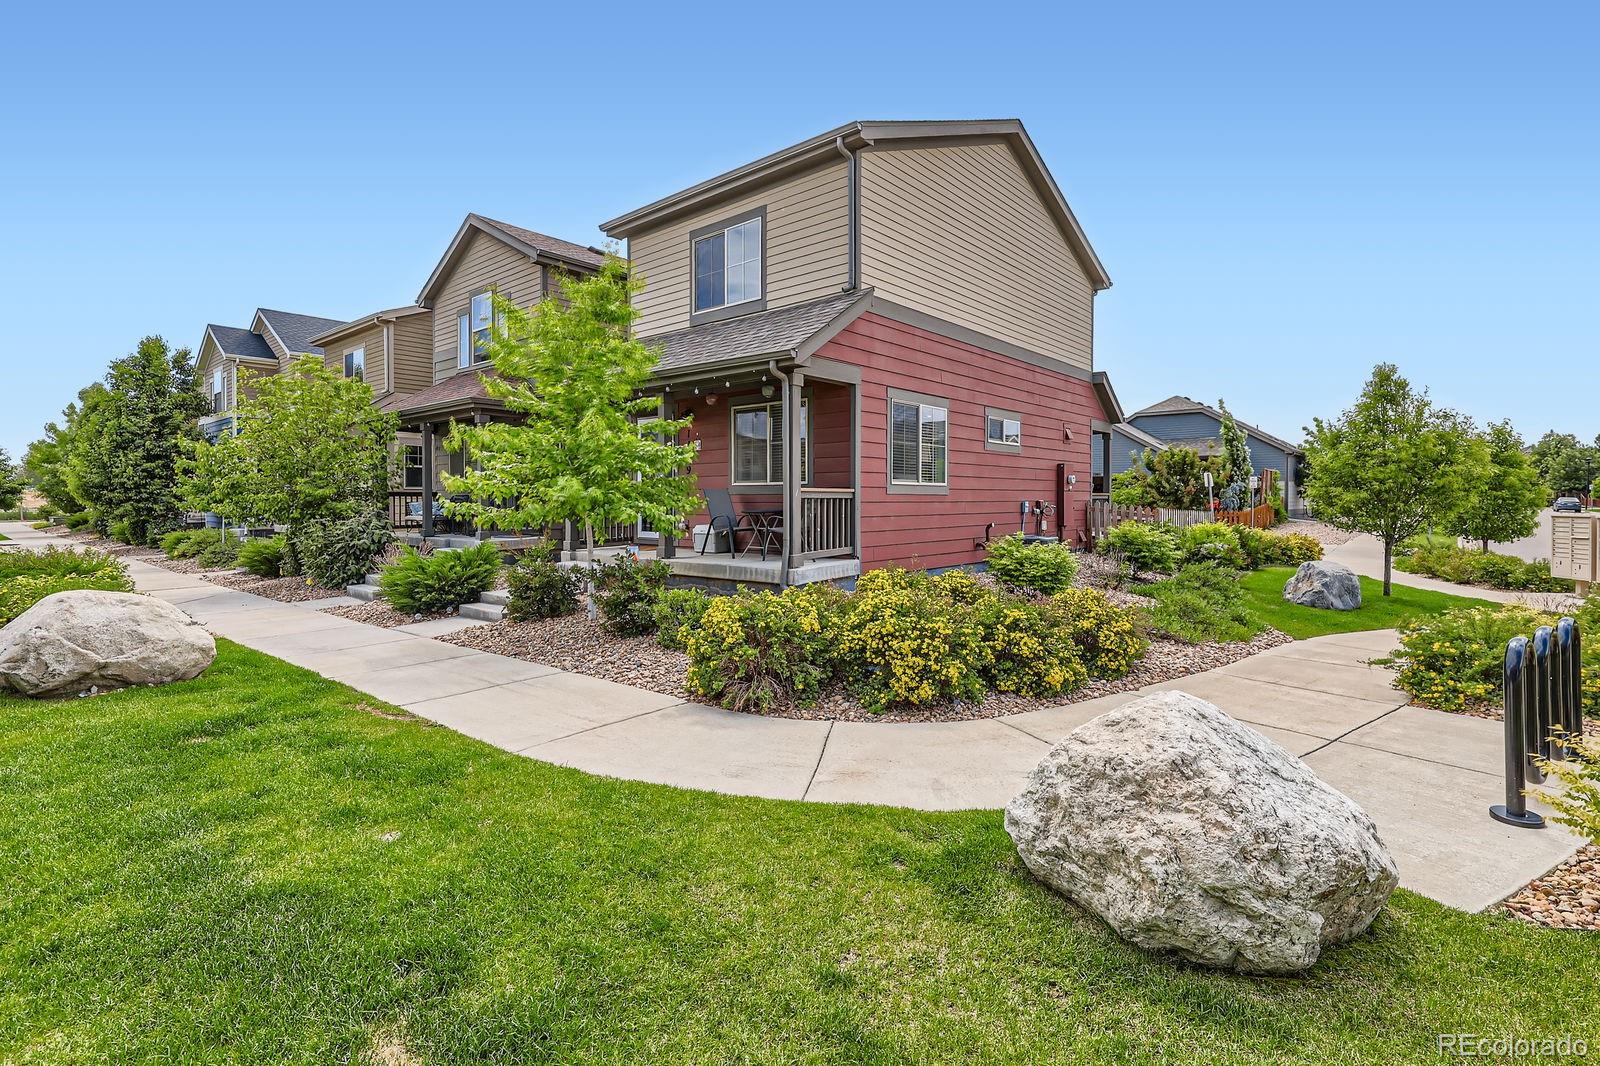
Active
$263,195
2
bds
|
2
ba
|
896
sqft
|
built
2019
1199 Hummingbird Cir, Longmont, CO 80501
$-333
Cash flow
-6.6%
Cash-on-Cash Return
4.8%
Cap rate
0.7%
Rent to Value Ratio
1,200 out of 1,340 properties for sale in Boulder County
Limited Results Shown
Create a free account, or log in to reveal all property listings and enjoy the complete experience.
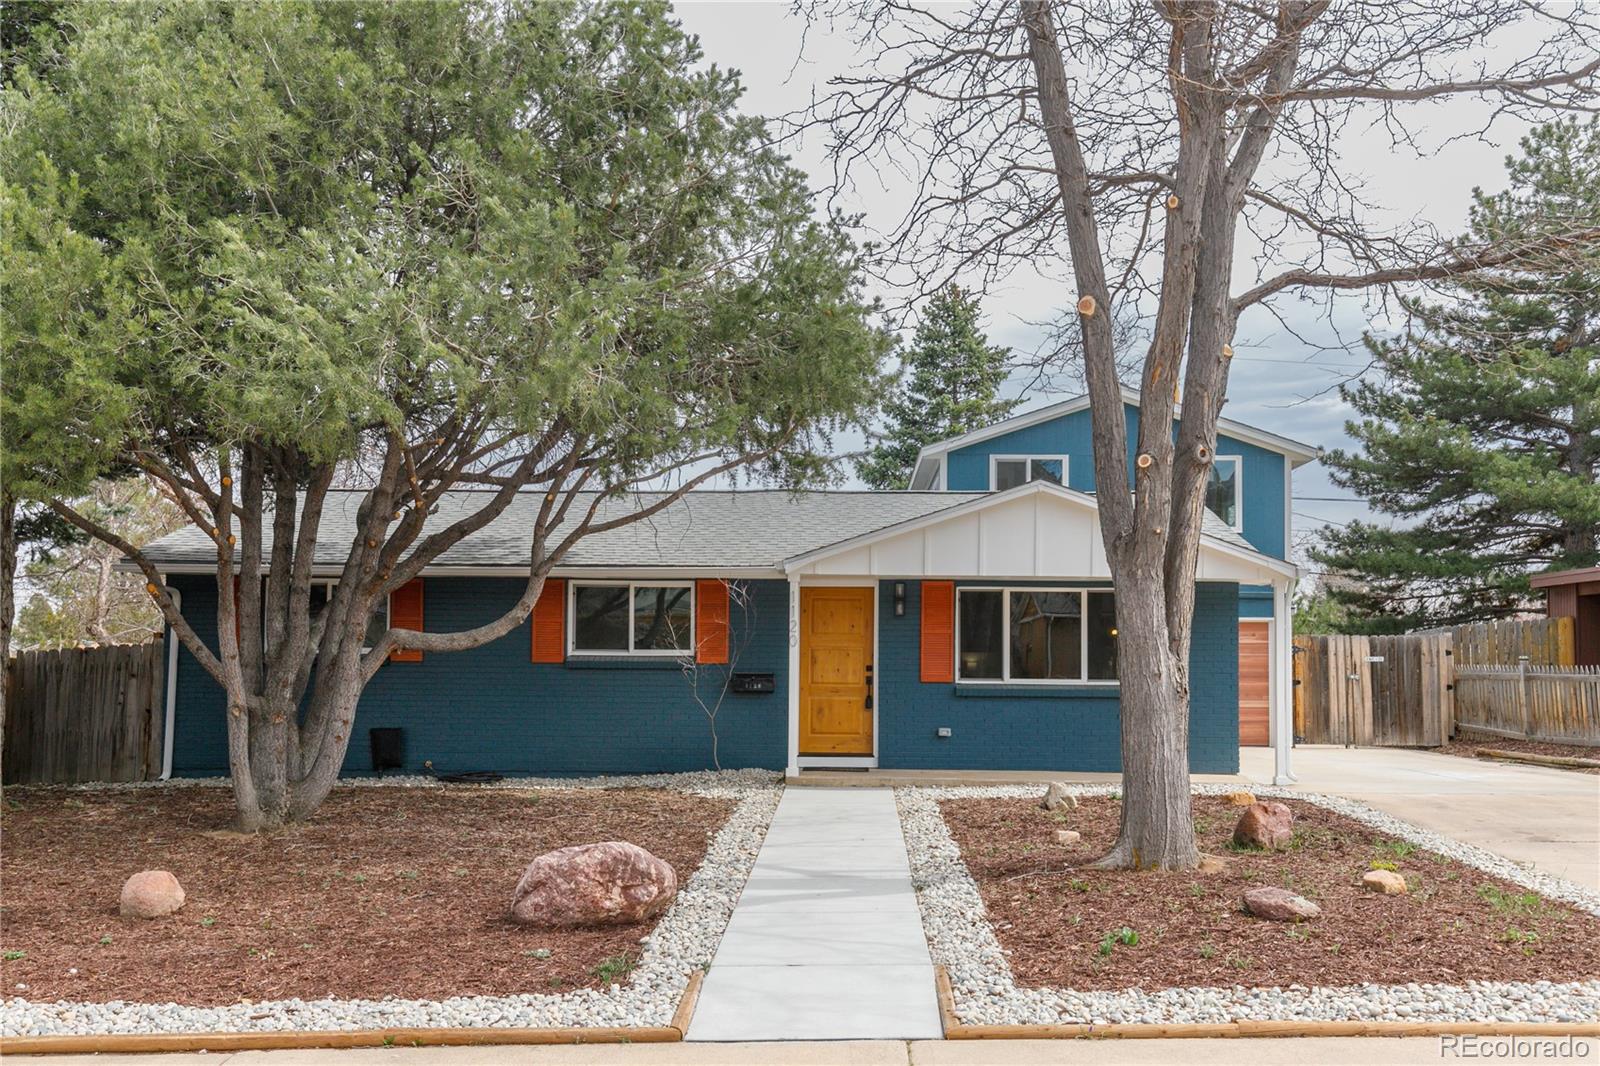
Active
$1,188,000
4
bds
|
3
ba
|
1,546
sqft
|
built
1962
1120 Hartford Dr, Boulder, CO 80305
$-4,308
Cash flow
-18.9%
Cash-on-Cash Return
1.9%
Cap rate
0.3%
Rent to Value Ratio
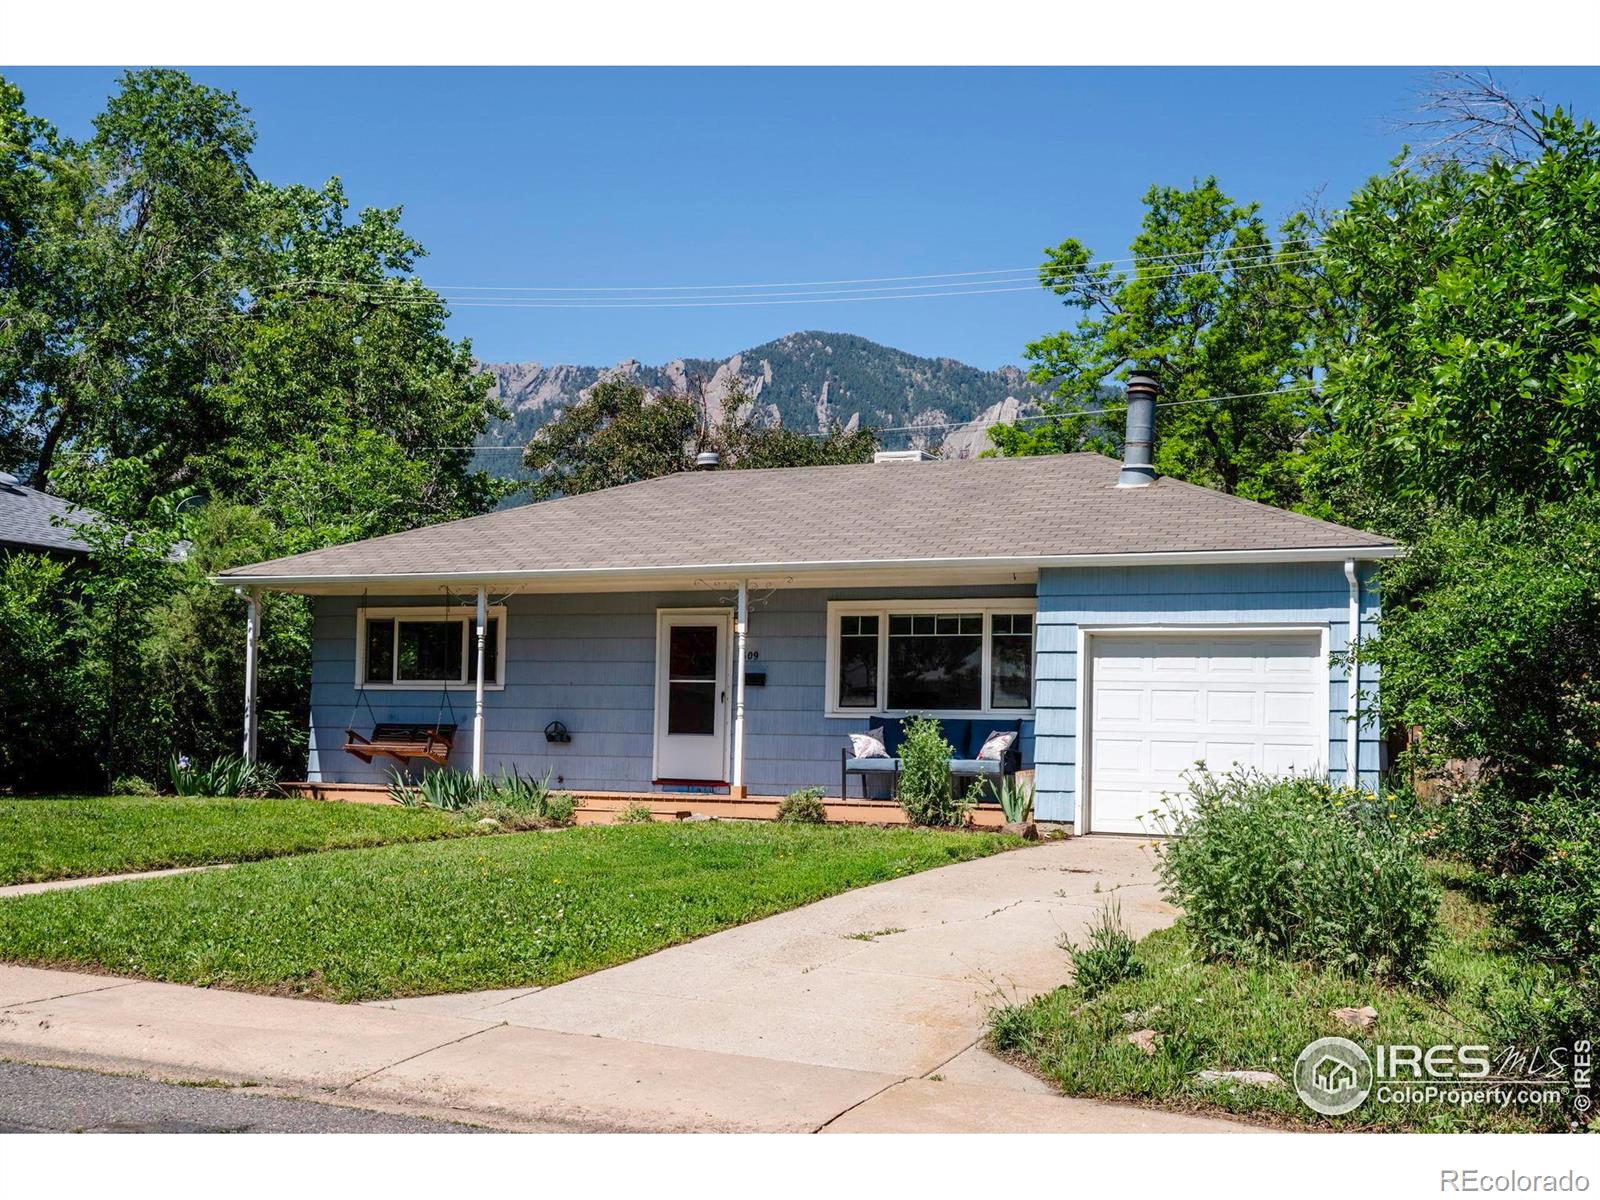
Active
$699,000
2
bds
|
1
ba
|
913
sqft
|
built
1954
309 27th St, Boulder, CO 80305
$-2,074
Cash flow
-15.5%
Cash-on-Cash Return
2.7%
Cap rate
0.4%
Rent to Value Ratio
Active
$635,500
4
bds
|
3
ba
|
2,404
sqft
|
built
1983
2871 Humboldt Cir, Longmont, CO 80503
$-1,712
Cash flow
-14.1%
Cash-on-Cash Return
3.1%
Cap rate
0.4%
Rent to Value Ratio
Active
$400,000
2
bds
|
1
ba
|
747
sqft
|
built
1983
5920 Gunbarrel Ave, Boulder, CO 80301
$-1,309
Cash flow
-17.1%
Cash-on-Cash Return
2.4%
Cap rate
0.5%
Rent to Value Ratio
Active
$1,249,900
5
bds
|
4
ba
|
3,661
sqft
|
built
2009
1362 Golden Eagle Way, Louisville, CO 80027
$-3,768
Cash flow
-15.7%
Cash-on-Cash Return
2.7%
Cap rate
0.4%
Rent to Value Ratio
Active
$2,450,000
4
bds
|
4
ba
|
2,804
sqft
|
built
1984
950 Quince Ave, Boulder, CO 80304
$-8,875
Cash flow
-18.9%
Cash-on-Cash Return
1.9%
Cap rate
0.3%
Rent to Value Ratio
Active
$263,195
2
bds
|
2
ba
|
896
sqft
|
built
2019
1199 Hummingbird Cir, Longmont, CO 80501
$-333
Cash flow
-6.6%
Cash-on-Cash Return
4.8%
Cap rate
0.7%
Rent to Value Ratio
Active
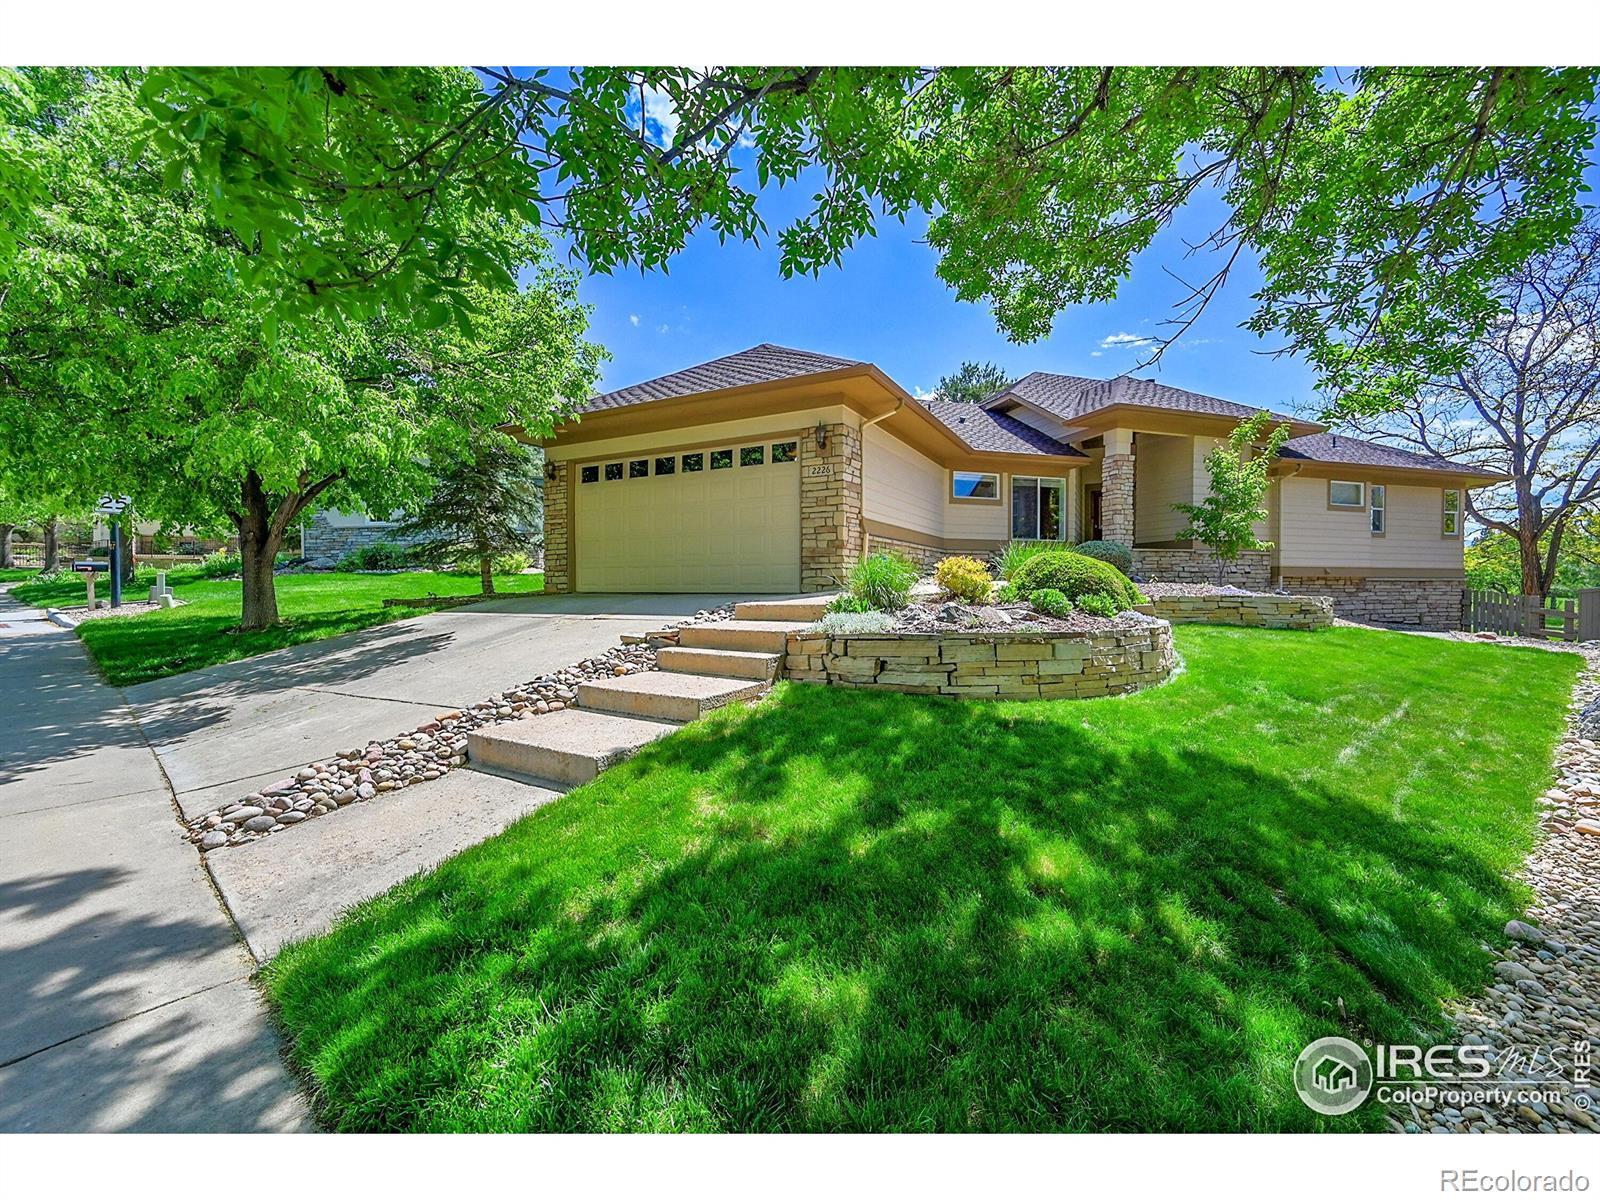
$1,195,000
3
bds
|
3
ba
|
2,868
sqft
|
built
1997
2226 Eagles Nest Dr, Lafayette, CO 80026
$-4,419
Cash flow
-19.3%
Cash-on-Cash Return
1.8%
Cap rate
0.3%
Rent to Value Ratio
Active
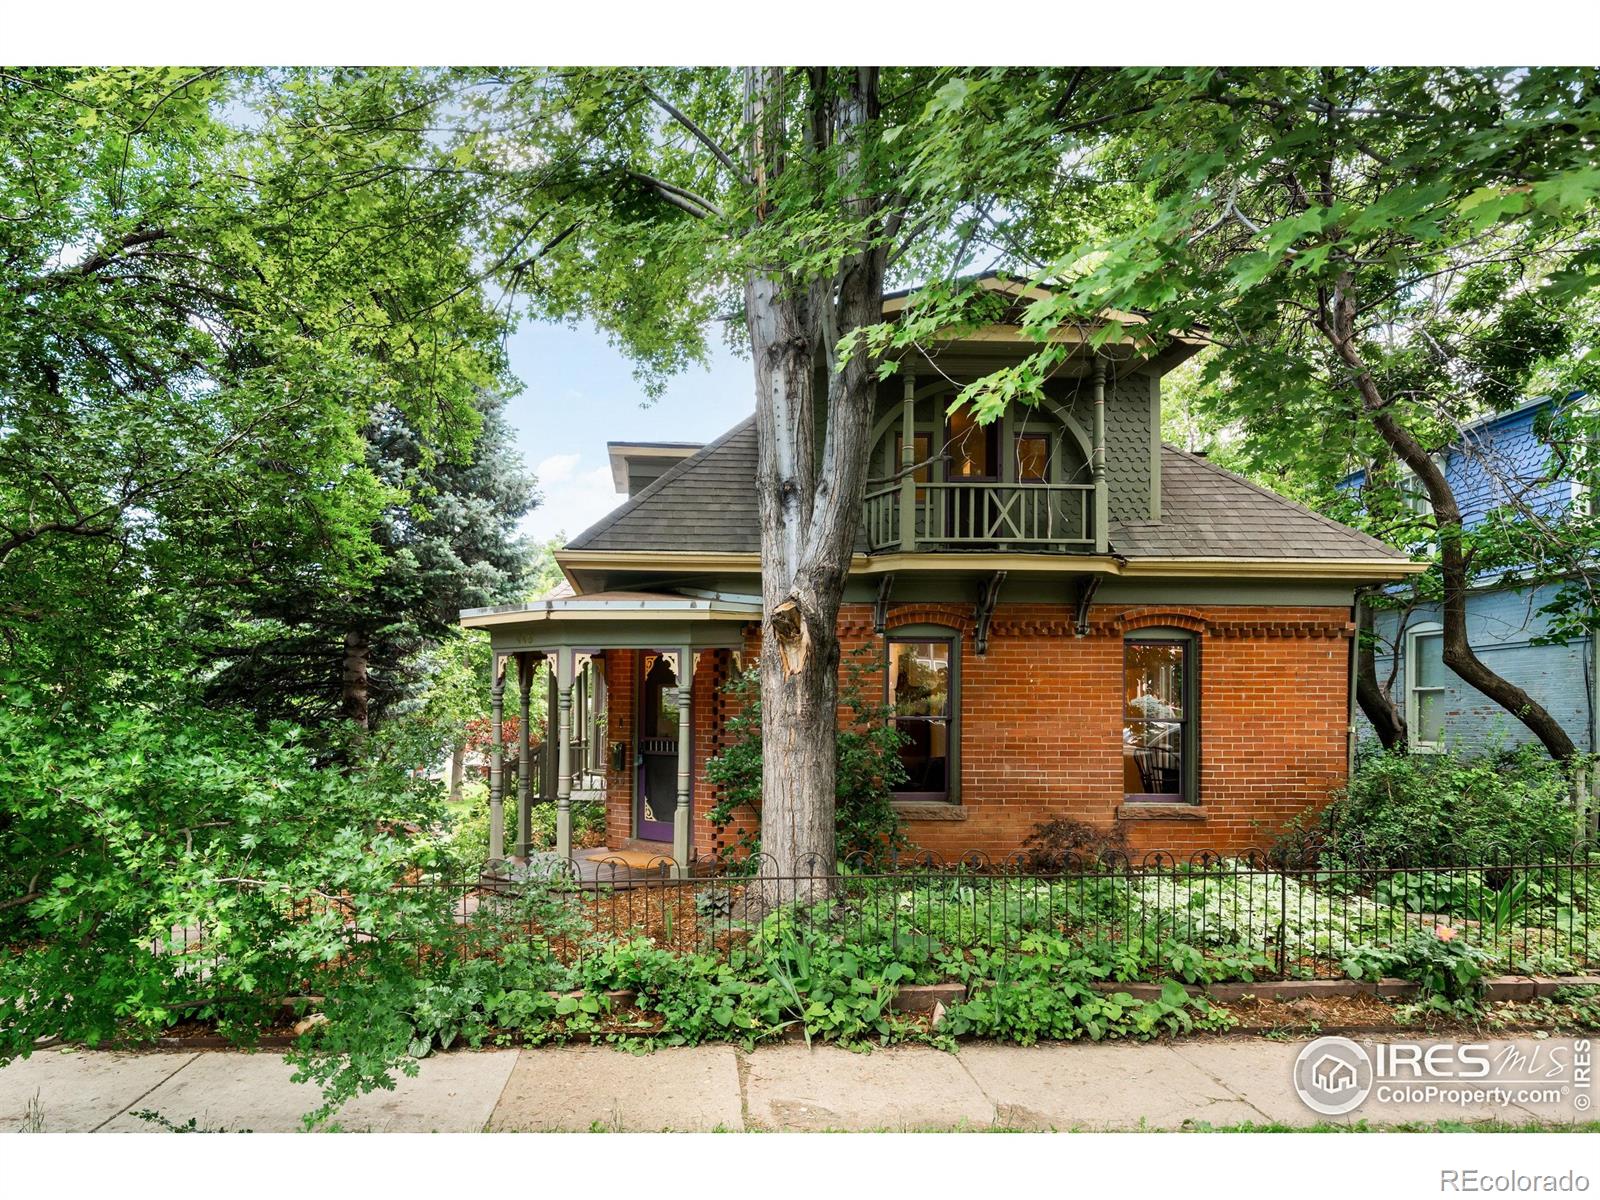
$1,800,000
2
bds
|
3
ba
|
1,788
sqft
|
built
1915
446 Pearl St, Boulder, CO 80302
$-6,561
Cash flow
-19.0%
Cash-on-Cash Return
1.9%
Cap rate
0.3%
Rent to Value Ratio
Active
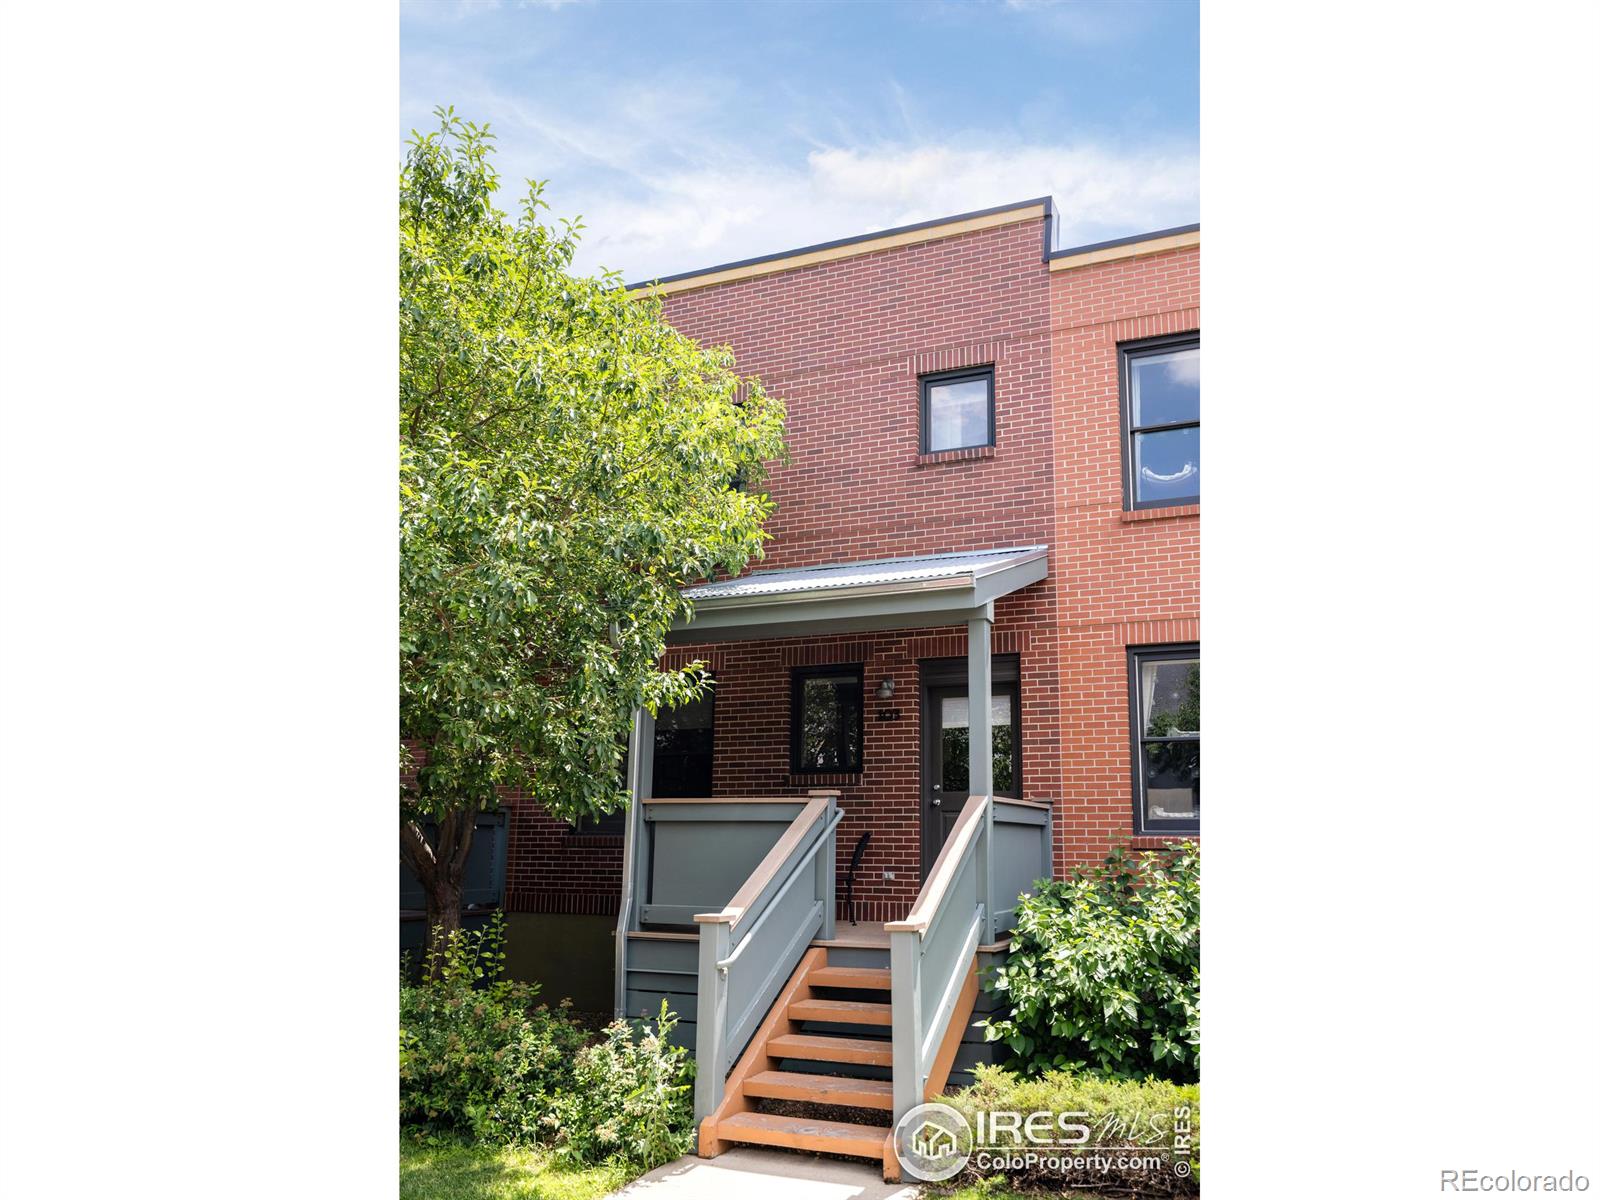
$785,000
2
bds
|
3
ba
|
1,301
sqft
|
built
2005
3210 Iron Forge Pl, Boulder, CO 80301
$-2,998
Cash flow
-19.9%
Cash-on-Cash Return
1.7%
Cap rate
0.4%
Rent to Value Ratio
Active
$850,000
4
bds
|
2
ba
|
1,590
sqft
|
built
1984
202 Hoover Ave, Louisville, CO 80027
$-2,336
Cash flow
-14.3%
Cash-on-Cash Return
3.0%
Cap rate
0.4%
Rent to Value Ratio
Active
$859,999
3
bds
|
3
ba
|
2,078
sqft
|
built
2020
438 Meridian Ln, Superior, CO 80027
$-2,547
Cash flow
-15.5%
Cash-on-Cash Return
2.7%
Cap rate
0.5%
Rent to Value Ratio
Active
$739,000
3
bds
|
4
ba
|
2,171
sqft
|
built
1993
1485 Stoneham St, Superior, CO 80027
$-1,813
Cash flow
-12.8%
Cash-on-Cash Return
3.3%
Cap rate
0.5%
Rent to Value Ratio
Active
$945,000
3
bds
|
3
ba
|
2,836
sqft
|
built
1985
656 Jasper Dr, Lyons, CO 80540
$-2,847
Cash flow
-15.7%
Cash-on-Cash Return
2.7%
Cap rate
0.4%
Rent to Value Ratio
Active
$238,500
2
bds
|
2
ba
|
819
sqft
|
built
1976
625 Manhattan Pl, Boulder, CO 80303
$-301
Cash flow
-6.6%
Cash-on-Cash Return
4.8%
Cap rate
0.9%
Rent to Value Ratio
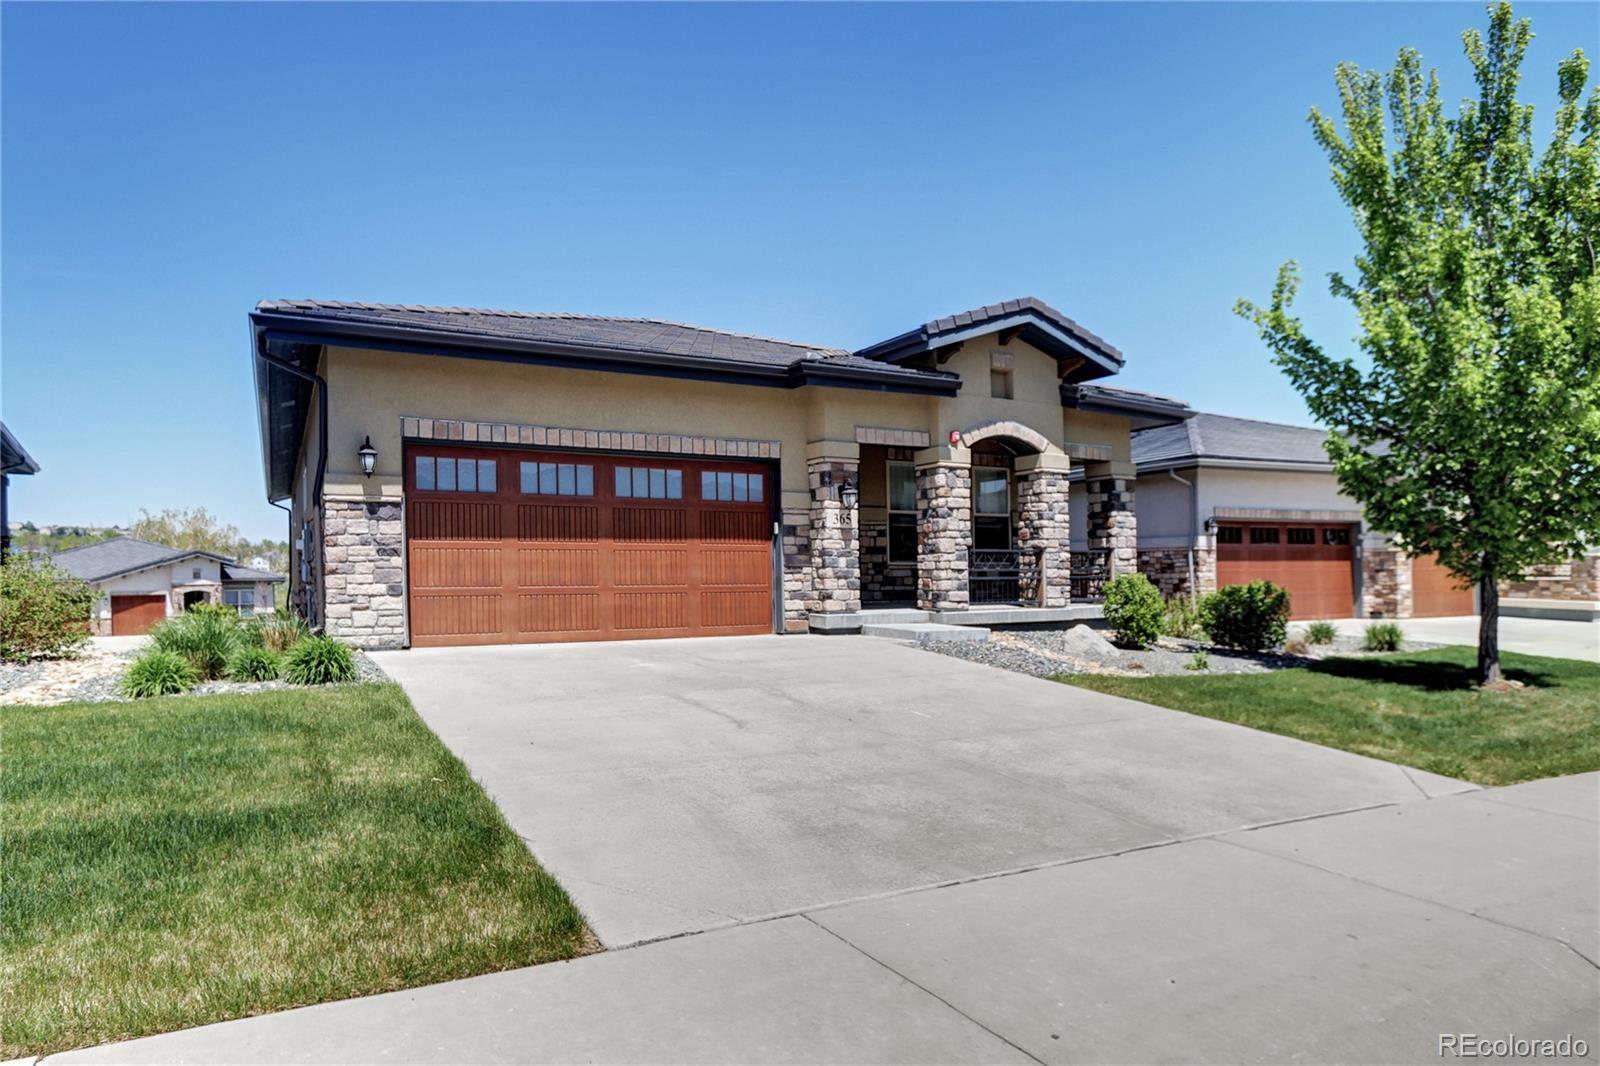
Active
$1,350,000
4
bds
|
4
ba
|
3,337
sqft
|
built
2018
365 Casalon Pl, Superior, CO 80027
$-4,730
Cash flow
-18.3%
Cash-on-Cash Return
2.1%
Cap rate
0.4%
Rent to Value Ratio
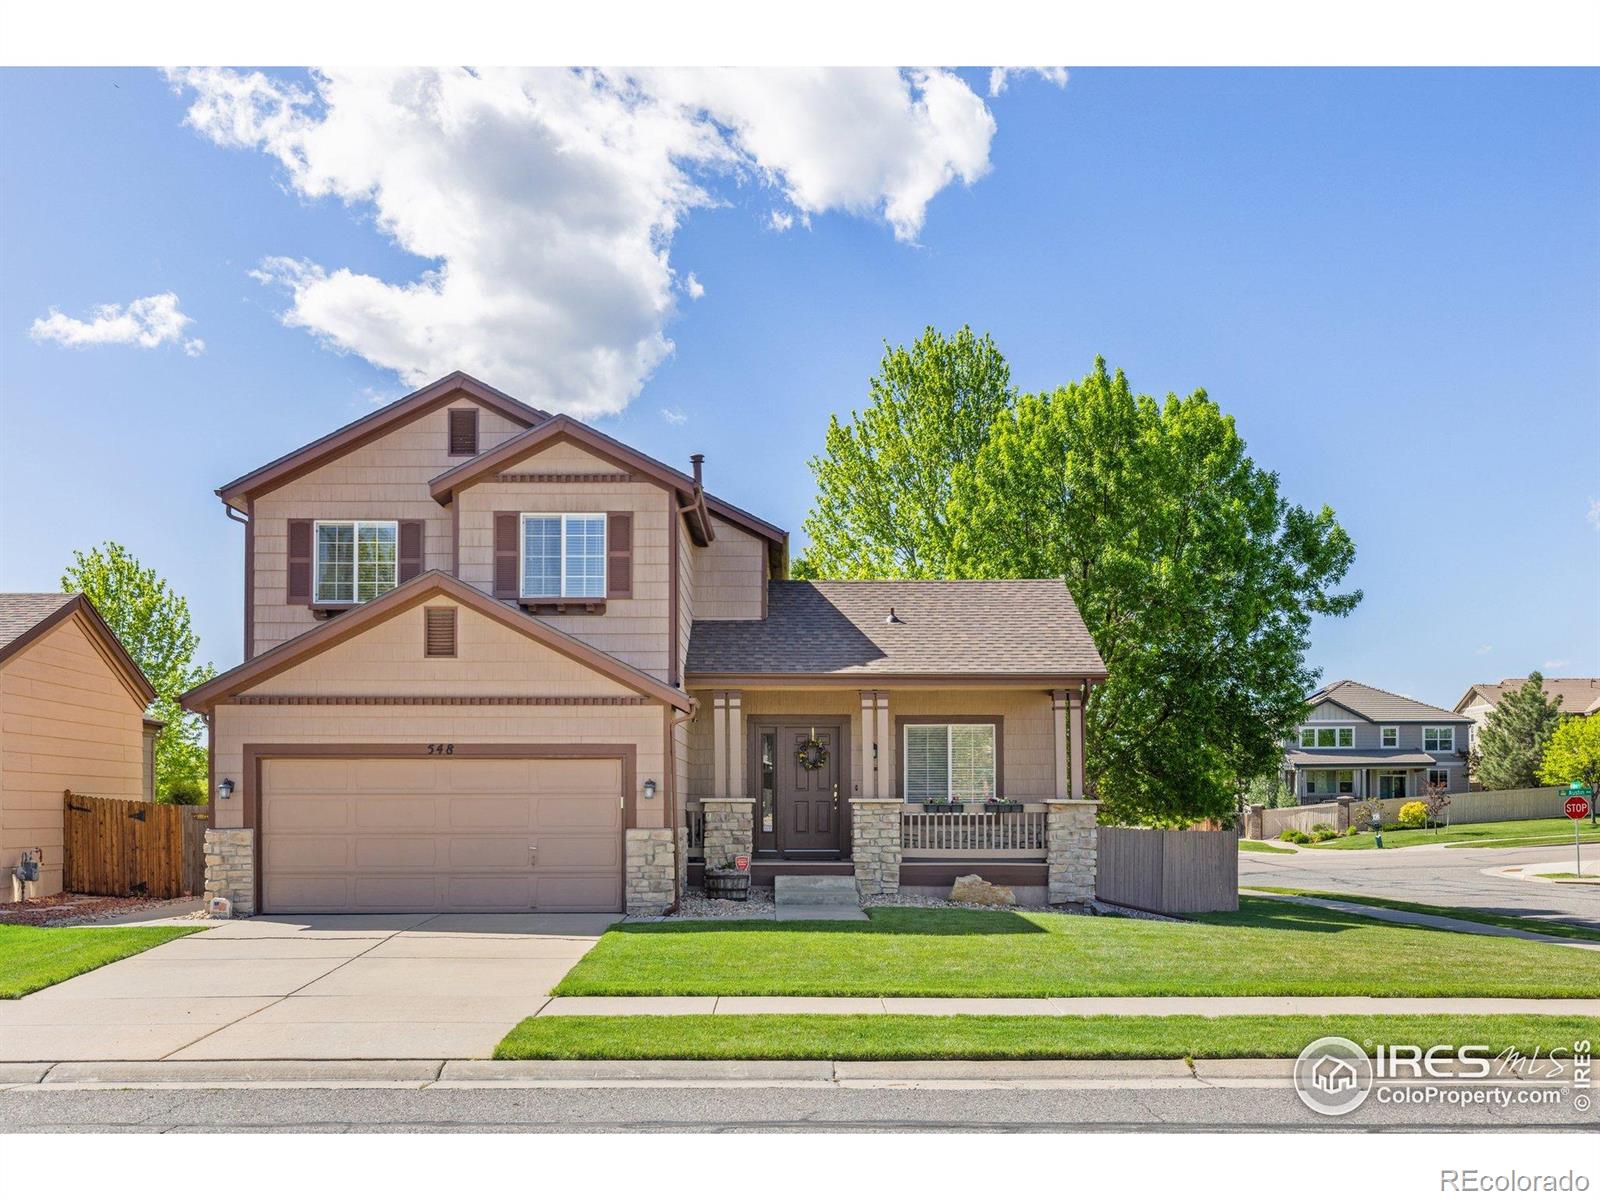
Active
$593,000
3
bds
|
3
ba
|
1,494
sqft
|
built
2004
548 Mathews Cir, Erie, CO 80516
$-1,502
Cash flow
-13.2%
Cash-on-Cash Return
3.2%
Cap rate
0.5%
Rent to Value Ratio

Active
$940,000
2
bds
|
3
ba
|
1,512
sqft
|
built
1979
1709 Alpine Ave, Boulder, CO 80304
$-3,223
Cash flow
-17.9%
Cash-on-Cash Return
2.2%
Cap rate
0.4%
Rent to Value Ratio
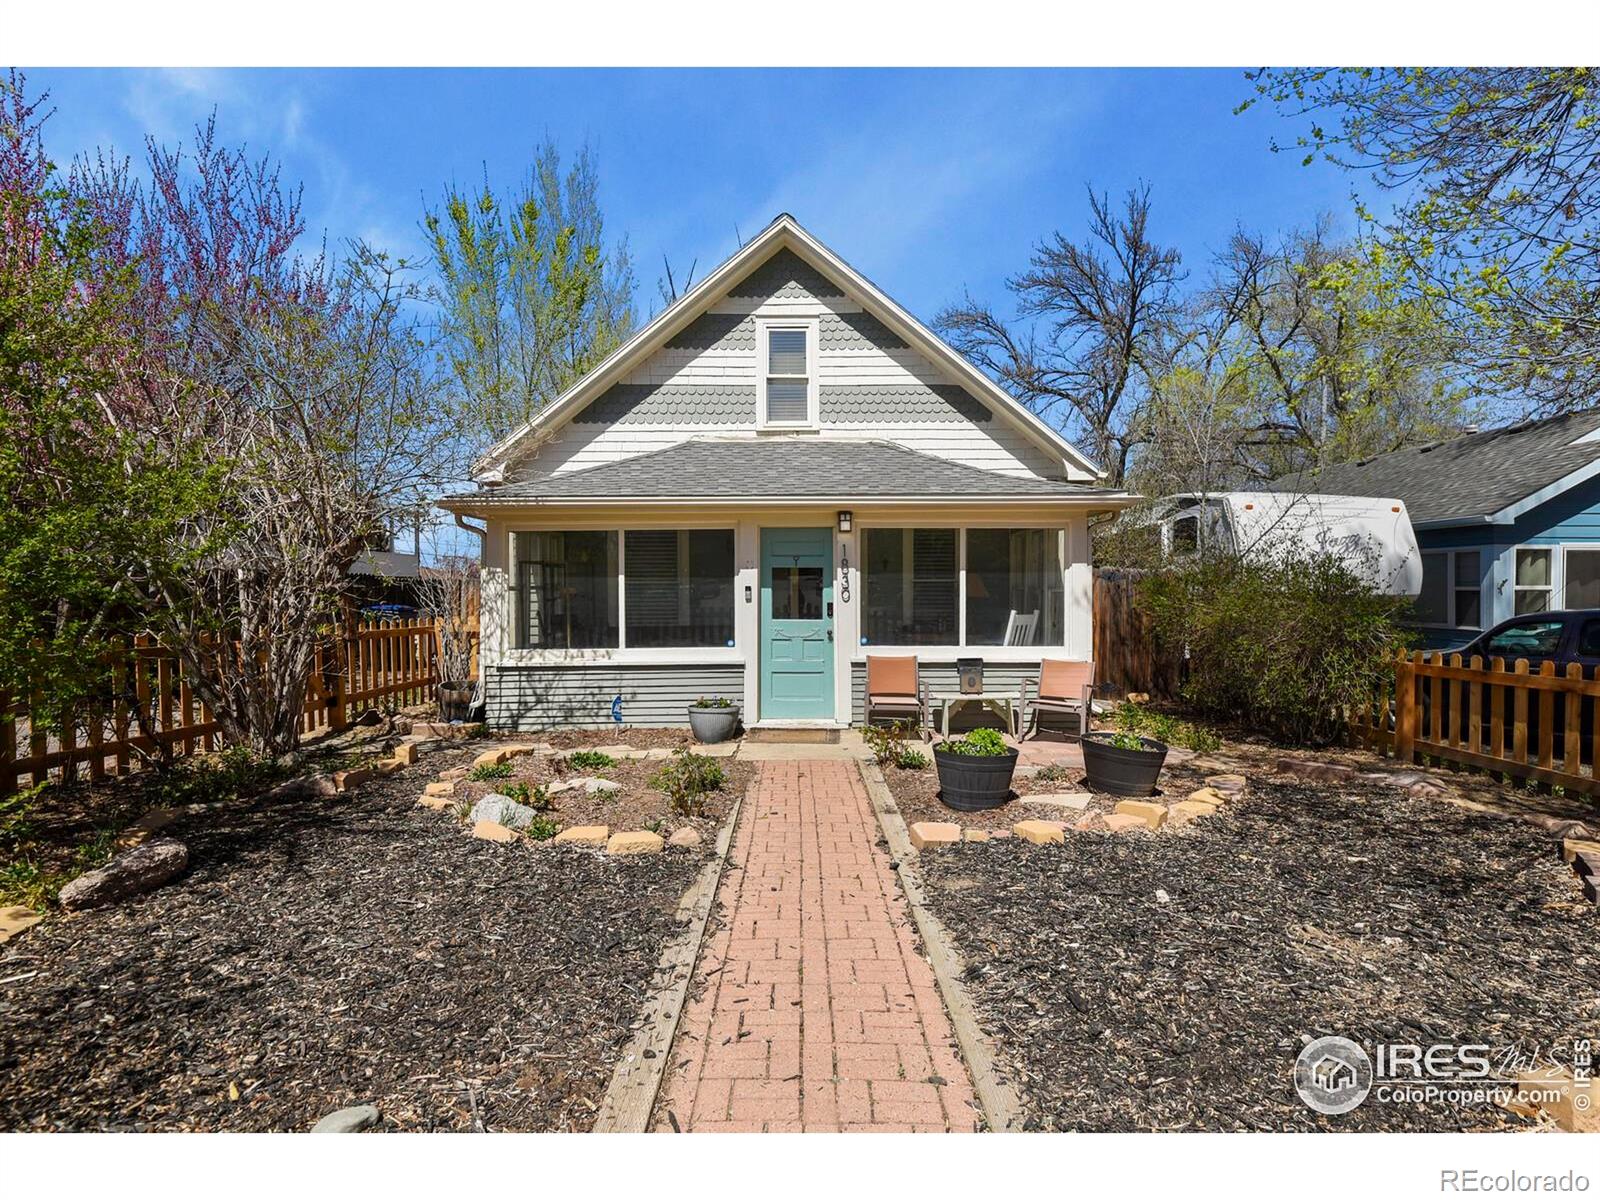
Active
$540,000
3
bds
|
2
ba
|
1,231
sqft
|
built
1900
1830 9th Ave, Longmont, CO 80501
$-1,341
Cash flow
-13.0%
Cash-on-Cash Return
3.3%
Cap rate
0.5%
Rent to Value Ratio
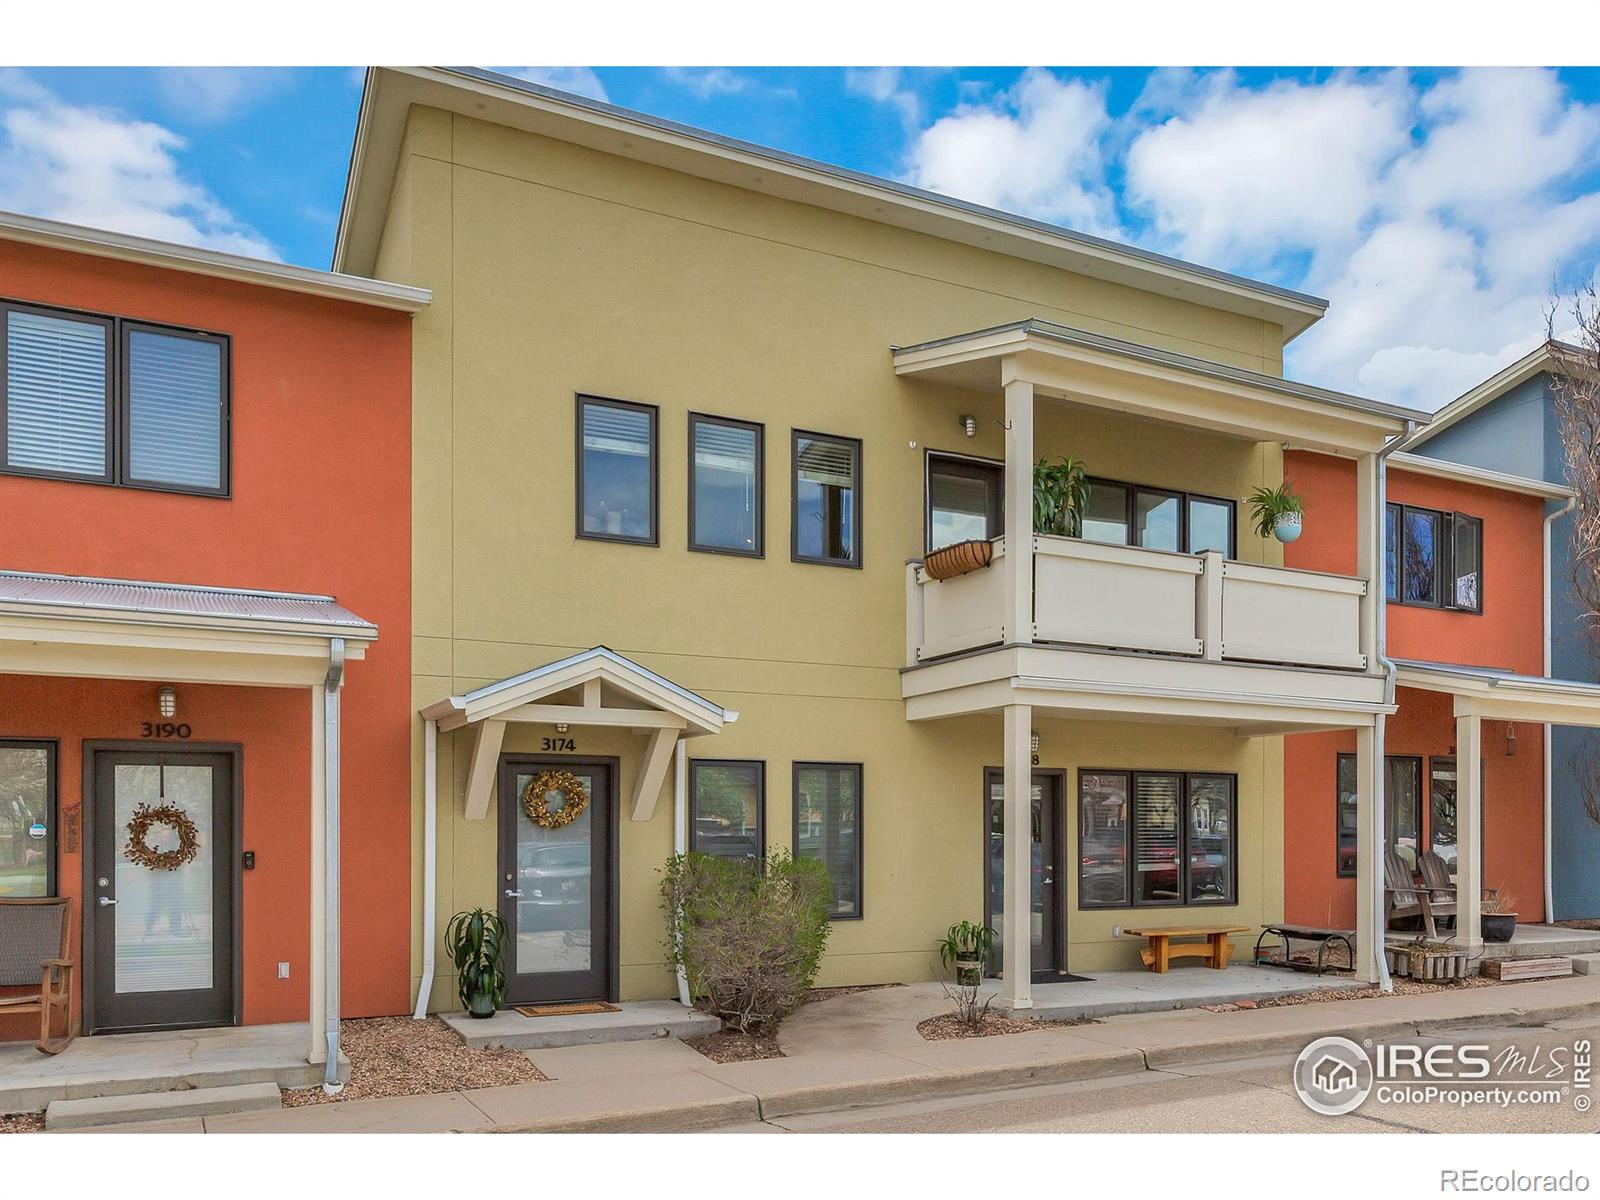
Active
$499,900
1
bds
|
1
ba
|
734
sqft
|
built
2003
3174 Foundry Pl, Boulder, CO 80301
$-1,652
Cash flow
-17.2%
Cash-on-Cash Return
2.3%
Cap rate
0.4%
Rent to Value Ratio
Active
$799,000
3
bds
|
4
ba
|
1,956
sqft
|
built
2019
522 Martin St, Longmont, CO 80501
$-3,540
Cash flow
-23.1%
Cash-on-Cash Return
1.0%
Cap rate
0.2%
Rent to Value Ratio
Active
$575,000
1
bds
|
1
ba
|
883
sqft
|
built
2006
3401 Arapahoe Ave, Boulder, CO 80303
$-1,790
Cash flow
-16.2%
Cash-on-Cash Return
2.5%
Cap rate
0.5%
Rent to Value Ratio
Active
$2,595,000
3
bds
|
2
ba
|
2,625
sqft
|
built
1917
2935 19th St, Boulder, CO 80304
$-9,527
Cash flow
-19.2%
Cash-on-Cash Return
1.9%
Cap rate
0.3%
Rent to Value Ratio
Active
$3,000,000
4
bds
|
3
ba
|
3,496
sqft
|
built
1977
3021 N Lakeridge Trl, Boulder, CO 80302
$-13,415
Cash flow
-23.3%
Cash-on-Cash Return
0.9%
Cap rate
0.2%
Rent to Value Ratio
Active
$950,000
3
bds
|
3
ba
|
2,661
sqft
|
built
2005
1513 Cannon Mountain Dr, Longmont, CO 80503
$-3,032
Cash flow
-16.7%
Cash-on-Cash Return
2.5%
Cap rate
0.4%
Rent to Value Ratio
Active
$799,000
1
bds
|
2
ba
|
800
sqft
|
built
2014
1707 Walnut St, Boulder, CO 80302
$-2,867
Cash flow
-18.7%
Cash-on-Cash Return
2.0%
Cap rate
0.3%
Rent to Value Ratio
Active
$519,000
3
bds
|
1
ba
|
1,428
sqft
|
built
1955
6 Sunset Cir, Longmont, CO 80501
$-1,158
Cash flow
-11.6%
Cash-on-Cash Return
3.6%
Cap rate
0.5%
Rent to Value Ratio
Active
$4,299,500
4
bds
|
4
ba
|
7,744
sqft
|
built
1972
7155 Rustic Trl, Boulder, CO 80301
$-18,997
Cash flow
-23.1%
Cash-on-Cash Return
1.0%
Cap rate
0.2%
Rent to Value Ratio
Active
$559,500
2
bds
|
2
ba
|
900
sqft
|
built
1910
320 Baker St, Longmont, CO 80501
$-1,765
Cash flow
-16.5%
Cash-on-Cash Return
2.5%
Cap rate
0.4%
Rent to Value Ratio
Active
$538,000
2
bds
|
2
ba
|
1,292
sqft
|
built
2005
2018 Ionosphere St, Longmont, CO 80504
$-1,816
Cash flow
-17.6%
Cash-on-Cash Return
2.2%
Cap rate
0.5%
Rent to Value Ratio
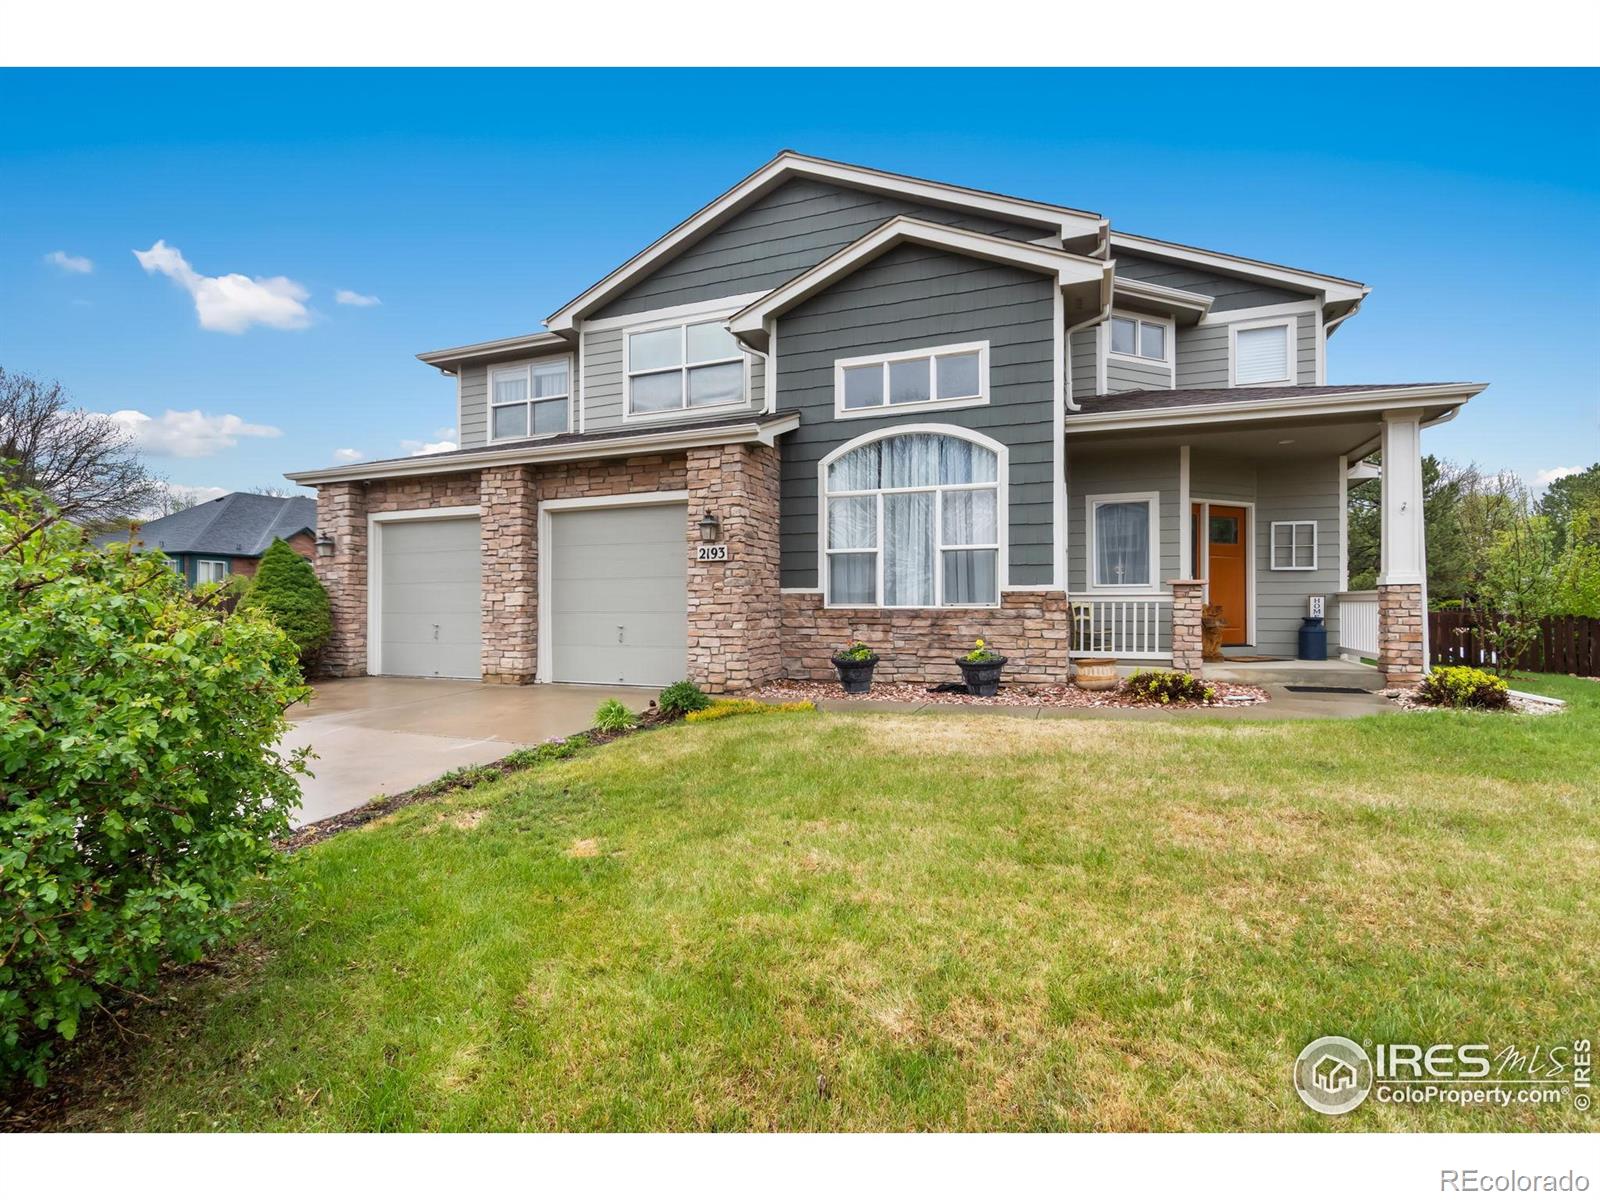
Active
$819,500
4
bds
|
5
ba
|
3,210
sqft
|
built
1999
2193 Sand Dollar Cir, Longmont, CO 80503
$-2,410
Cash flow
-15.3%
Cash-on-Cash Return
2.8%
Cap rate
0.4%
Rent to Value Ratio
Active
$449,900
3
bds
|
3
ba
|
2,057
sqft
|
built
1980
1222 Atwood St, Longmont, CO 80501
$-1,177
Cash flow
-13.6%
Cash-on-Cash Return
3.1%
Cap rate
0.6%
Rent to Value Ratio
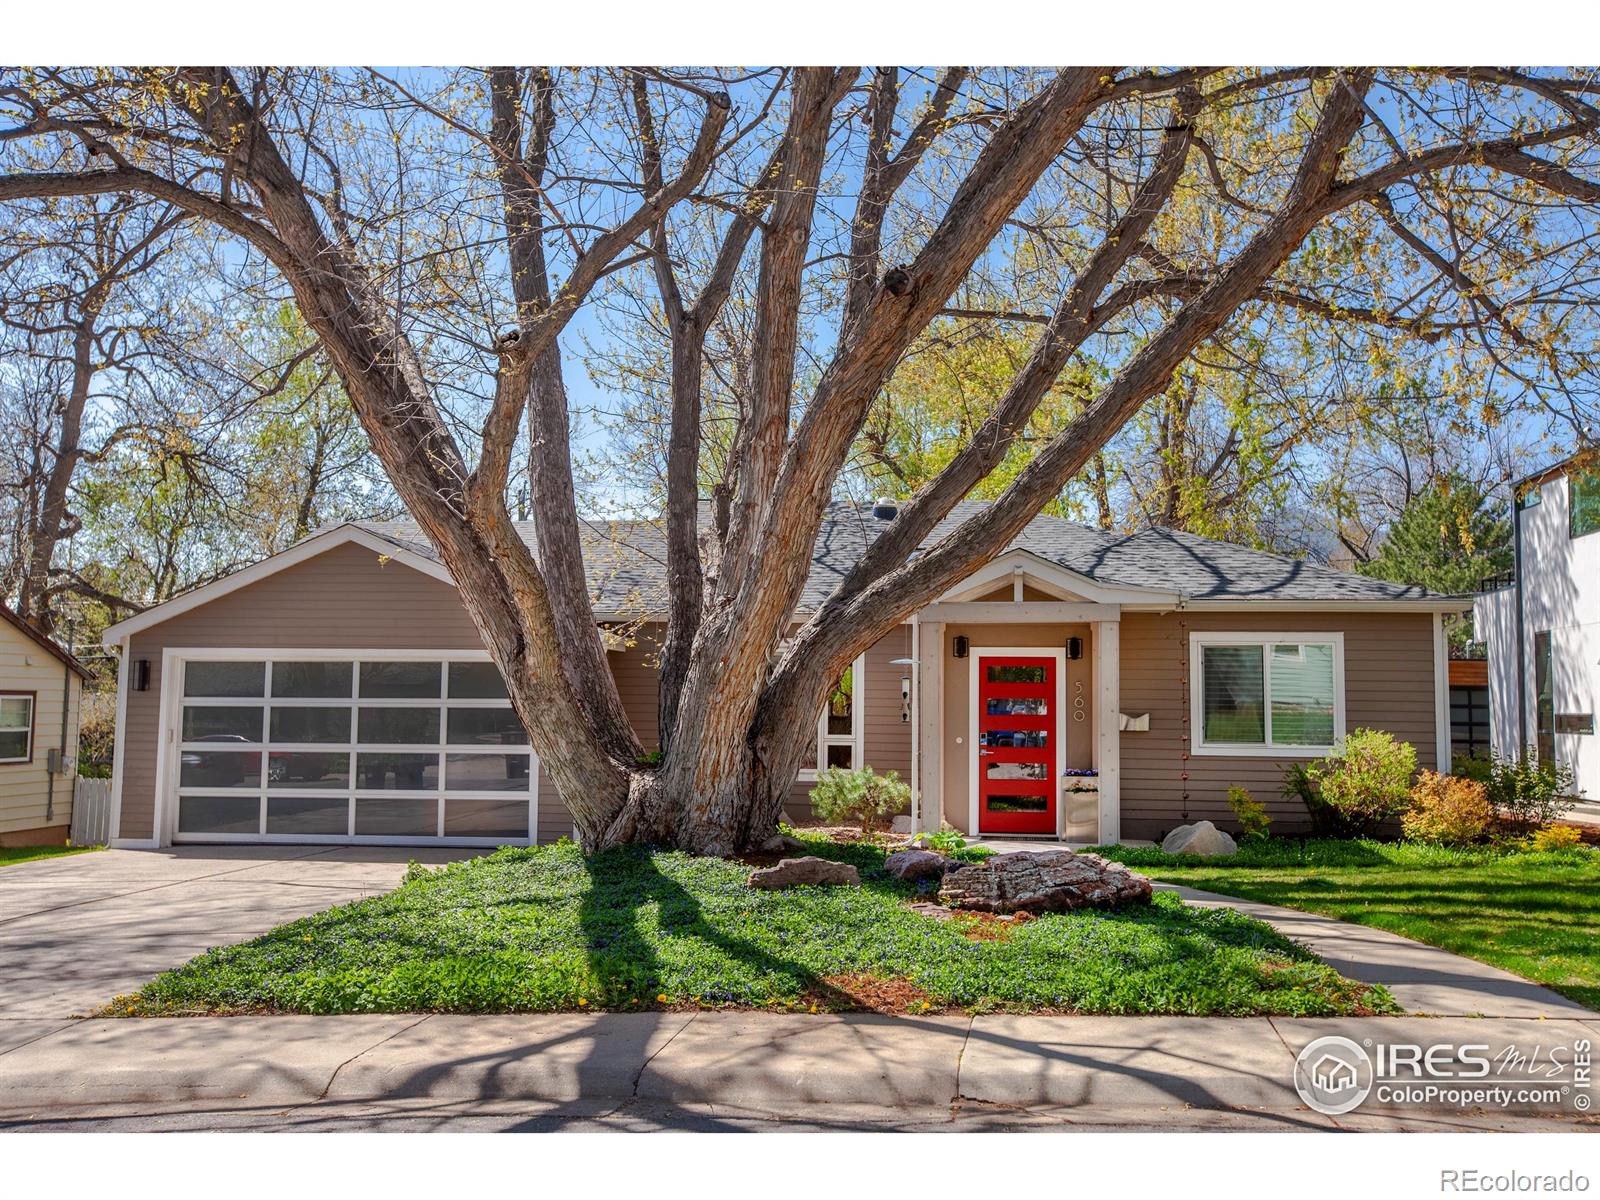
Active
$2,250,000
3
bds
|
3
ba
|
2,038
sqft
|
built
1955
560 Iris Ave, Boulder, CO 80304
$-8,967
Cash flow
-20.8%
Cash-on-Cash Return
1.5%
Cap rate
0.2%
Rent to Value Ratio
Active
$399,000
2
bds
|
3
ba
|
1,200
sqft
|
built
2000
930 Button Rock Dr, Longmont, CO 80504
$-1,025
Cash flow
-13.4%
Cash-on-Cash Return
3.2%
Cap rate
0.6%
Rent to Value Ratio
Active under contract
$615,000
2
bds
|
2
ba
|
1,228
sqft
|
built
1985
2938 Kalmia Ave, Boulder, CO 80301
$-1,919
Cash flow
-16.3%
Cash-on-Cash Return
2.5%
Cap rate
0.5%
Rent to Value Ratio
Active
$440,000
2
bds
|
2
ba
|
968
sqft
|
built
1978
3790 Iris Ave, Boulder, CO 80301
$-1,508
Cash flow
-17.9%
Cash-on-Cash Return
2.2%
Cap rate
0.5%
Rent to Value Ratio
Active
$3,500,000
5
bds
|
1
ba
|
1,914
sqft
|
built
1952
2003 Balsam Dr, Boulder, CO 80304
$-15,863
Cash flow
-23.6%
Cash-on-Cash Return
0.8%
Cap rate
0.1%
Rent to Value Ratio
Active
$325,000
1
bds
|
1
ba
|
400
sqft
|
built
1983
2711 Mapleton Ave, Boulder, CO 80304
$-1,132
Cash flow
-18.2%
Cash-on-Cash Return
2.1%
Cap rate
0.5%
Rent to Value Ratio
Active
$876,000
3
bds
|
3
ba
|
1,624
sqft
|
built
1994
310 Wendelyn Way, Boulder, CO 80302
$-2,845
Cash flow
-16.9%
Cash-on-Cash Return
2.4%
Cap rate
0.4%
Rent to Value Ratio
Active
$1,895,000
4
bds
|
4
ba
|
4,687
sqft
|
built
1998
7947 Ute Hwy, Longmont, CO 80503
$-6,804
Cash flow
-18.7%
Cash-on-Cash Return
2.0%
Cap rate
0.3%
Rent to Value Ratio