Boulder County Investment Properties for Sale
Browse homes for sale and investment properties in Boulder County. Refine your search by price, property type, or more.
Best cash flowing properties in Boulder County
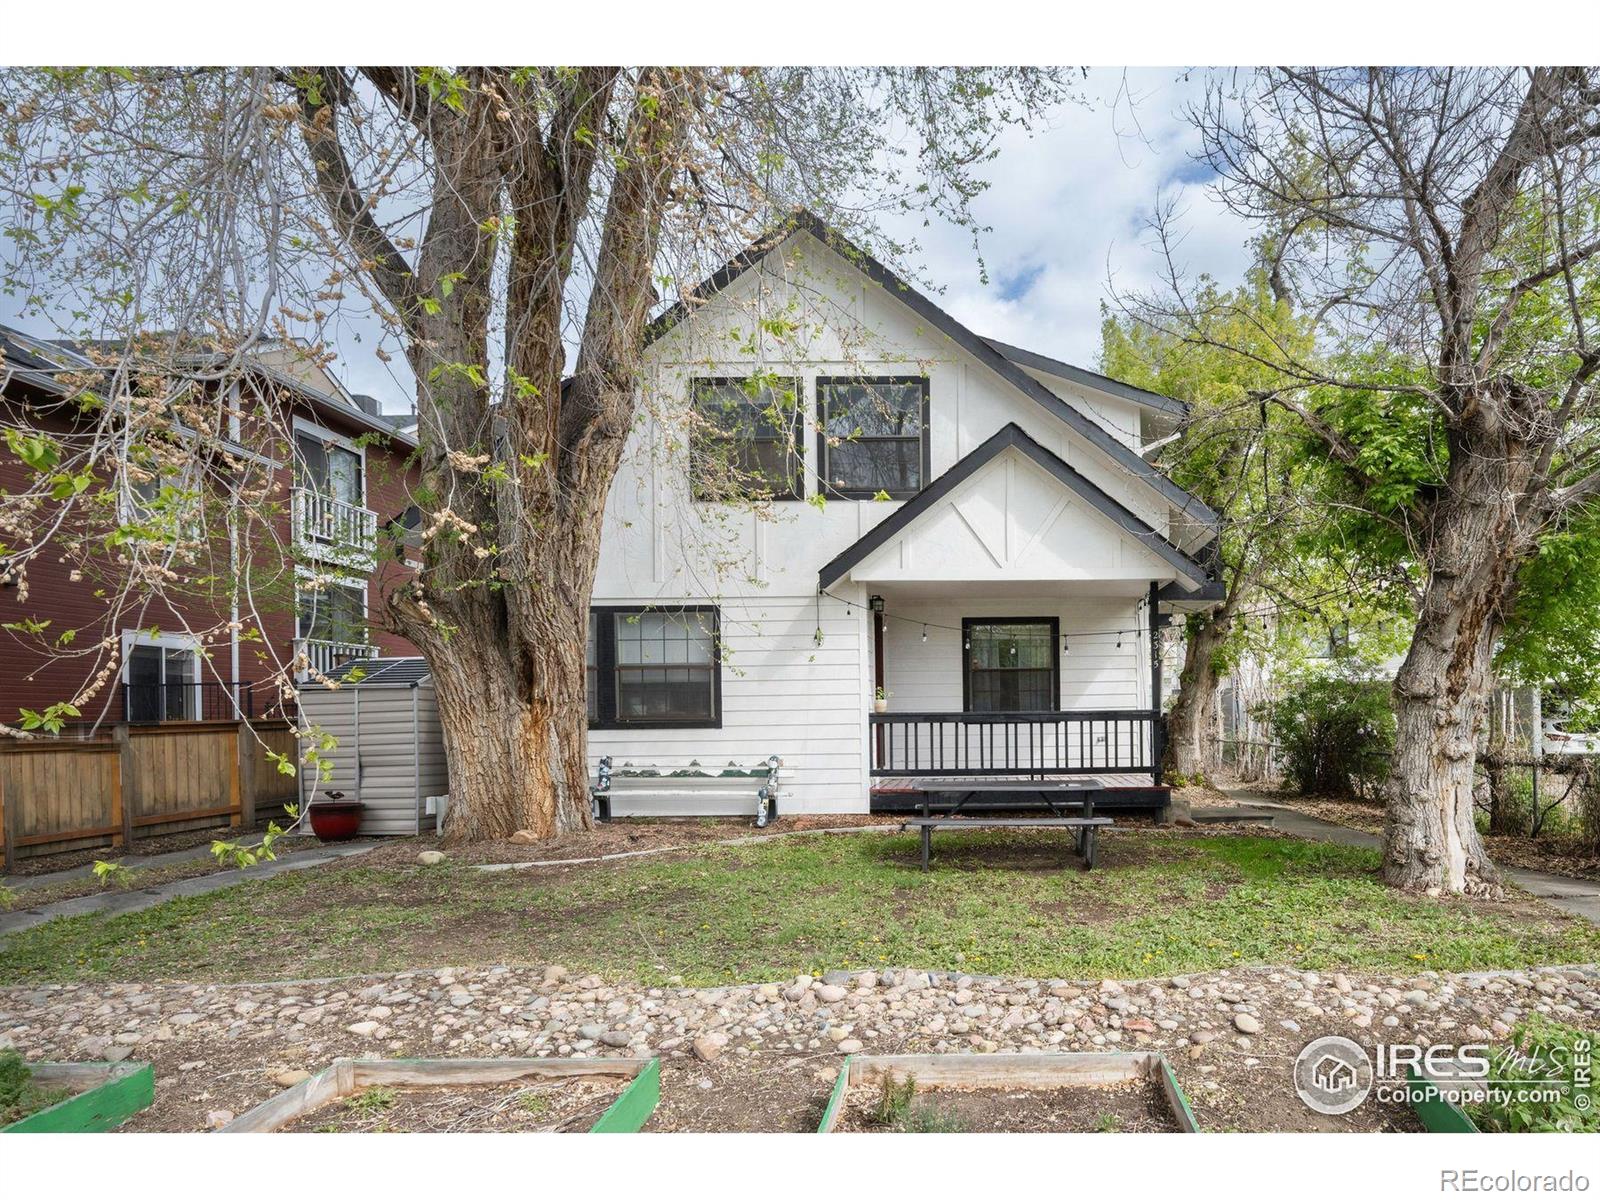
Active
$210,000
2
bds
|
2
ba
|
851
sqft
|
built
1975
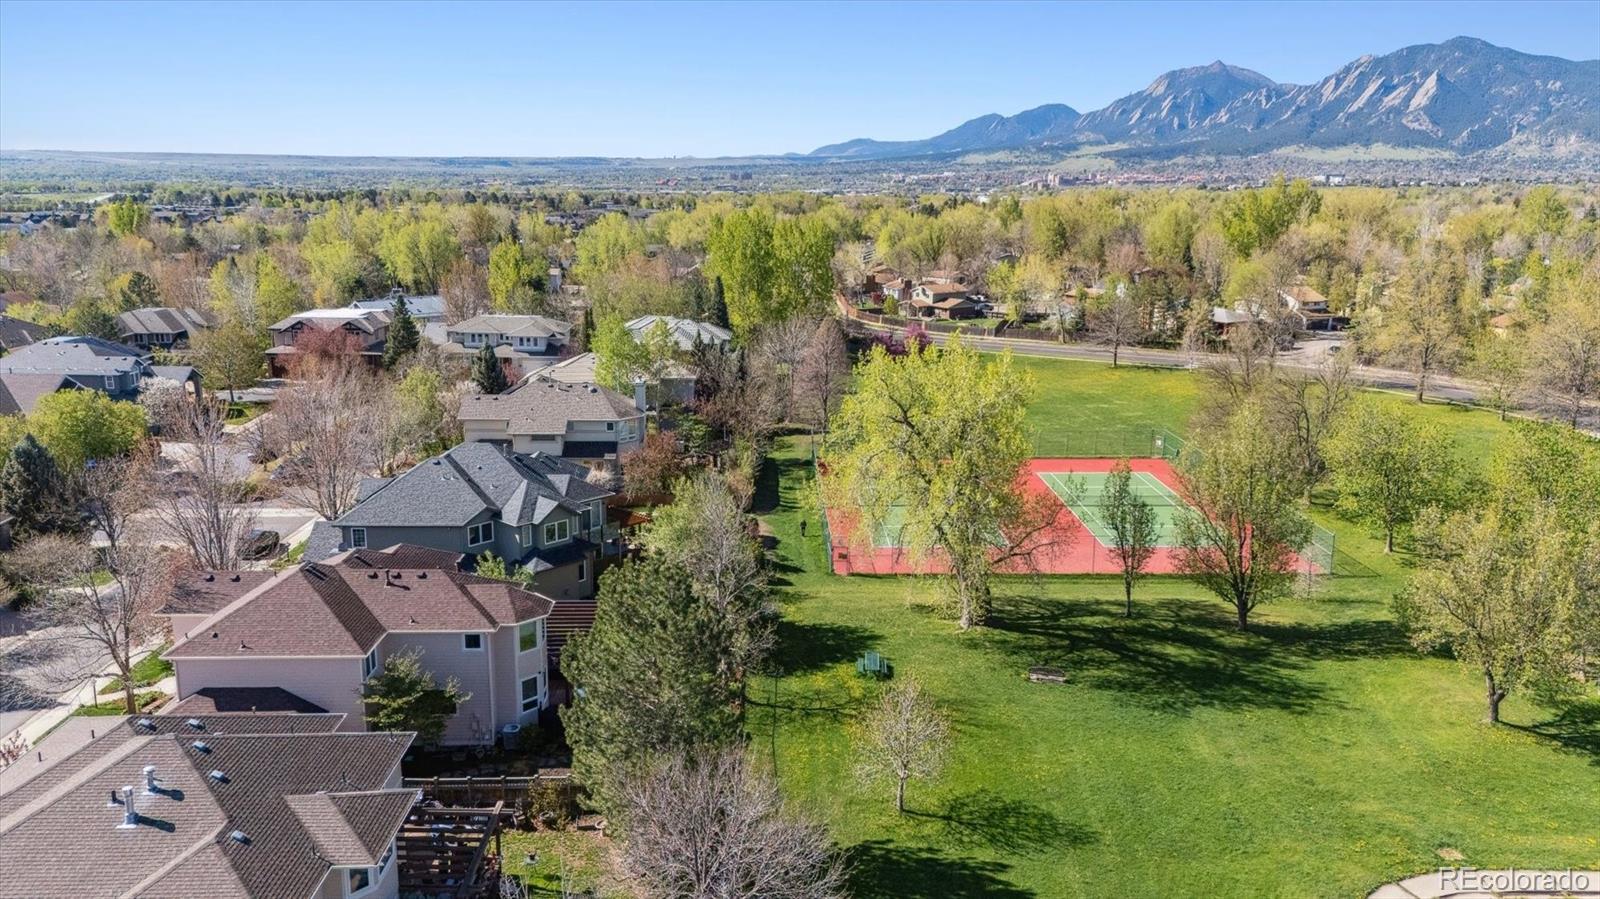
350 Arapahoe Ave, Boulder, CO 80302
$-118
Cash flow
-2.9%
Cash-on-Cash Return
5.0%
Cap rate
1.0%
Rent to Value Ratio
Active
$327,500
2
bds
|
2
ba
|
931
sqft
|
built
1969
3250 Oneal Cir, Boulder, CO 80301
$-568
Cash flow
-9.0%
Cash-on-Cash Return
3.6%
Cap rate
0.7%
Rent to Value Ratio
1,203 out of 1,343 properties for sale in Boulder County
Limited Results Shown
Create a free account, or log in to reveal all property listings and enjoy the complete experience.
Active
$509,500
2
bds
|
2
ba
|
1,286
sqft
|
built
1997
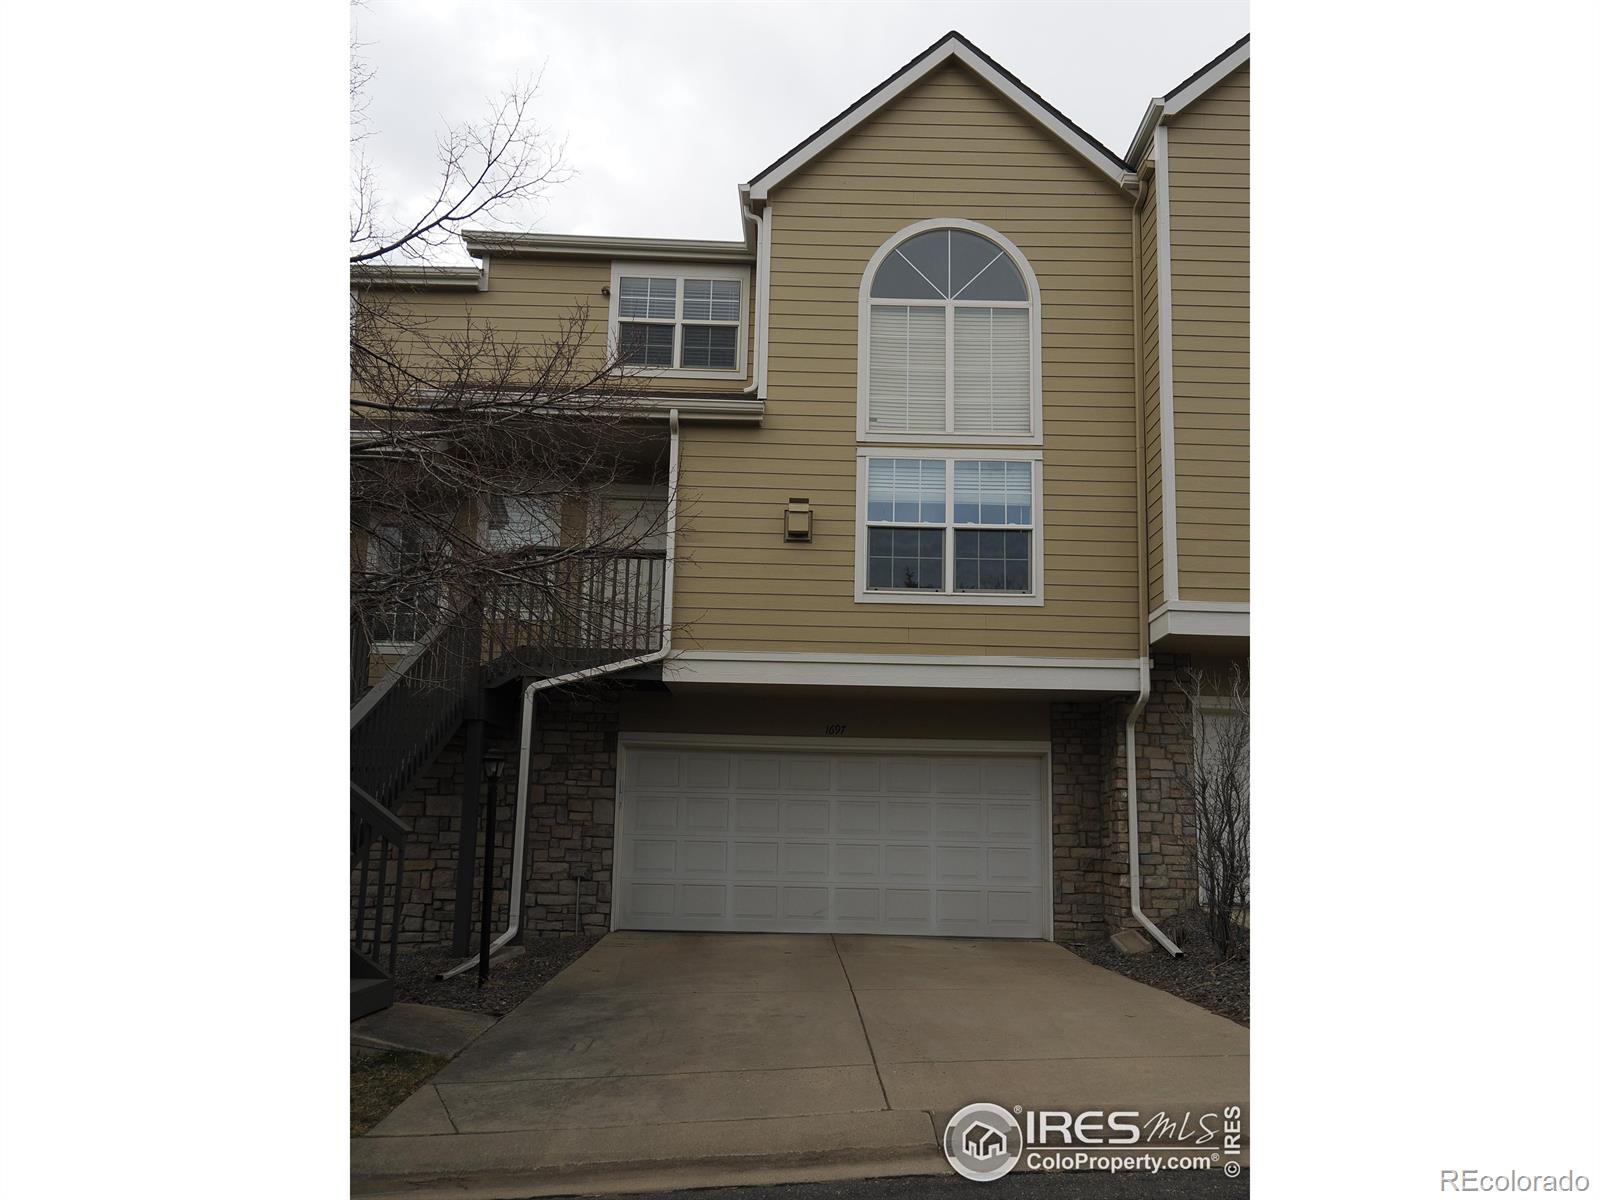
1697 High Plains Ct, Superior, CO 80027
$-1,466
Cash flow
-15.0%
Cash-on-Cash Return
2.2%
Cap rate
0.5%
Rent to Value Ratio
Active
$2,075,000
5
bds
|
5
ba
|
4,277
sqft
|
built
2015
722 Hutchinson St, Louisville, CO 80027
$-7,321
Cash flow
-18.4%
Cash-on-Cash Return
1.4%
Cap rate
0.2%
Rent to Value Ratio
Active
$1,100,000
5
bds
|
5
ba
|
5,931
sqft
|
built
2013
630 Benton Ln, Erie, CO 80516
$-2,923
Cash flow
-13.9%
Cash-on-Cash Return
2.5%
Cap rate
0.4%
Rent to Value Ratio
Active
$210,000
2
bds
|
2
ba
|
851
sqft
|
built
1975
350 Arapahoe Ave, Boulder, CO 80302
$-118
Cash flow
-2.9%
Cash-on-Cash Return
5.0%
Cap rate
1.0%
Rent to Value Ratio
Active under contract
$625,000
3
bds
|
2
ba
|
1,936
sqft
|
built
2001
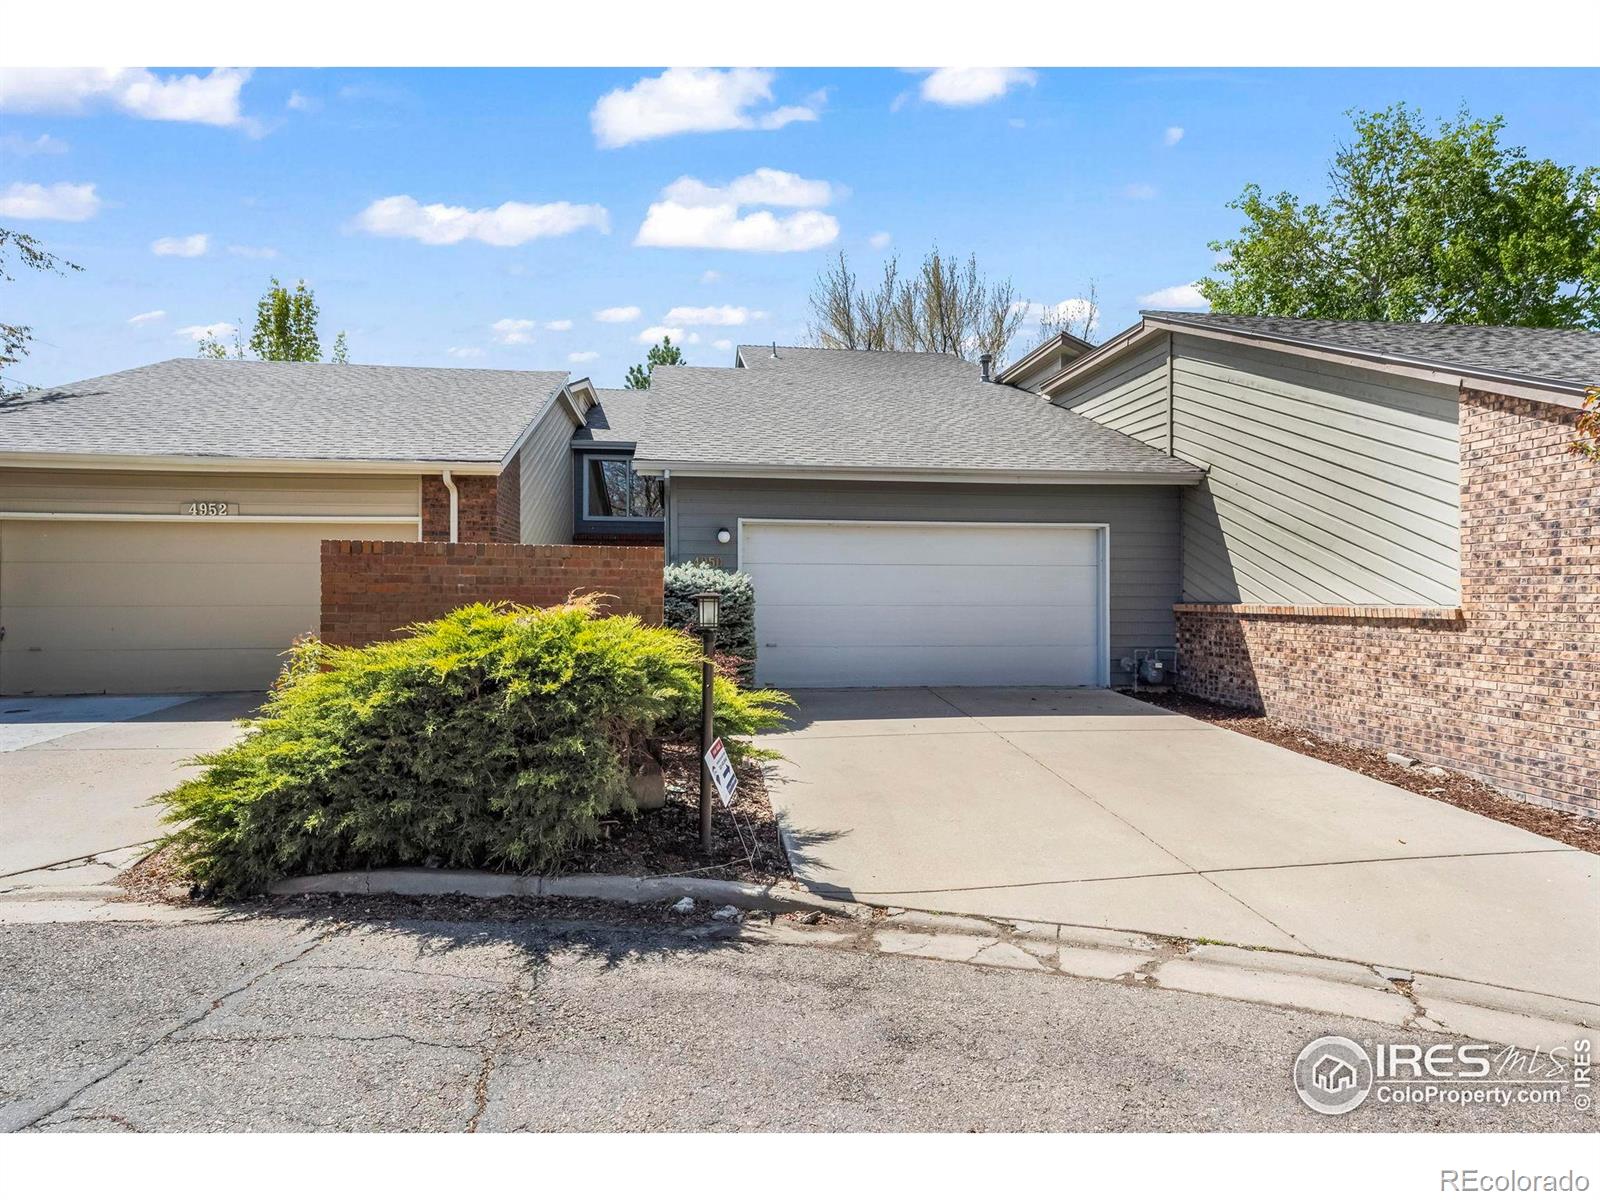
1665 Bain Dr, Erie, CO 80516
$-1,335
Cash flow
-11.1%
Cash-on-Cash Return
3.1%
Cap rate
0.5%
Rent to Value Ratio
Active
$490,000
2
bds
|
3
ba
|
1,580
sqft
|
built
1997
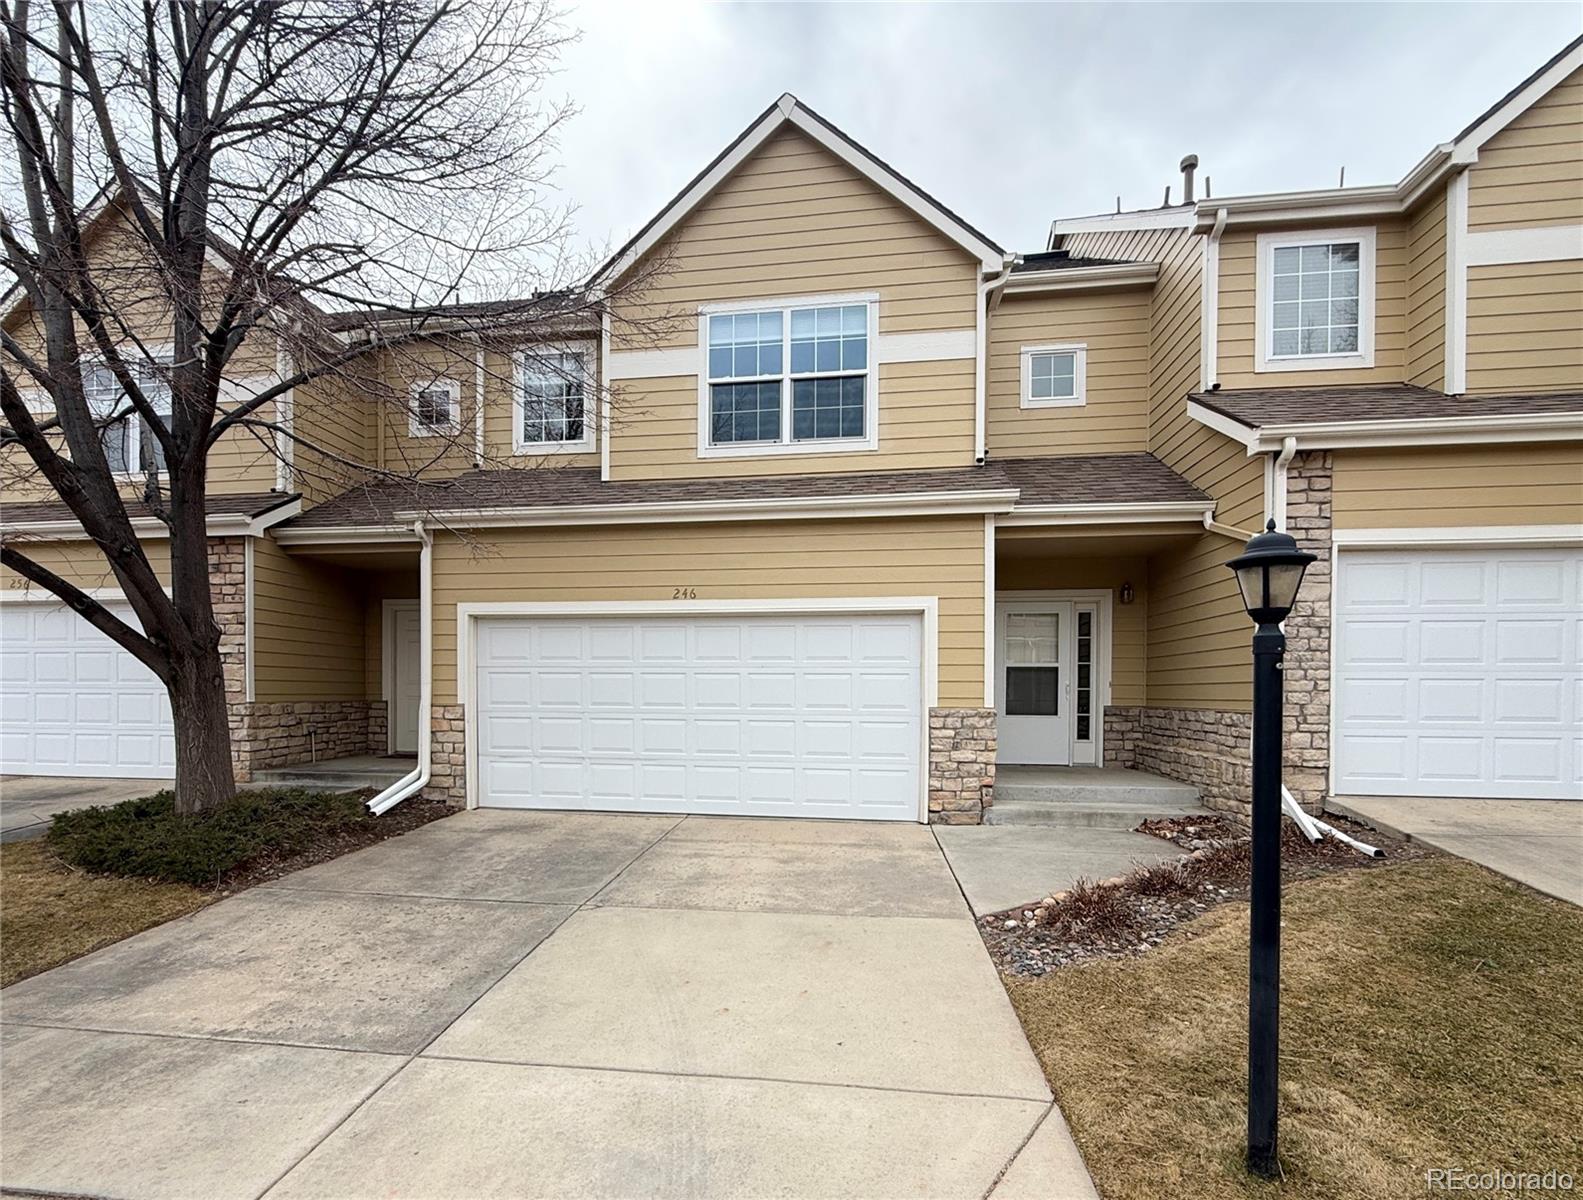
246 Rockview Dr, Superior, CO 80027
$-1,190
Cash flow
-12.7%
Cash-on-Cash Return
2.8%
Cap rate
0.6%
Rent to Value Ratio
Active
$715,000
4
bds
|
3
ba
|
2,000
sqft
|
built
1998
1730 Crestone Dr, Longmont, CO 80504
$-1,600
Cash flow
-11.7%
Cash-on-Cash Return
3.0%
Cap rate
0.4%
Rent to Value Ratio
Active
$1,397,500
3
bds
|
3
ba
|
2,808
sqft
|
built
2014
6191 Sunshine Canyon Dr, Boulder, CO 80302
$-3,440
Cash flow
-12.8%
Cash-on-Cash Return
2.7%
Cap rate
0.4%
Rent to Value Ratio
Active
$1,050,000
4
bds
|
3
ba
|
2,506
sqft
|
built
1973
37 High View Ln, Boulder, CO 80302
$-2,025
Cash flow
-10.1%
Cash-on-Cash Return
3.4%
Cap rate
0.5%
Rent to Value Ratio
Active
$1,575,000
3
bds
|
1
ba
|
1,757
sqft
|
built
1920
4743 Jay Rd, Boulder, CO 80301
$-5,044
Cash flow
-16.7%
Cash-on-Cash Return
1.8%
Cap rate
0.3%
Rent to Value Ratio
Active
$1,295,000
3
bds
|
3
ba
|
3,555
sqft
|
built
1991
7309 Windsor Dr, Boulder, CO 80301
$-3,905
Cash flow
-15.7%
Cash-on-Cash Return
2.1%
Cap rate
0.3%
Rent to Value Ratio
Active
$1,950,000
5
bds
|
5
ba
|
4,676
sqft
|
built
1998
4059 Nevis St, Boulder, CO 80301
$-6,658
Cash flow
-17.8%
Cash-on-Cash Return
1.6%
Cap rate
0.3%
Rent to Value Ratio
Active
$699,000
2
bds
|
2
ba
|
2,004
sqft
|
built
1979
4950 Sundance Sq, Boulder, CO 80301
$-1,574
Cash flow
-11.7%
Cash-on-Cash Return
3.0%
Cap rate
0.5%
Rent to Value Ratio
Active
$327,500
2
bds
|
2
ba
|
931
sqft
|
built
1969
3250 Oneal Cir, Boulder, CO 80301
$-568
Cash flow
-9.0%
Cash-on-Cash Return
3.6%
Cap rate
0.7%
Rent to Value Ratio
Active
$705,000
1
bds
|
1
ba
|
760
sqft
|
built
2014
1707 Walnut St, Boulder, CO 80302
$-2,128
Cash flow
-15.7%
Cash-on-Cash Return
2.1%
Cap rate
0.4%
Rent to Value Ratio
Active
$2,995,000
5
bds
|
5
ba
|
4,557
sqft
|
built
2013
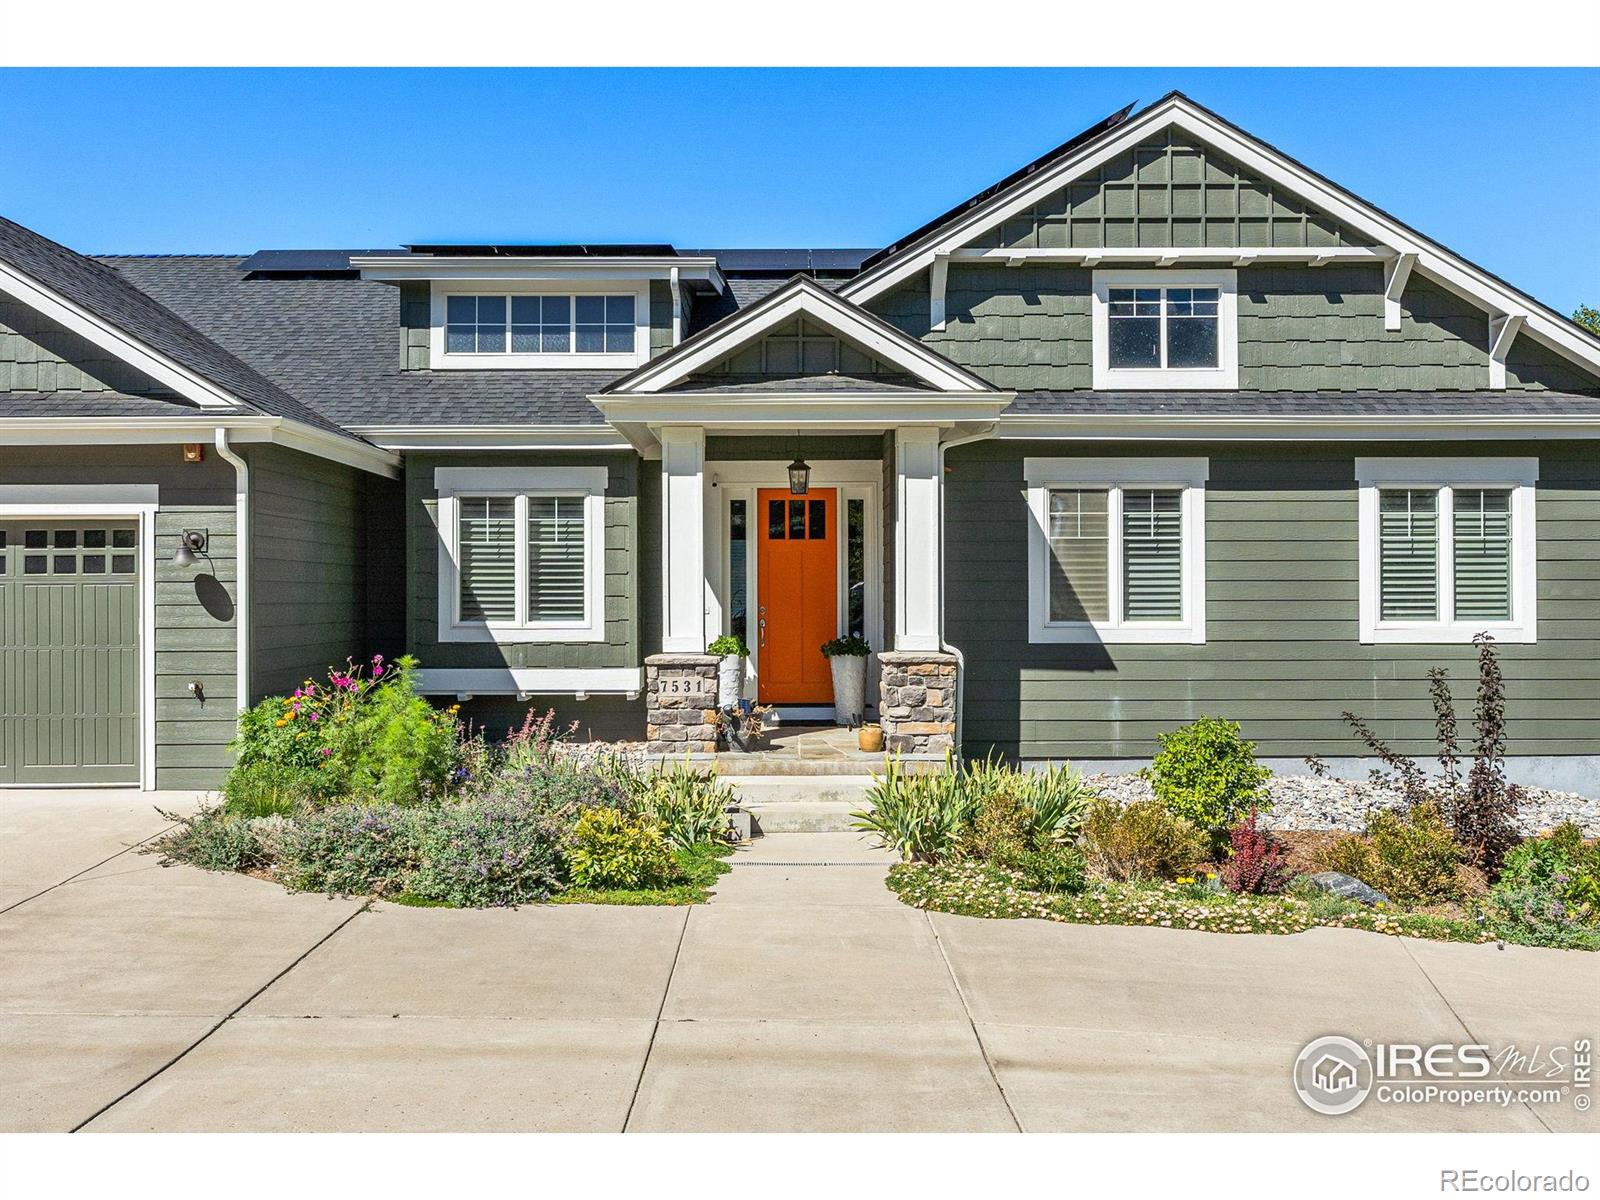
7531 Spring Dr, Boulder, CO 80303
$-11,421
Cash flow
-19.9%
Cash-on-Cash Return
1.1%
Cap rate
0.2%
Rent to Value Ratio
Active
$1,825,000
4
bds
|
3
ba
|
3,520
sqft
|
built
1968
65 Bristlecone Way, Boulder, CO 80304
$-4,425
Cash flow
-12.7%
Cash-on-Cash Return
2.8%
Cap rate
0.4%
Rent to Value Ratio
Active
$2,425,000
5
bds
|
3
ba
|
3,574
sqft
|
built
1966
4963 Kelso Rd, Boulder, CO 80301
$-8,857
Cash flow
-19.1%
Cash-on-Cash Return
1.3%
Cap rate
0.2%
Rent to Value Ratio
Active
$1,175,000
5
bds
|
3
ba
|
3,370
sqft
|
built
1987
2770 Arbor Glen Pl, Boulder, CO 80304
$-3,299
Cash flow
-14.6%
Cash-on-Cash Return
2.3%
Cap rate
0.3%
Rent to Value Ratio
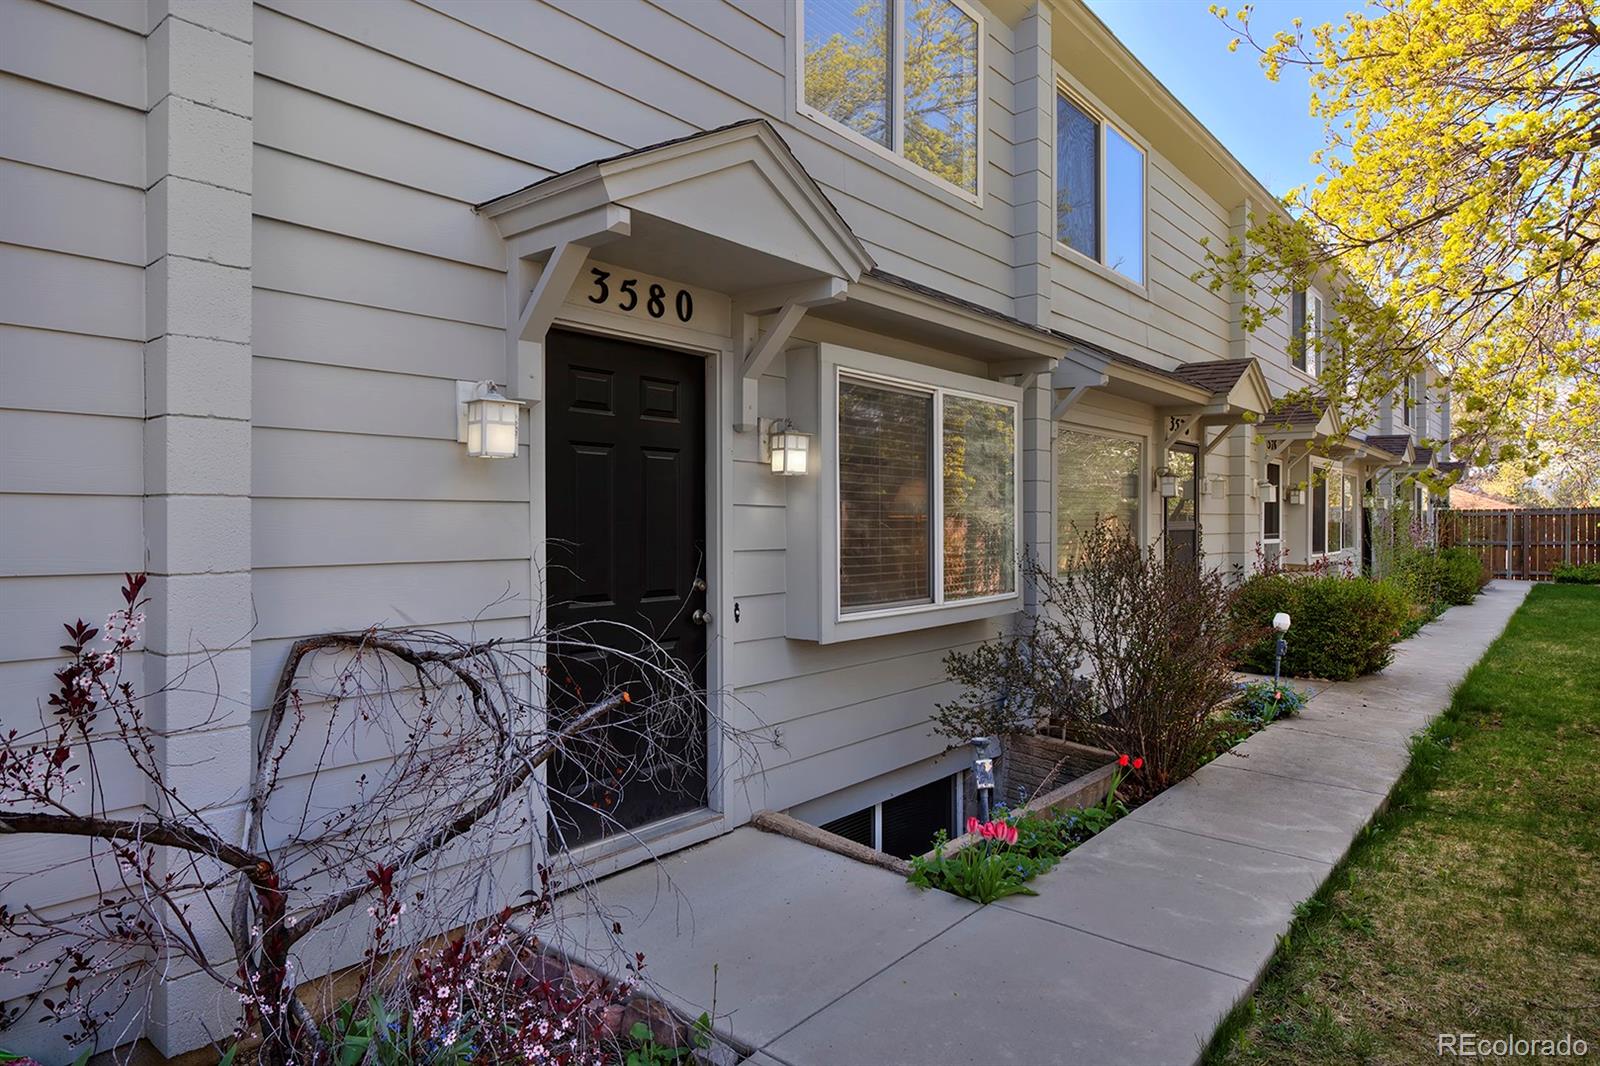
Active
$665,000
3
bds
|
3
ba
|
1,360
sqft
|
built
1966
3580 Broadway St, Boulder, CO 80304
$-1,891
Cash flow
-14.8%
Cash-on-Cash Return
2.3%
Cap rate
0.4%
Rent to Value Ratio
Active
$469,000
2
bds
|
3
ba
|
1,318
sqft
|
built
2005
4110 Riley Dr, Longmont, CO 80503
$-933
Cash flow
-10.4%
Cash-on-Cash Return
3.3%
Cap rate
0.5%
Rent to Value Ratio
Active
$475,000
3
bds
|
3
ba
|
1,470
sqft
|
built
2016
749 Robert St, Longmont, CO 80503
$-943
Cash flow
-10.4%
Cash-on-Cash Return
3.3%
Cap rate
0.6%
Rent to Value Ratio
Active
$2,500,000
3
bds
|
5
ba
|
3,363
sqft
|
built
1967
4803 Briar Ridge Ct, Boulder, CO 80301
$-9,737
Cash flow
-20.3%
Cash-on-Cash Return
1.0%
Cap rate
0.2%
Rent to Value Ratio
Active under contract
$1,380,000
5
bds
|
3
ba
|
2,574
sqft
|
built
1967
1525 Judson Dr, Boulder, CO 80305
$-4,428
Cash flow
-16.7%
Cash-on-Cash Return
1.8%
Cap rate
0.3%
Rent to Value Ratio
Active
$636,000
3
bds
|
2
ba
|
1,938
sqft
|
built
1965
305 Cottonwood Ct, Longmont, CO 80501
$-1,334
Cash flow
-10.9%
Cash-on-Cash Return
3.2%
Cap rate
0.5%
Rent to Value Ratio
Active
$1,325,000
3
bds
|
4
ba
|
2,204
sqft
|
built
1988
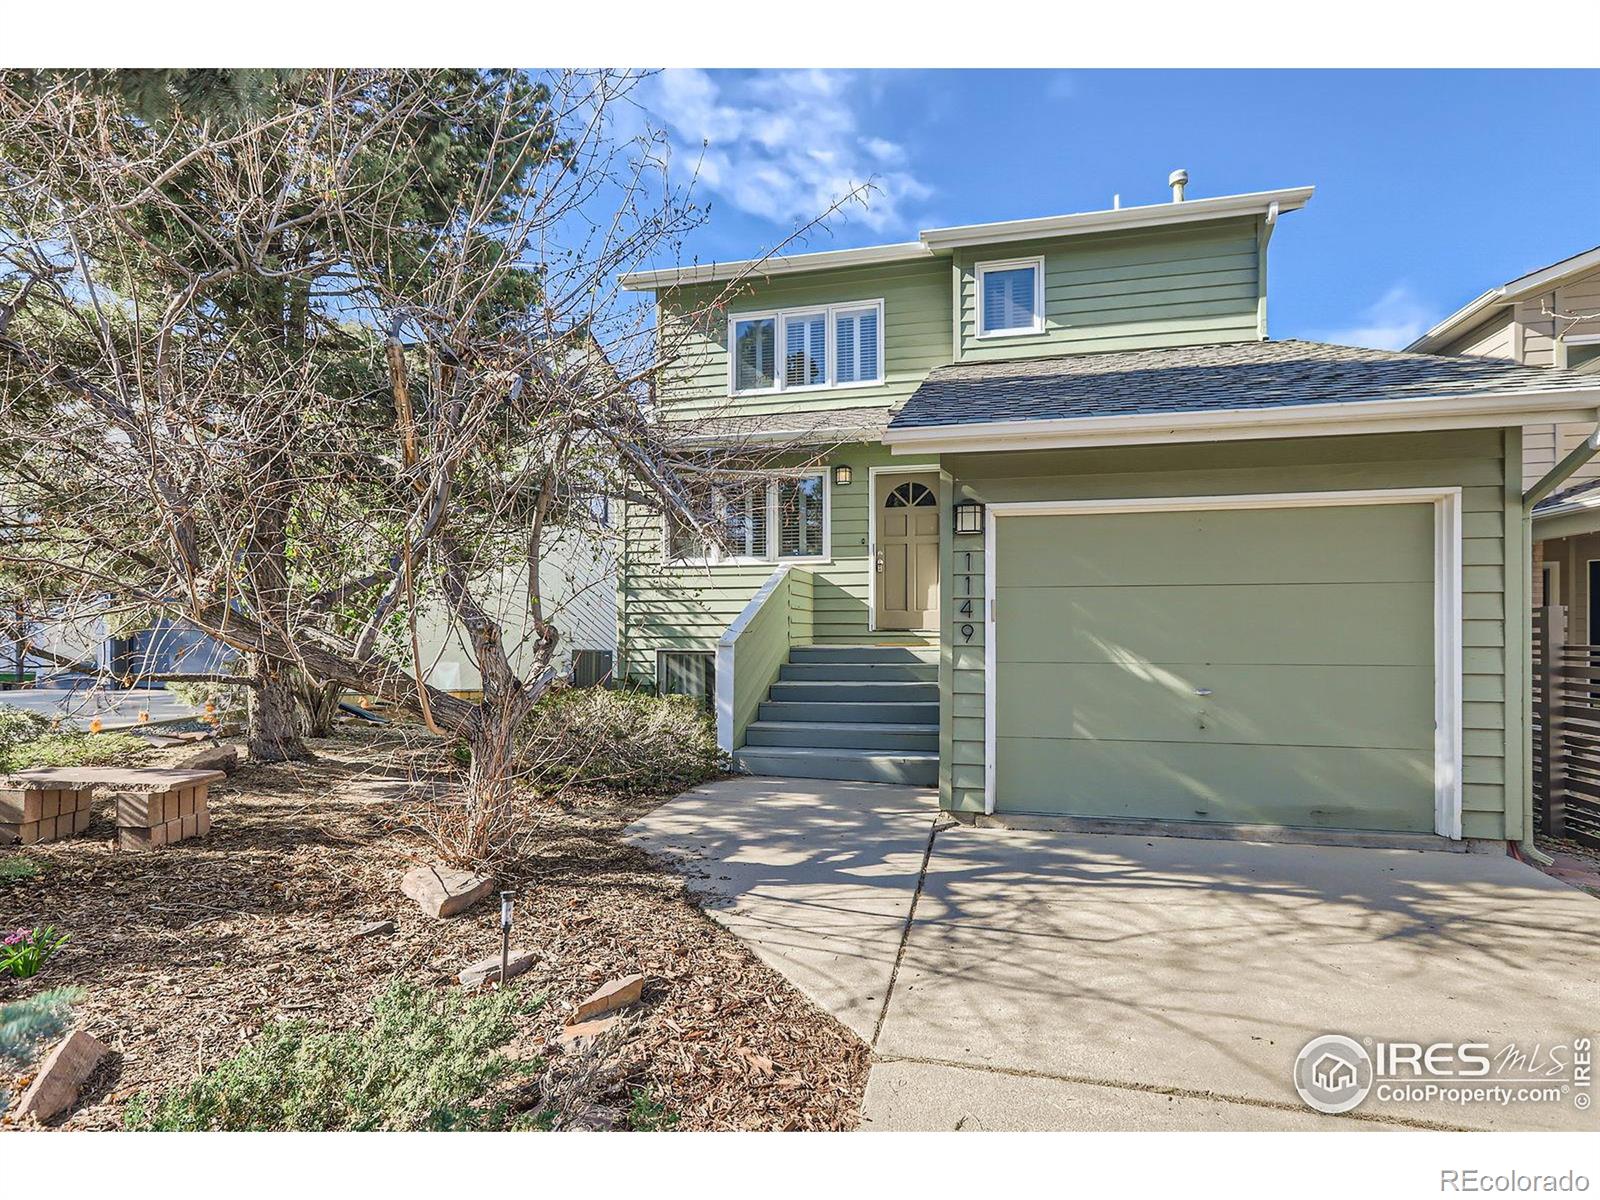
1149 Quince Ave, Boulder, CO 80304
$-3,812
Cash flow
-15.0%
Cash-on-Cash Return
2.2%
Cap rate
0.3%
Rent to Value Ratio
Active under contract
$2,000,000
2
bds
|
3
ba
|
2,306
sqft
|
built
1993
2500 Pampas Ct, Boulder, CO 80304
$-6,187
Cash flow
-16.1%
Cash-on-Cash Return
2.0%
Cap rate
0.3%
Rent to Value Ratio
Active
$6,750,000
7
bds
|
6
ba
|
7,124
sqft
|
built
2018
1505 Oak Ave, Boulder, CO 80304
$-29,027
Cash flow
-22.4%
Cash-on-Cash Return
0.5%
Cap rate
0.1%
Rent to Value Ratio
Active
$2,995,000
5
bds
|
5
ba
|
4,819
sqft
|
built
1992
990 Utica Cir, Boulder, CO 80304
$-10,880
Cash flow
-19.0%
Cash-on-Cash Return
1.3%
Cap rate
0.2%
Rent to Value Ratio
Active under contract
$1,950,000
5
bds
|
4
ba
|
4,265
sqft
|
built
1997
789 Zamia Ave, Boulder, CO 80304
$-5,964
Cash flow
-16.0%
Cash-on-Cash Return
2.0%
Cap rate
0.3%
Rent to Value Ratio
Active
$770,000
6
bds
|
4
ba
|
4,276
sqft
|
built
2002
1022 Morning Dove Dr, Longmont, CO 80504
$-1,539
Cash flow
-10.4%
Cash-on-Cash Return
3.3%
Cap rate
0.5%
Rent to Value Ratio
Active
$1,250,000
4
bds
|
2
ba
|
2,522
sqft
|
built
1972
1750 Deer Trail Rd, Boulder, CO 80302
$-3,603
Cash flow
-15.0%
Cash-on-Cash Return
2.2%
Cap rate
0.3%
Rent to Value Ratio

Active
$3,700,000
5
bds
|
5
ba
|
4,166
sqft
|
built
1965
2235 Vassar Dr, Boulder, CO 80305
$-12,328
Cash flow
-17.4%
Cash-on-Cash Return
1.7%
Cap rate
0.3%
Rent to Value Ratio
Active
$1,200,000
4
bds
|
3
ba
|
1,674
sqft
|
built
1992
2315 Walnut St, Boulder, CO 80302
$-3,590
Cash flow
-15.6%
Cash-on-Cash Return
2.1%
Cap rate
0.3%
Rent to Value Ratio
Active
$375,000
2
bds
|
2
ba
|
759
sqft
|
built
1972
860 W Moorhead Cir, Boulder, CO 80305
$-977
Cash flow
-13.6%
Cash-on-Cash Return
2.6%
Cap rate
0.6%
Rent to Value Ratio
Active
$999,000
3
bds
|
2
ba
|
1,580
sqft
|
built
1962
4035 Darley Ave, Boulder, CO 80305
$-2,826
Cash flow
-14.8%
Cash-on-Cash Return
2.3%
Cap rate
0.4%
Rent to Value Ratio
Active
$359,000
2
bds
|
2
ba
|
888
sqft
|
built
1984
2800 Kalmia Ave, Boulder, CO 80301
$-919
Cash flow
-13.4%
Cash-on-Cash Return
2.6%
Cap rate
0.6%
Rent to Value Ratio
Active
$1,350,000
4
bds
|
2
ba
|
1,628
sqft
|
built
1977
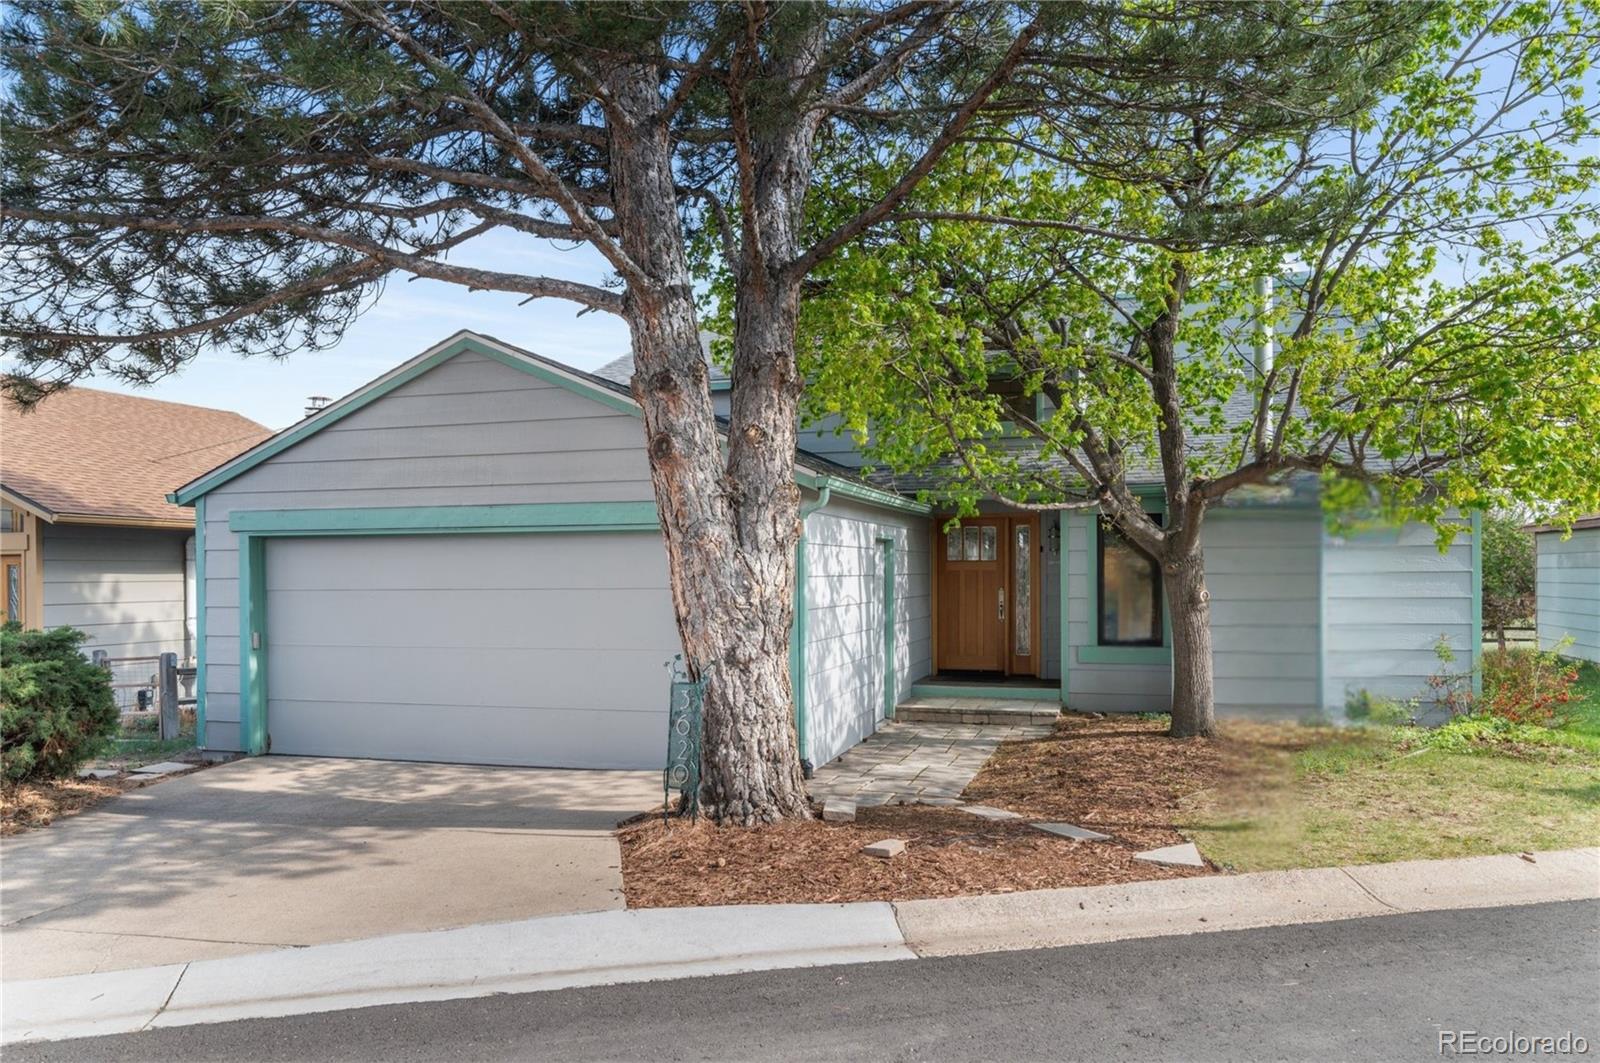
3620 Silver Plume Ln, Boulder, CO 80305
$-3,959
Cash flow
-15.3%
Cash-on-Cash Return
2.2%
Cap rate
0.3%
Rent to Value Ratio
Active
$567,700
2
bds
|
2
ba
|
1,312
sqft
|
built
1984
501 Manhattan Dr, Boulder, CO 80303
$-1,547
Cash flow
-14.2%
Cash-on-Cash Return
2.4%
Cap rate
0.5%
Rent to Value Ratio
Active
$512,500
2
bds
|
1
ba
|
1,272
sqft
|
built
2017
1379 Charles Dr, Longmont, CO 80503
$-1,551
Cash flow
-15.8%
Cash-on-Cash Return
2.0%
Cap rate
0.5%
Rent to Value Ratio