Boulder County Investment Properties for Sale
Browse homes for sale and investment properties in Boulder County. Refine your search by price, property type, or more.
Best cash flowing properties in Boulder County
Active
$419,000
3
bds
|
1
ba
|
1,440
sqft
|
built
1969
147 Dawson Pl, Longmont, CO 80504
$-459
Cash flow
-5.7%
Cash-on-Cash Return
4.4%
Cap rate
0.6%
Rent to Value Ratio
Active
$355,000
3
bds
|
2
ba
|
1,320
sqft
|
built
2017
804 Summer Hawk Dr, Longmont, CO 80504
$-663
Cash flow
-9.7%
Cash-on-Cash Return
3.4%
Cap rate
0.6%
Rent to Value Ratio
1,199 out of 1,339 properties for sale in Boulder County
Limited Results Shown
Create a free account, or log in to reveal all property listings and enjoy the complete experience.
Active
$345,000
1
bds
|
1
ba
|
702
sqft
|
built
1967
2227 Canyon Blvd, Boulder, CO 80302
$-975
Cash flow
-14.7%
Cash-on-Cash Return
2.3%
Cap rate
0.6%
Rent to Value Ratio
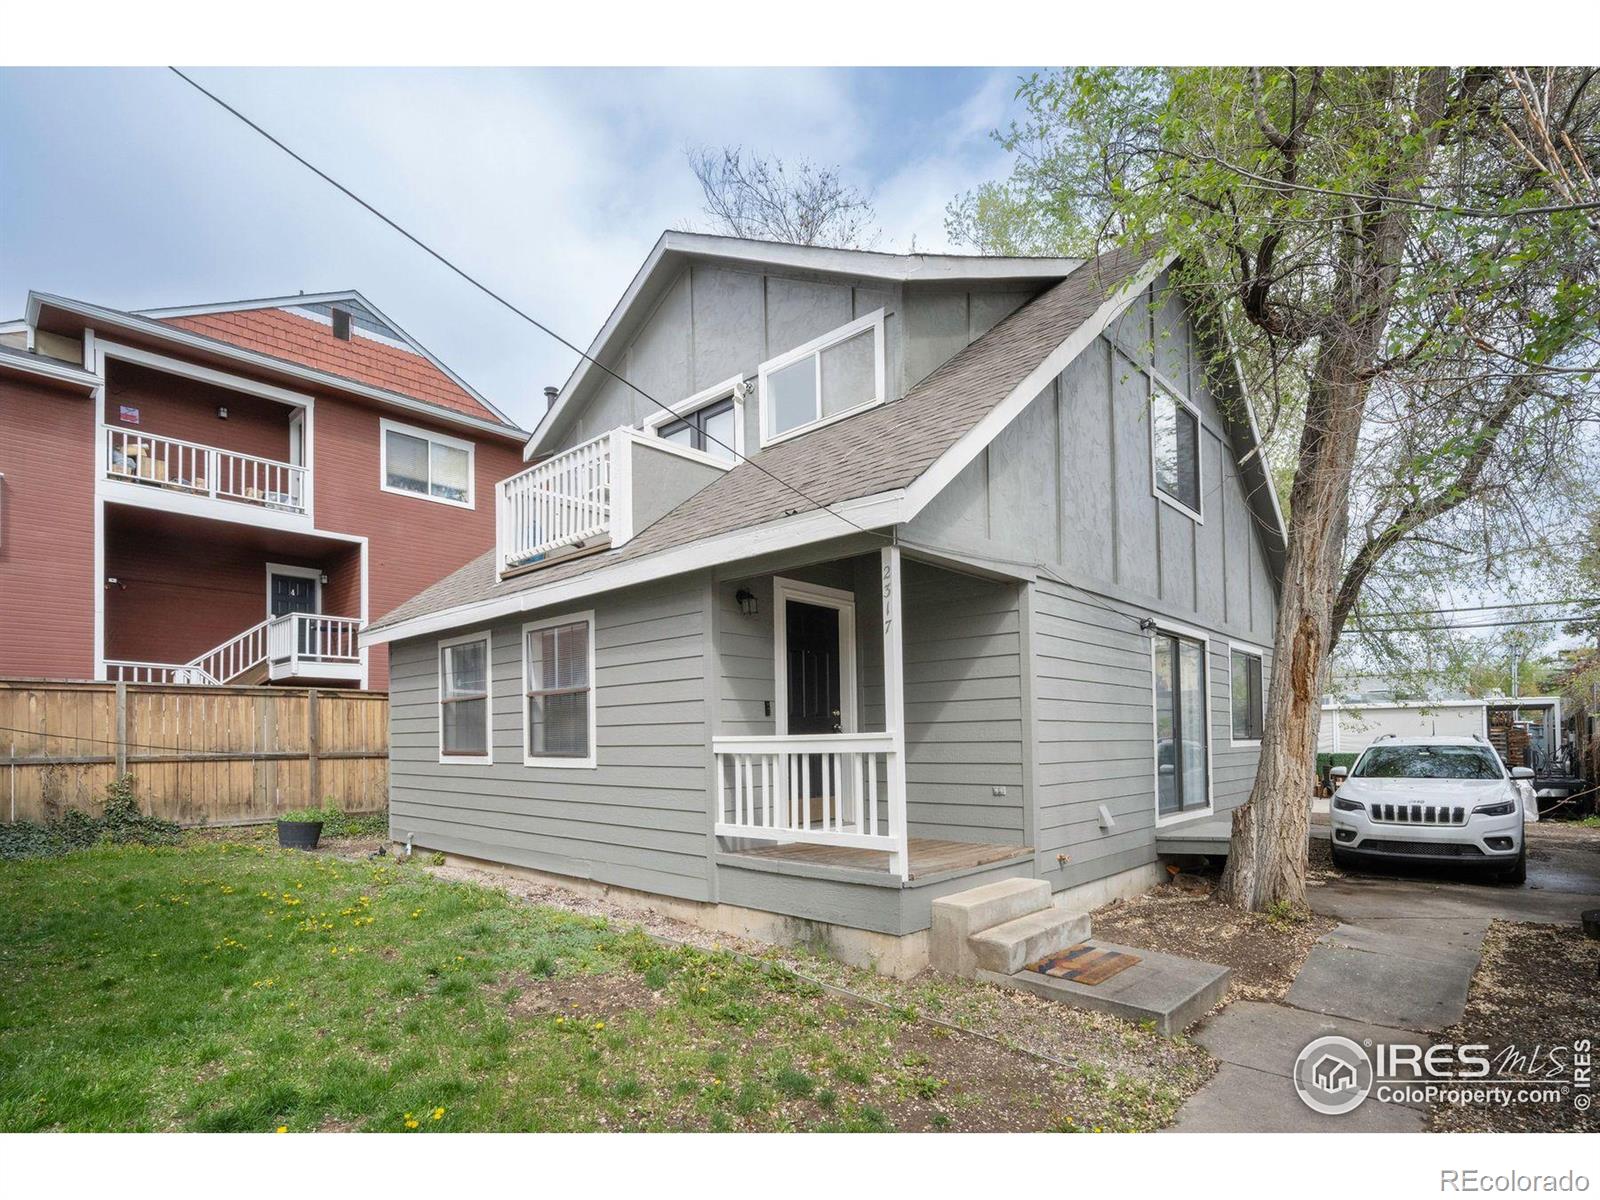
Active
$1,200,000
4
bds
|
2
ba
|
1,526
sqft
|
built
1992
2317 Walnut St, Boulder, CO 80302
$-3,537
Cash flow
-15.4%
Cash-on-Cash Return
2.1%
Cap rate
0.3%
Rent to Value Ratio
Active
$800,000
6
bds
|
4
ba
|
3,041
sqft
|
built
1967
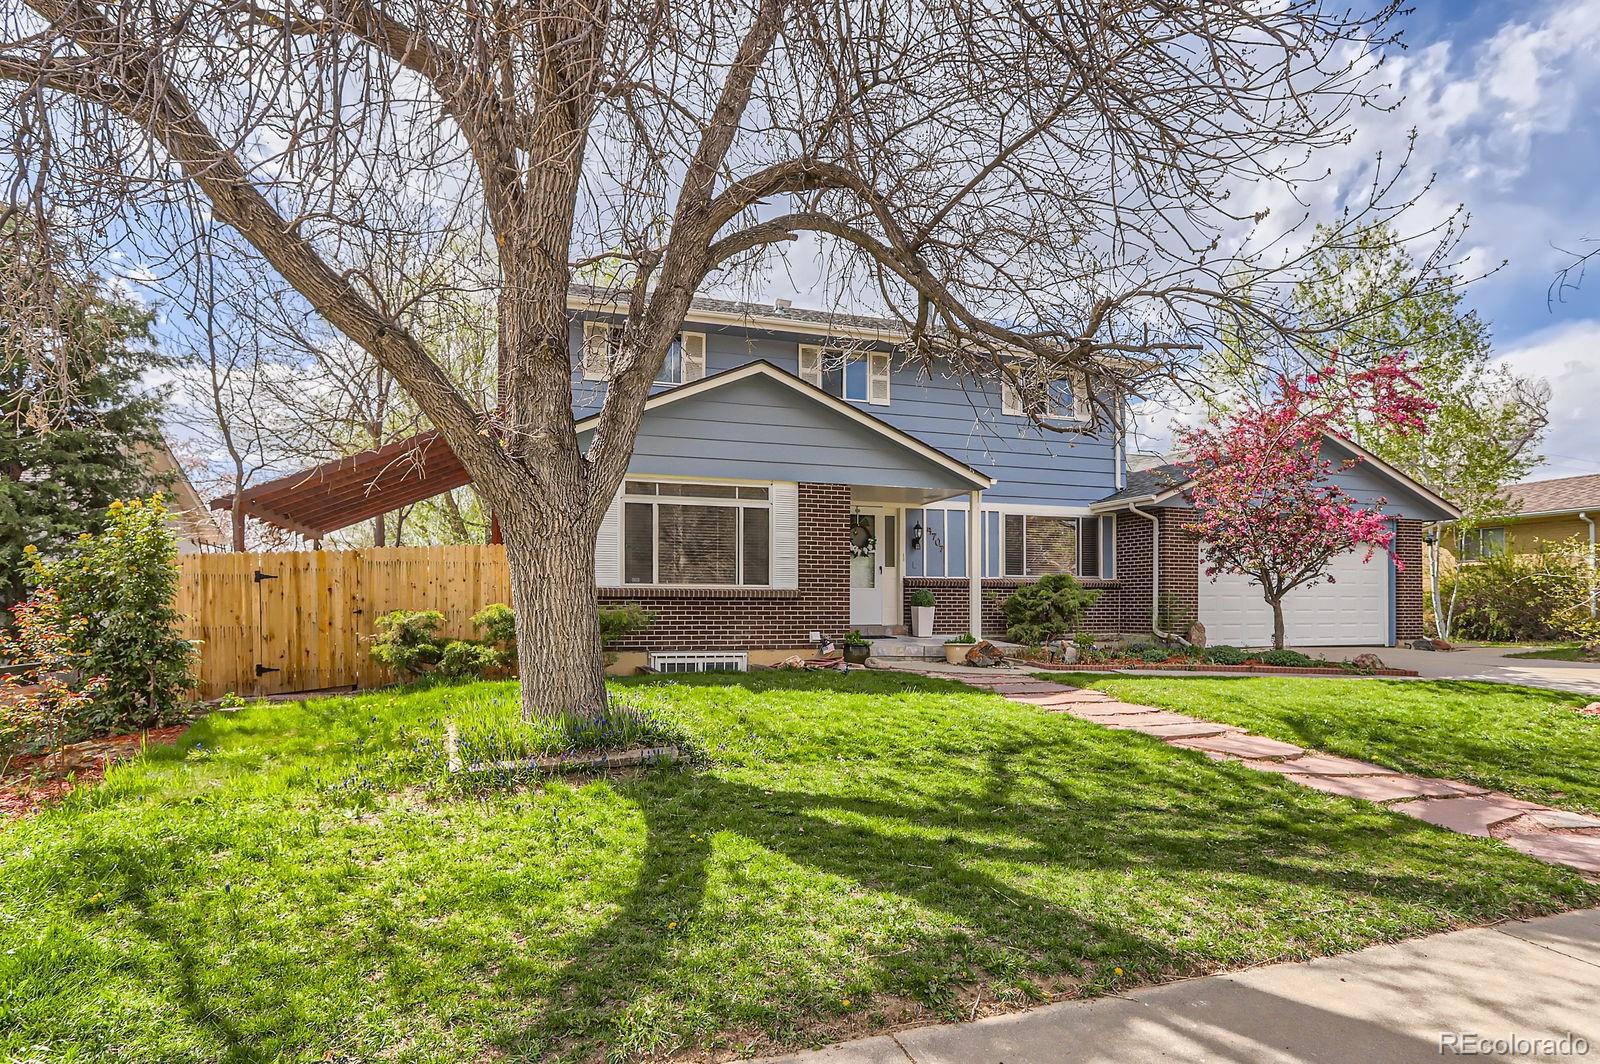
4707 Ashfield Ct, Boulder, CO 80301
$-1,521
Cash flow
-9.9%
Cash-on-Cash Return
3.4%
Cap rate
0.5%
Rent to Value Ratio
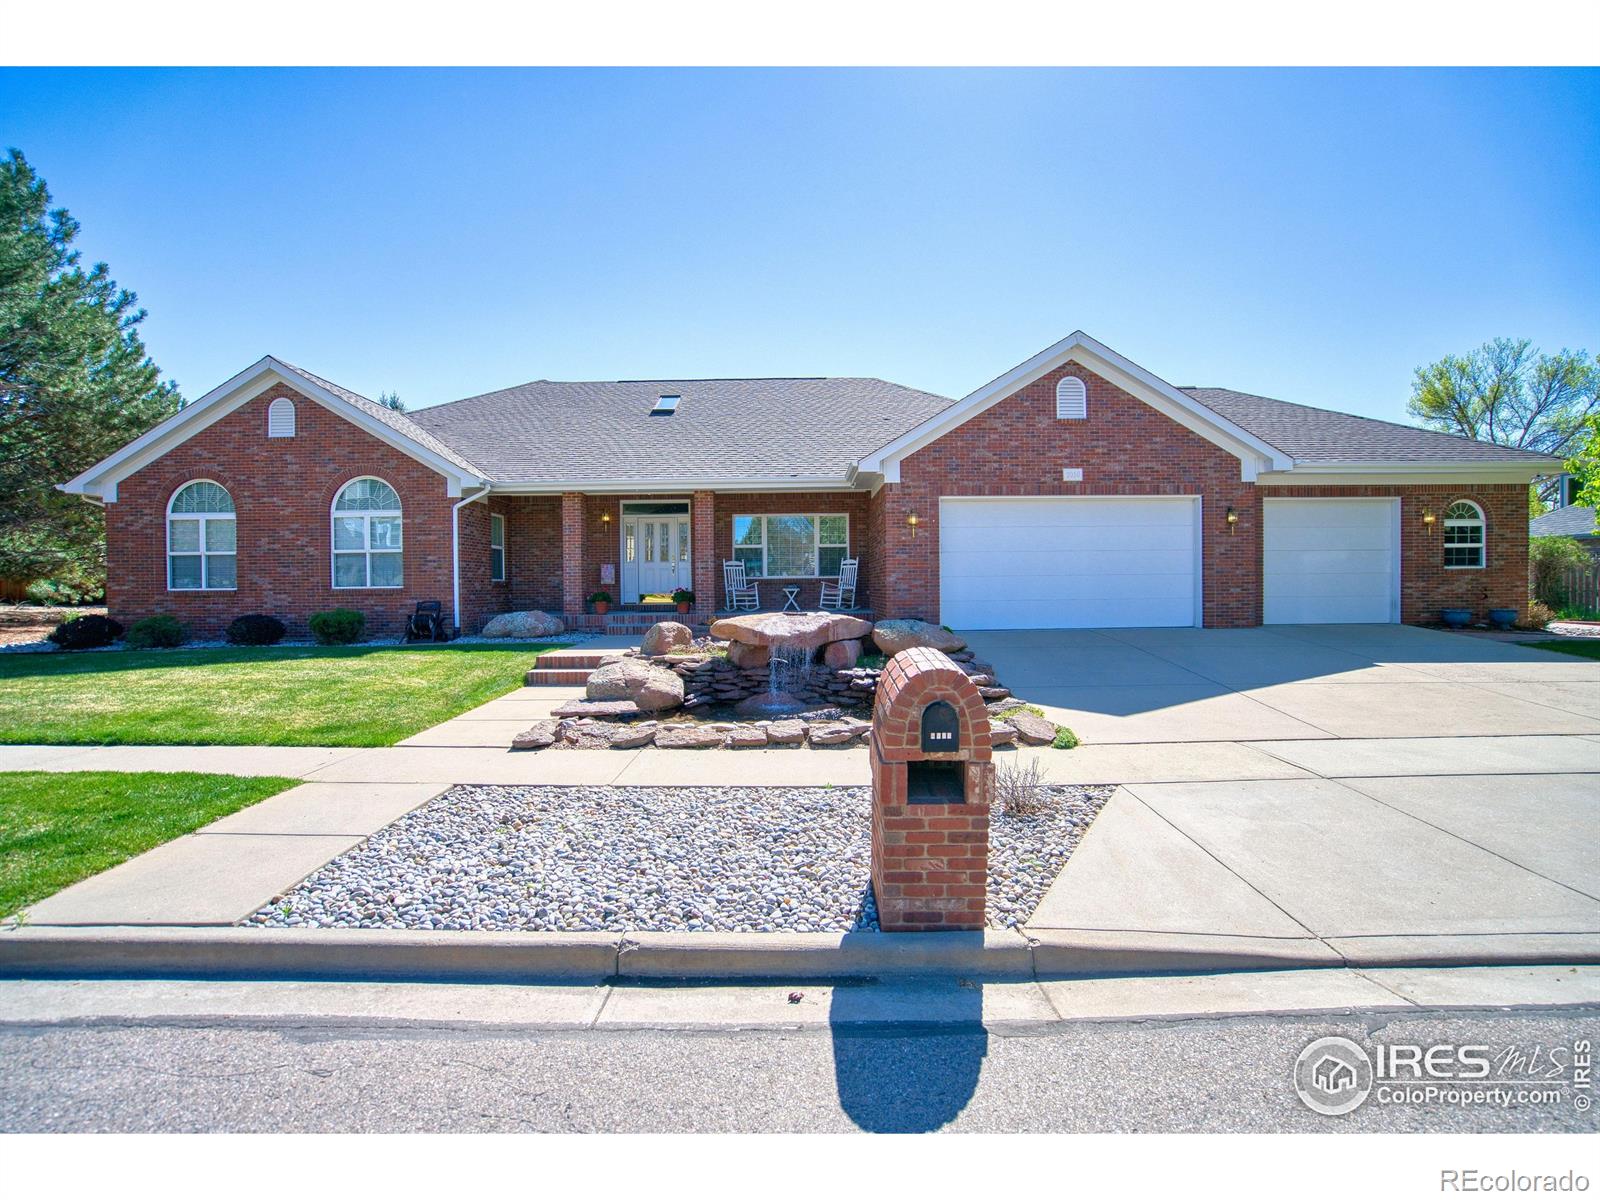
Active
$695,000
4
bds
|
3
ba
|
2,712
sqft
|
built
2011
1512 Lasalle Way, Longmont, CO 80504
$-1,323
Cash flow
-9.9%
Cash-on-Cash Return
3.4%
Cap rate
0.5%
Rent to Value Ratio
Active
$898,200
3
bds
|
2
ba
|
1,149
sqft
|
built
2014
1707 Walnut St, Boulder, CO 80302
$-2,502
Cash flow
-14.5%
Cash-on-Cash Return
2.3%
Cap rate
0.4%
Rent to Value Ratio
Active
$1,990,000
5
bds
|
4
ba
|
3,230
sqft
|
built
1984
3895 Norwood Ct, Boulder, CO 80304
$-6,148
Cash flow
-16.1%
Cash-on-Cash Return
2.0%
Cap rate
0.3%
Rent to Value Ratio
Active
$1,795,000
5
bds
|
4
ba
|
4,062
sqft
|
built
1999
4921 Fountain St, Boulder, CO 80304
$-5,530
Cash flow
-16.1%
Cash-on-Cash Return
2.0%
Cap rate
0.3%
Rent to Value Ratio
Active
$12,000,000
4
bds
|
5
ba
|
4,943
sqft
|
built
2023
440 Juniper Ave, Boulder, CO 80304
$-53,798
Cash flow
-23.4%
Cash-on-Cash Return
0.3%
Cap rate
0.1%
Rent to Value Ratio
Active
$795,000
3
bds
|
3
ba
|
2,100
sqft
|
built
1980
2728 Northbrook Pl, Boulder, CO 80304
$-2,120
Cash flow
-13.9%
Cash-on-Cash Return
2.5%
Cap rate
0.4%
Rent to Value Ratio
Active
$2,400,000
3
bds
|
2
ba
|
2,532
sqft
|
built
1904
838 University Ave, Boulder, CO 80302
$-8,760
Cash flow
-19.0%
Cash-on-Cash Return
1.3%
Cap rate
0.2%
Rent to Value Ratio
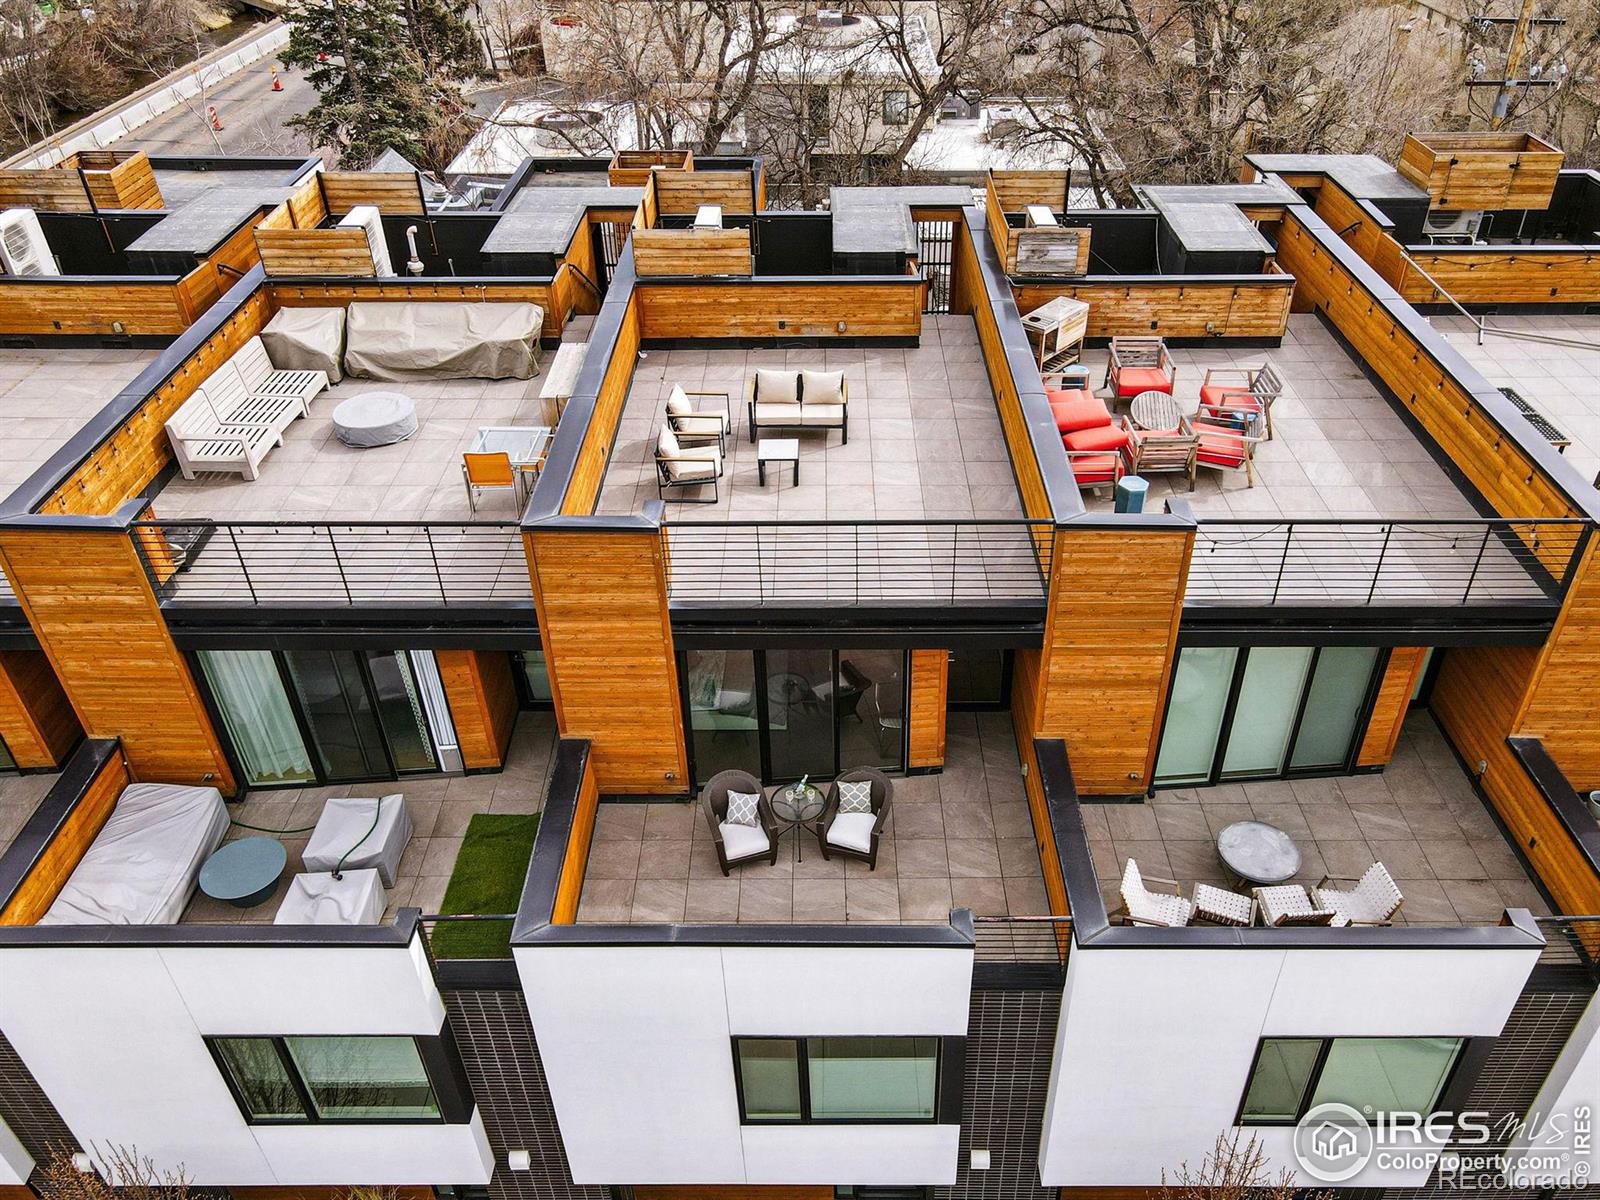
Active
$1,975,000
3
bds
|
4
ba
|
2,121
sqft
|
built
2020
1916 23rd St, Boulder, CO 80302
$-7,191
Cash flow
-19.0%
Cash-on-Cash Return
1.3%
Cap rate
0.3%
Rent to Value Ratio
Active
$500,000
2
bds
|
2
ba
|
993
sqft
|
built
1984
20 S Boulder Cir, Boulder, CO 80303
$-1,334
Cash flow
-13.9%
Cash-on-Cash Return
2.5%
Cap rate
0.5%
Rent to Value Ratio
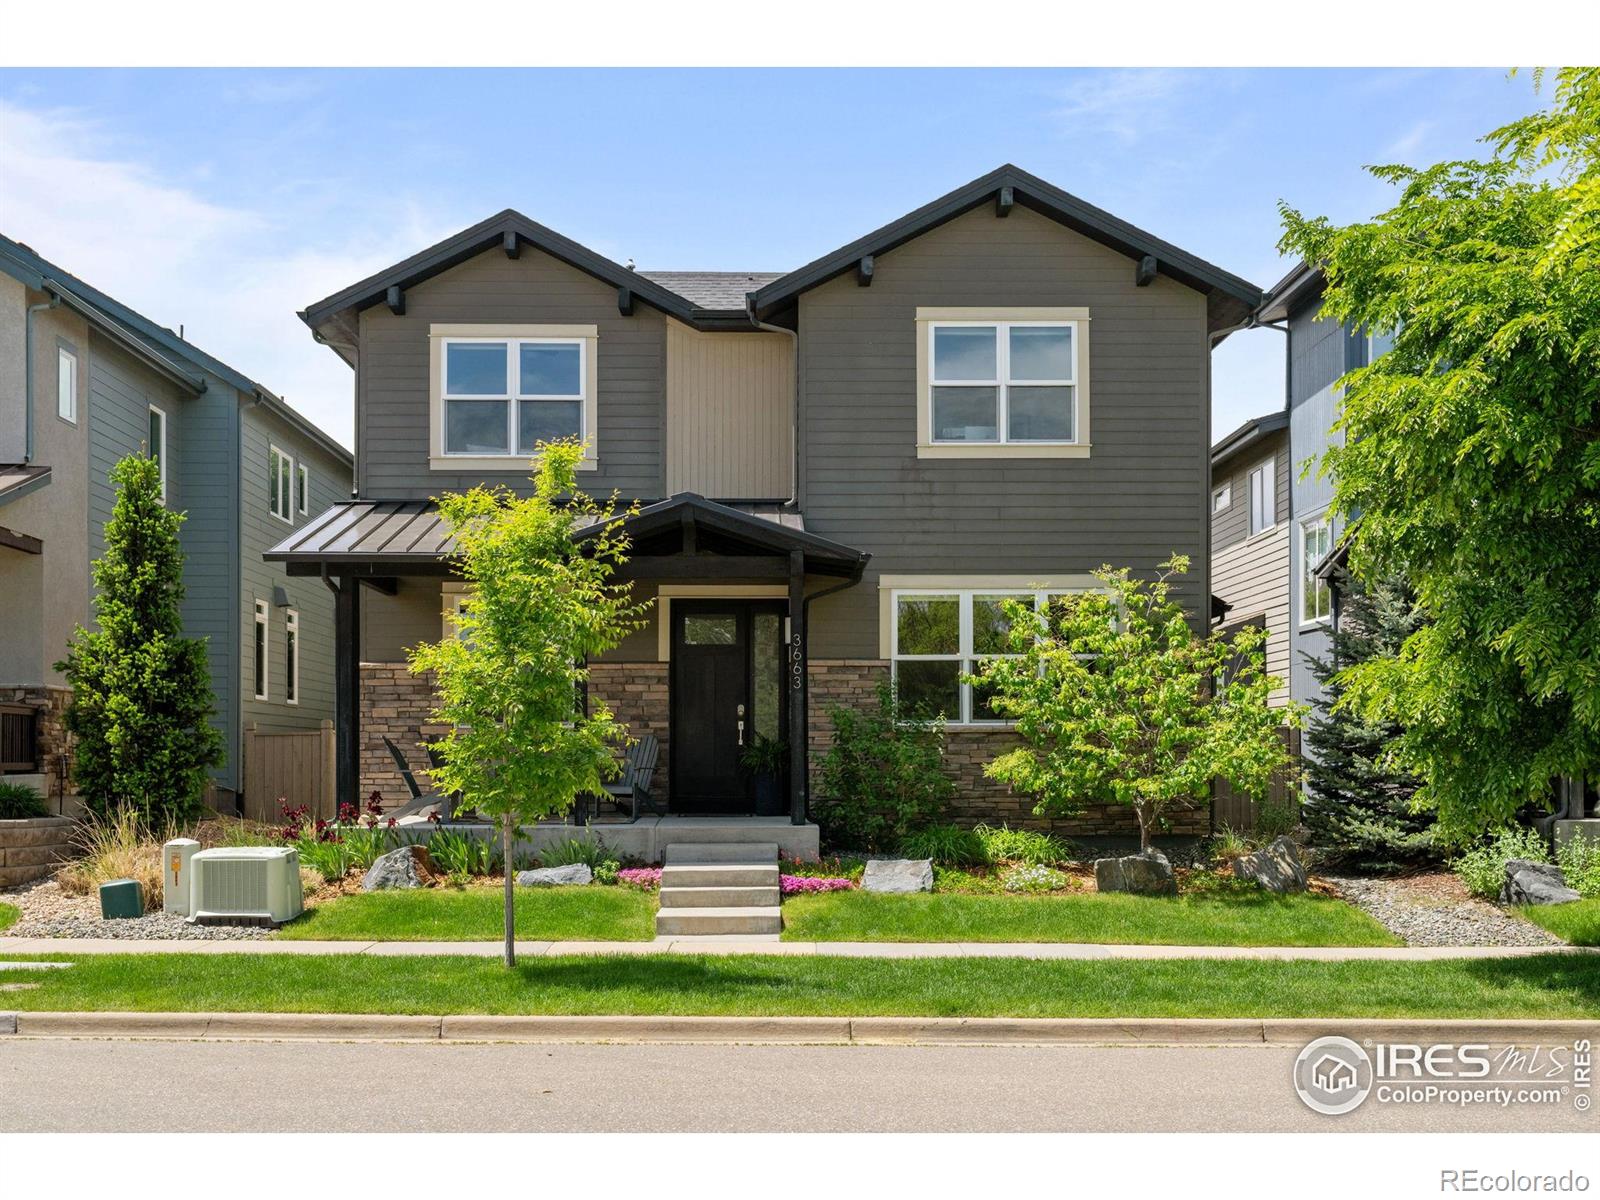
Active
$1,799,000
4
bds
|
4
ba
|
4,507
sqft
|
built
2014
3663 Silverton St, Boulder, CO 80301
$-4,962
Cash flow
-14.4%
Cash-on-Cash Return
2.4%
Cap rate
0.4%
Rent to Value Ratio
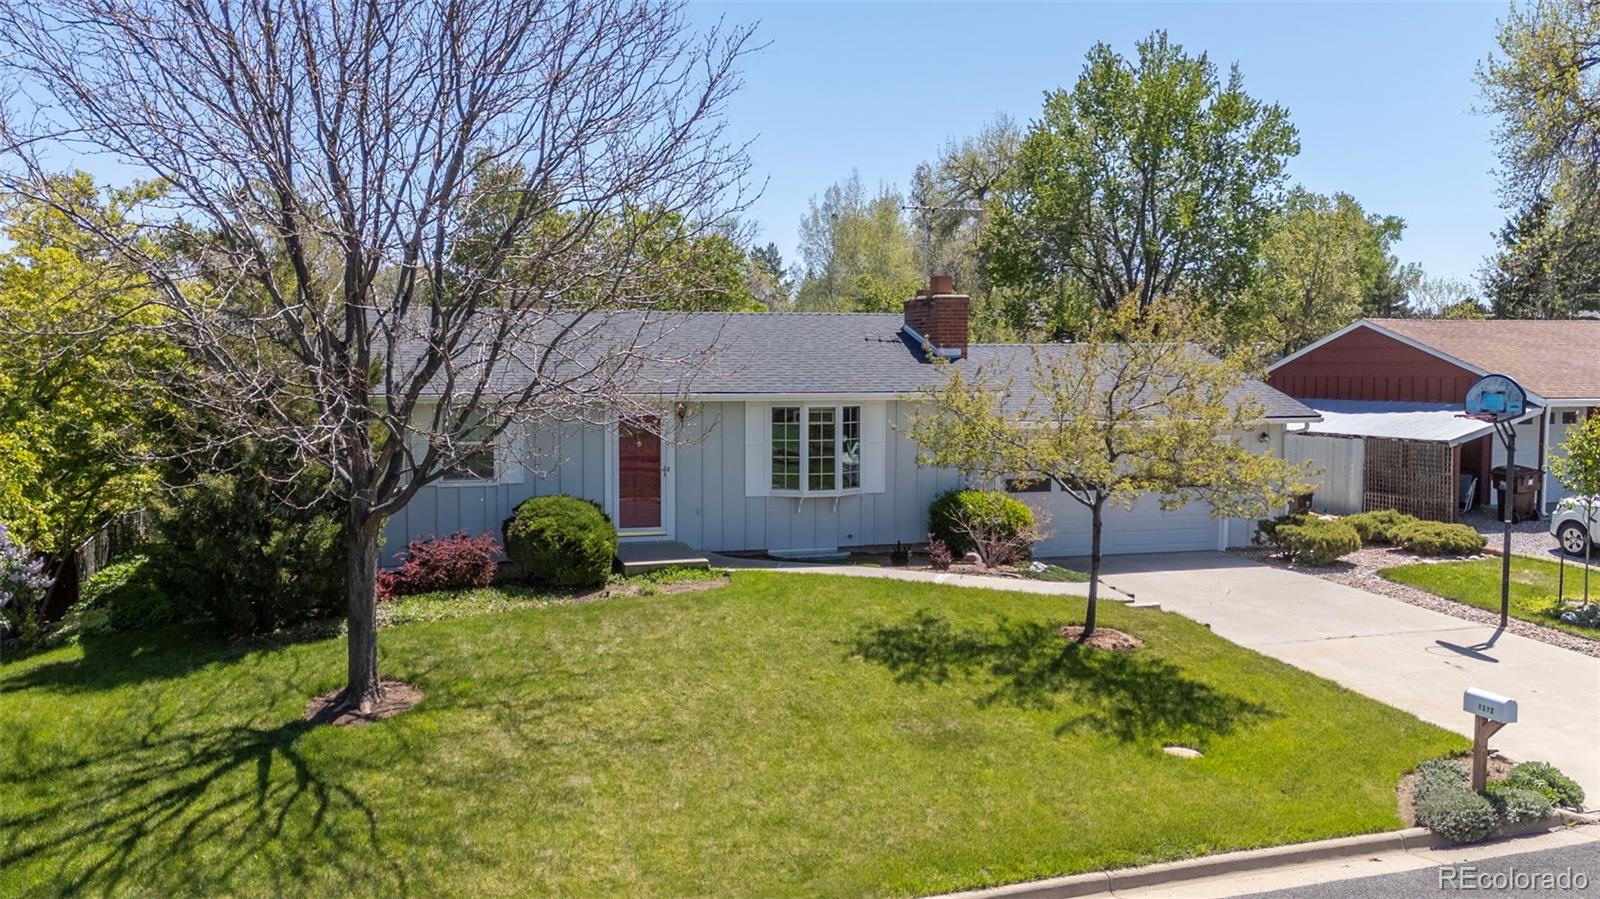
Active
$895,000
3
bds
|
2
ba
|
1,740
sqft
|
built
1972
1322 Wicklow St, Boulder, CO 80303
$-2,732
Cash flow
-15.9%
Cash-on-Cash Return
2.0%
Cap rate
0.3%
Rent to Value Ratio
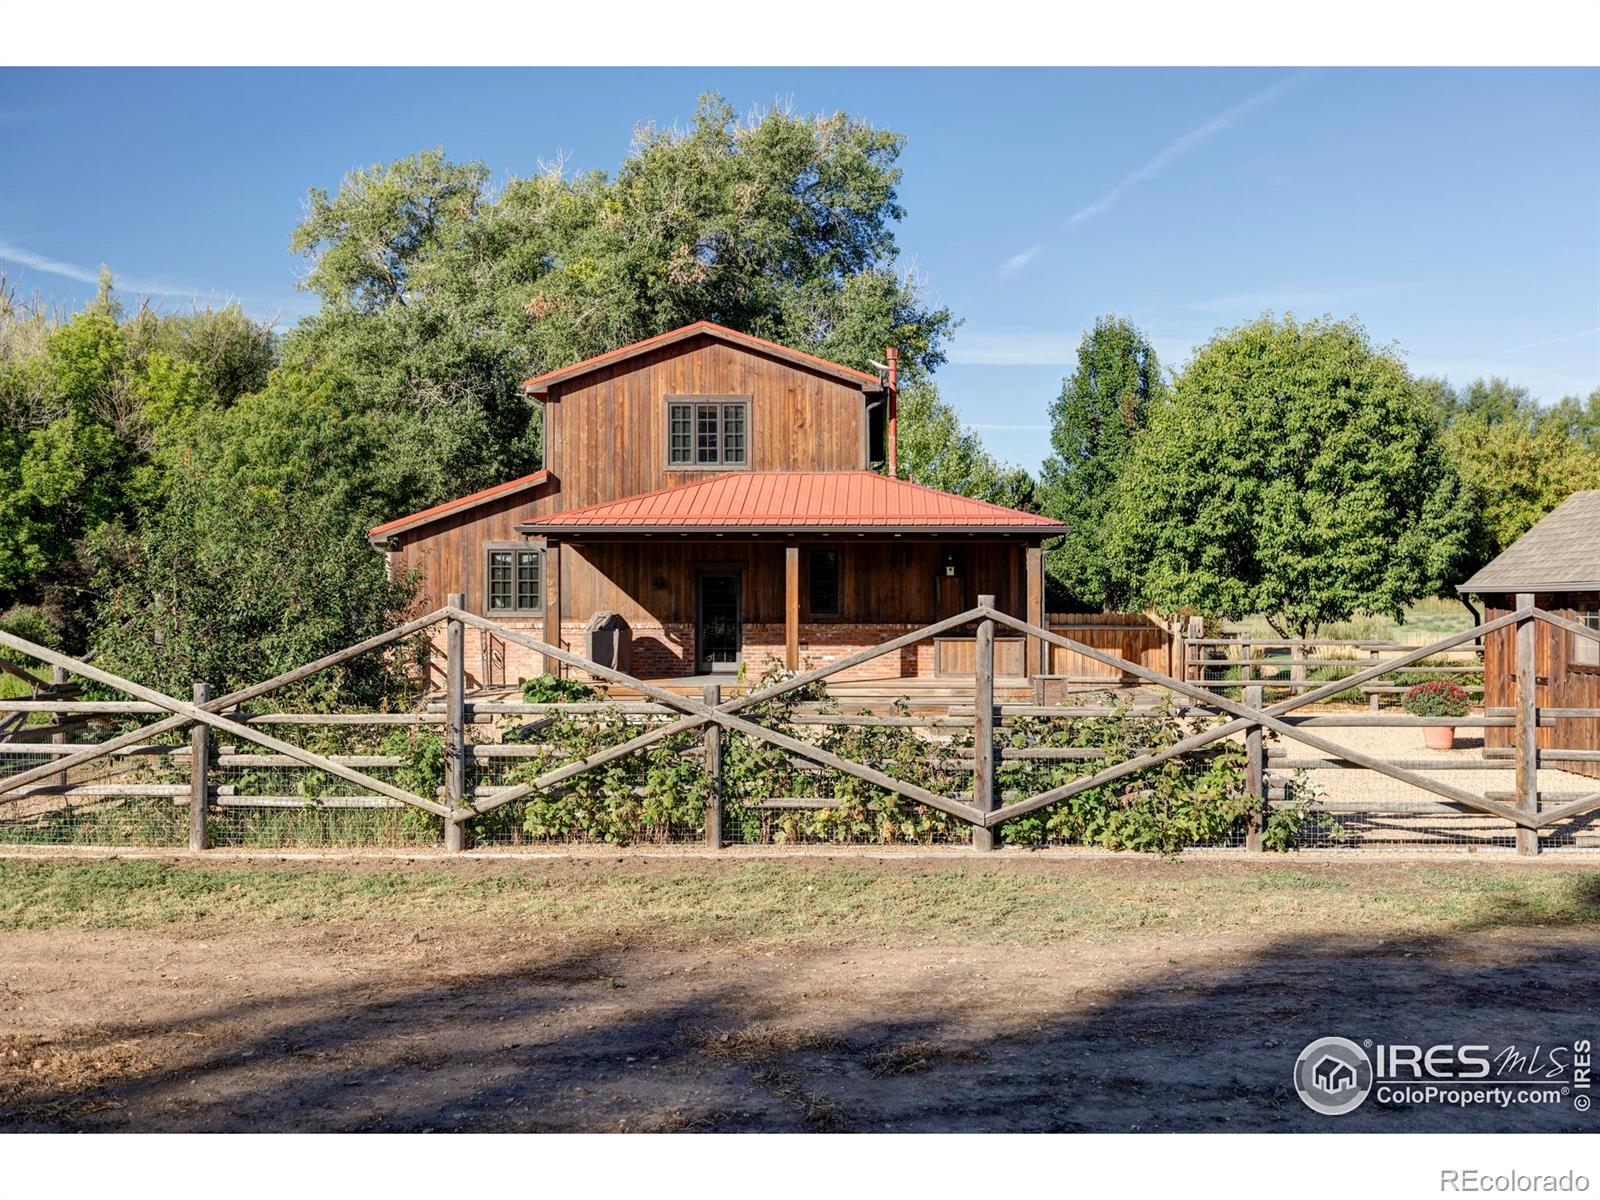
Active
$2,500,000
2
bds
|
3
ba
|
2,778
sqft
|
built
2010
1440 Reed Ranch Rd, Boulder, CO 80302
$-8,441
Cash flow
-17.6%
Cash-on-Cash Return
1.6%
Cap rate
0.3%
Rent to Value Ratio
Active
$3,450,000
3
bds
|
3
ba
|
3,228
sqft
|
built
1970
230 Cactus Ct, Boulder, CO 80304
$-13,139
Cash flow
-19.9%
Cash-on-Cash Return
1.1%
Cap rate
0.2%
Rent to Value Ratio
Active
$8,950,000
4
bds
|
6
ba
|
7,737
sqft
|
built
2007
335 Lee Hill Dr, Boulder, CO 80302
$-42,154
Cash flow
-24.6%
Cash-on-Cash Return
0.0%
Cap rate
0.1%
Rent to Value Ratio
Active under contract
$775,000
3
bds
|
3
ba
|
1,908
sqft
|
built
1972
287 Brook Cir, Boulder, CO 80302
$-1,622
Cash flow
-10.9%
Cash-on-Cash Return
3.2%
Cap rate
0.5%
Rent to Value Ratio
Active under contract
$639,000
4
bds
|
4
ba
|
2,955
sqft
|
built
1993
2437 Maplewood Cir E, Longmont, CO 80503
$-941
Cash flow
-7.7%
Cash-on-Cash Return
3.9%
Cap rate
0.5%
Rent to Value Ratio
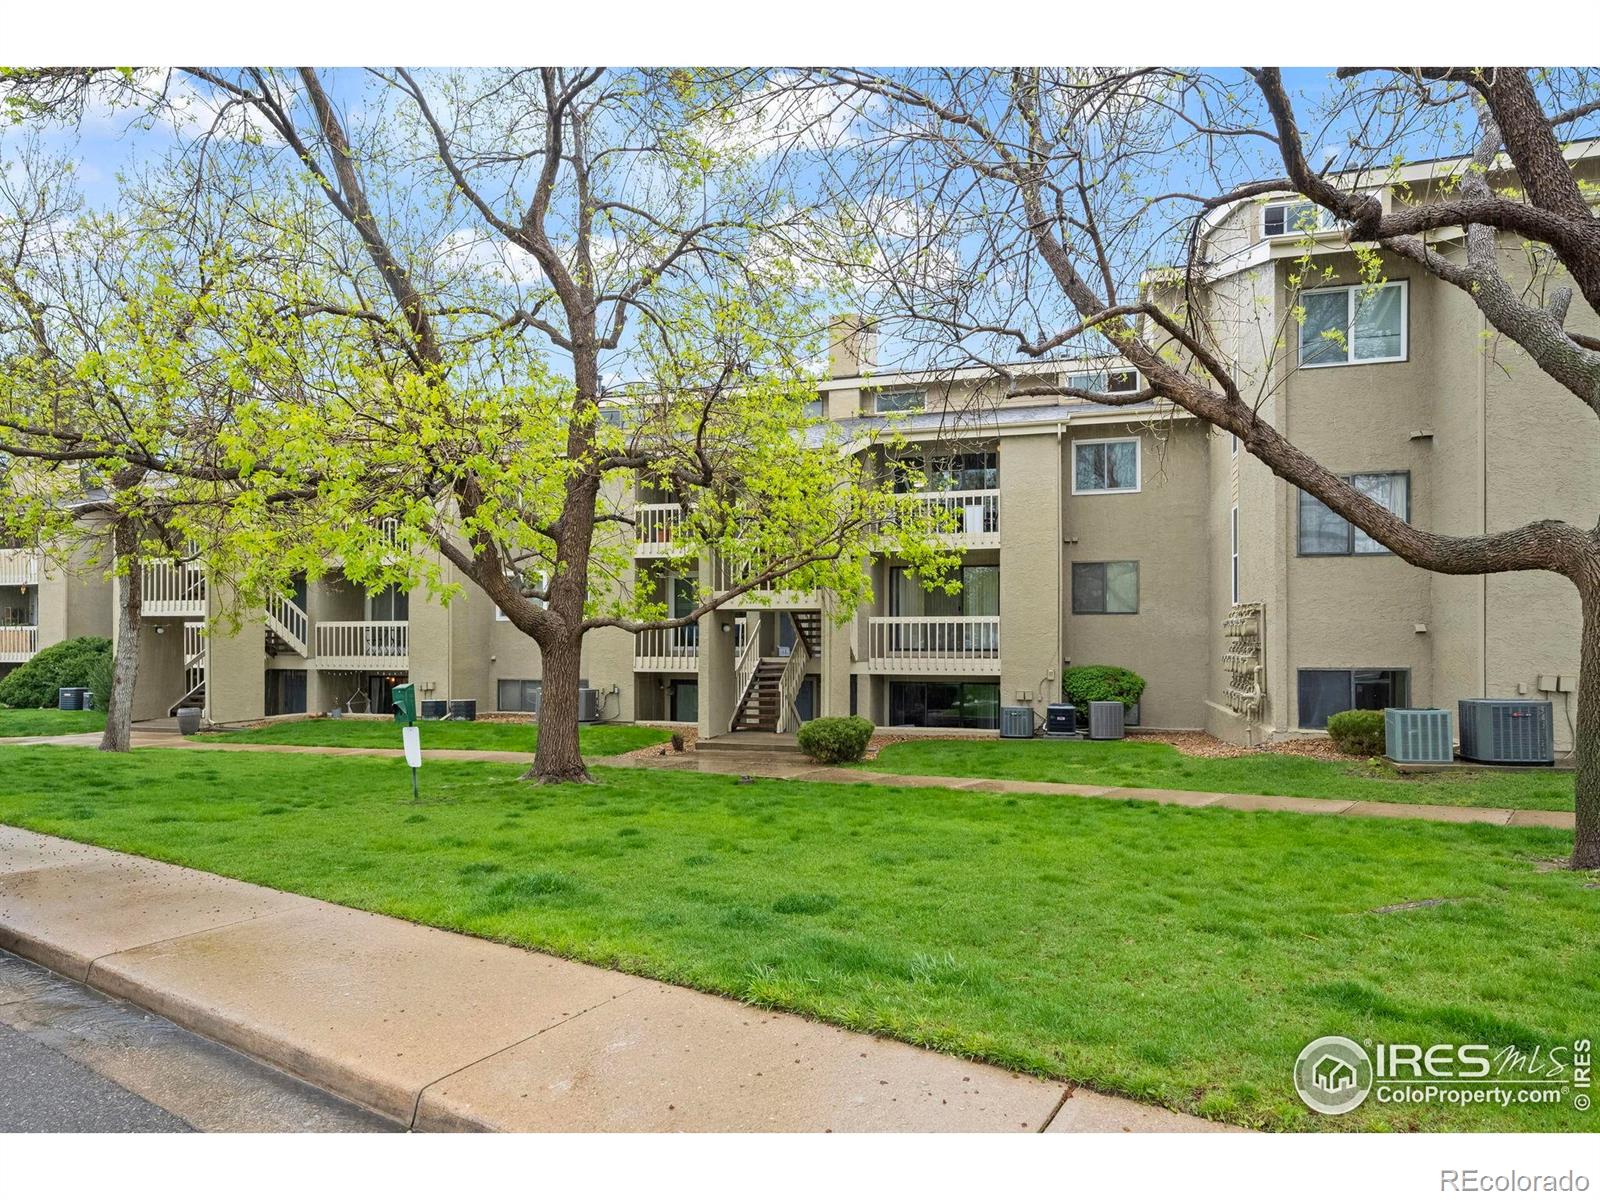
Active
$549,000
2
bds
|
1
ba
|
1,230
sqft
|
built
1984
3805 Northbrook Dr, Boulder, CO 80304
$-1,358
Cash flow
-12.9%
Cash-on-Cash Return
2.7%
Cap rate
0.5%
Rent to Value Ratio
Active
$419,000
2
bds
|
3
ba
|
1,178
sqft
|
built
2019
1240 Wren Ct, Longmont, CO 80501
$-774
Cash flow
-9.6%
Cash-on-Cash Return
3.5%
Cap rate
0.6%
Rent to Value Ratio
Active
$6,450,000
6
bds
|
10
ba
|
10,189
sqft
|
built
2001
8001 Fairview Rd, Boulder, CO 80303
$-27,681
Cash flow
-22.4%
Cash-on-Cash Return
0.5%
Cap rate
0.1%
Rent to Value Ratio
Active
$355,000
3
bds
|
2
ba
|
1,320
sqft
|
built
2017
804 Summer Hawk Dr, Longmont, CO 80504
$-663
Cash flow
-9.7%
Cash-on-Cash Return
3.4%
Cap rate
0.6%
Rent to Value Ratio
Active
$735,000
2
bds
|
2
ba
|
1,538
sqft
|
built
2003
1200 Yarmouth Ave, Boulder, CO 80304
$-1,852
Cash flow
-13.1%
Cash-on-Cash Return
2.7%
Cap rate
0.5%
Rent to Value Ratio
Active
$2,395,000
6
bds
|
7
ba
|
6,828
sqft
|
built
2018
8680 Summerlin Pl, Longmont, CO 80503
$-5,742
Cash flow
-12.5%
Cash-on-Cash Return
2.8%
Cap rate
0.4%
Rent to Value Ratio
Active
$345,000
3
bds
|
2
ba
|
1,300
sqft
|
built
2018
804 Summer Hawk Dr, Longmont, CO 80504
$-827
Cash flow
-12.5%
Cash-on-Cash Return
2.8%
Cap rate
0.6%
Rent to Value Ratio
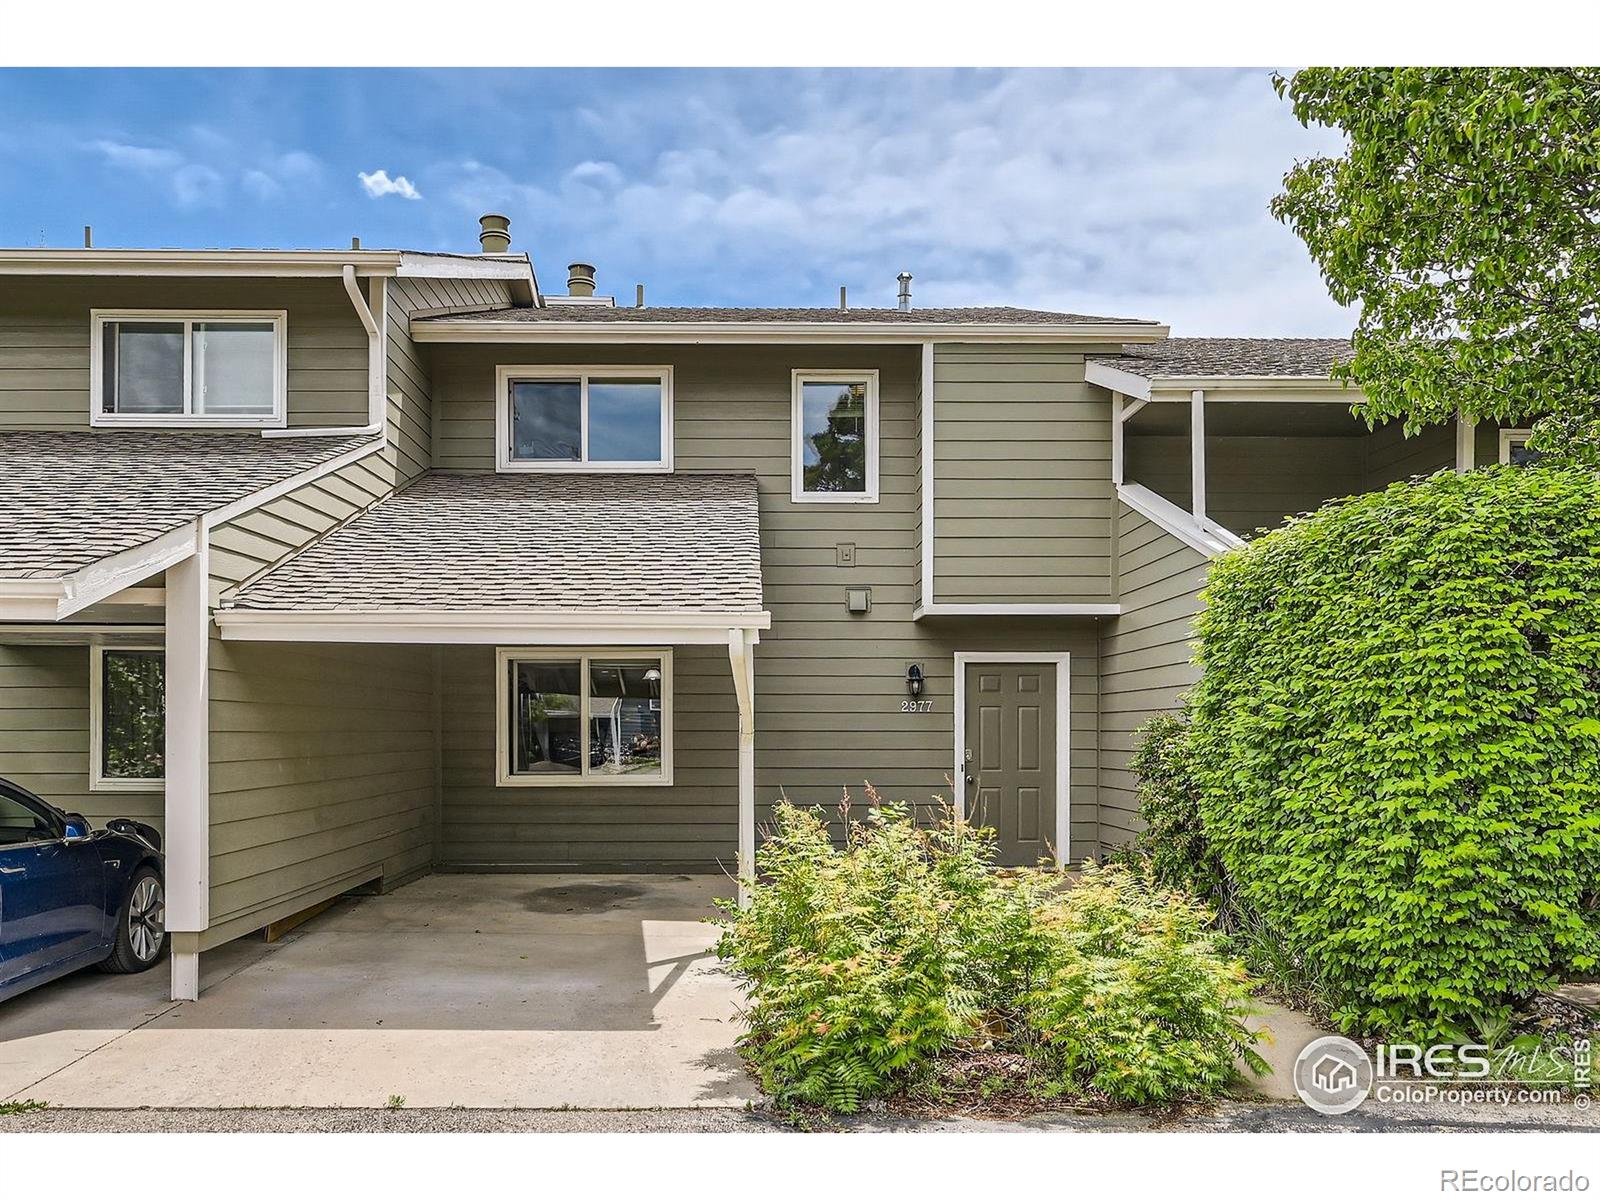
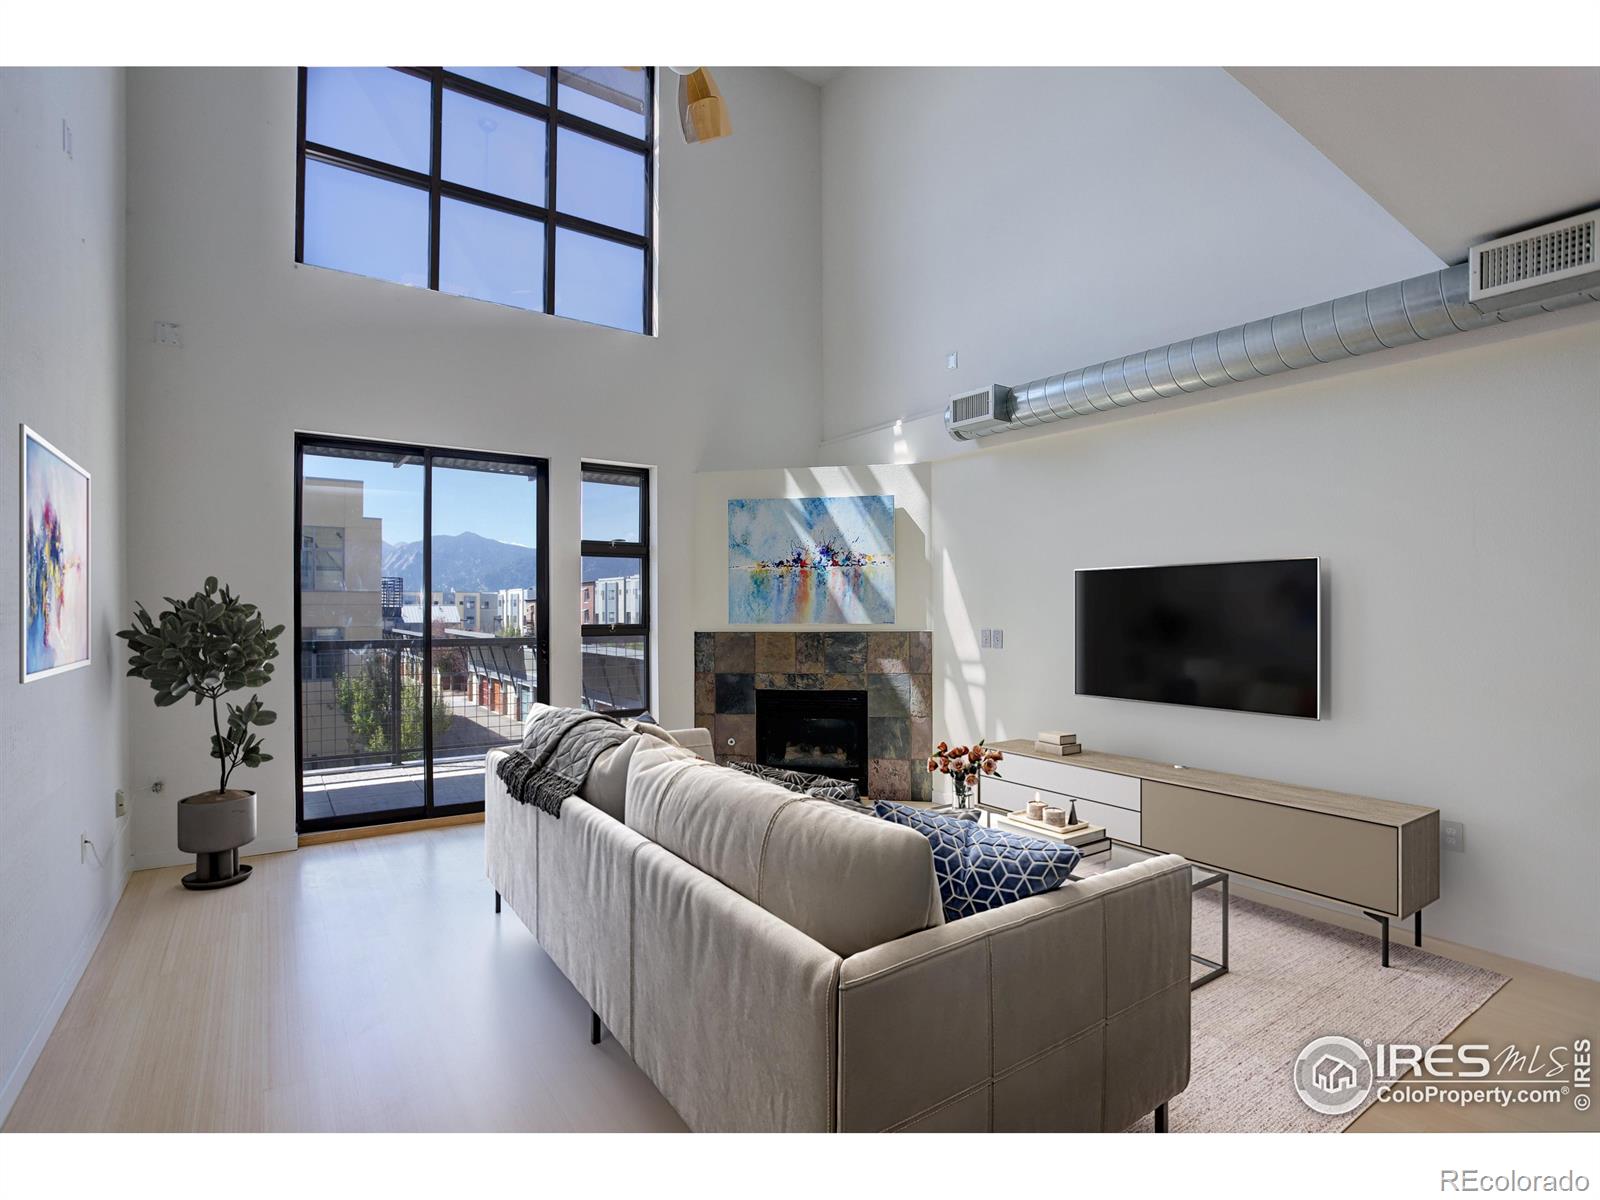
Active
$675,000
3
bds
|
3
ba
|
1,566
sqft
|
built
1979
2977 Eagle Way, Boulder, CO 80301
$-1,964
Cash flow
-15.2%
Cash-on-Cash Return
2.2%
Cap rate
0.4%
Rent to Value Ratio
Active
$419,000
3
bds
|
1
ba
|
1,440
sqft
|
built
1969
147 Dawson Pl, Longmont, CO 80504
$-459
Cash flow
-5.7%
Cash-on-Cash Return
4.4%
Cap rate
0.6%
Rent to Value Ratio
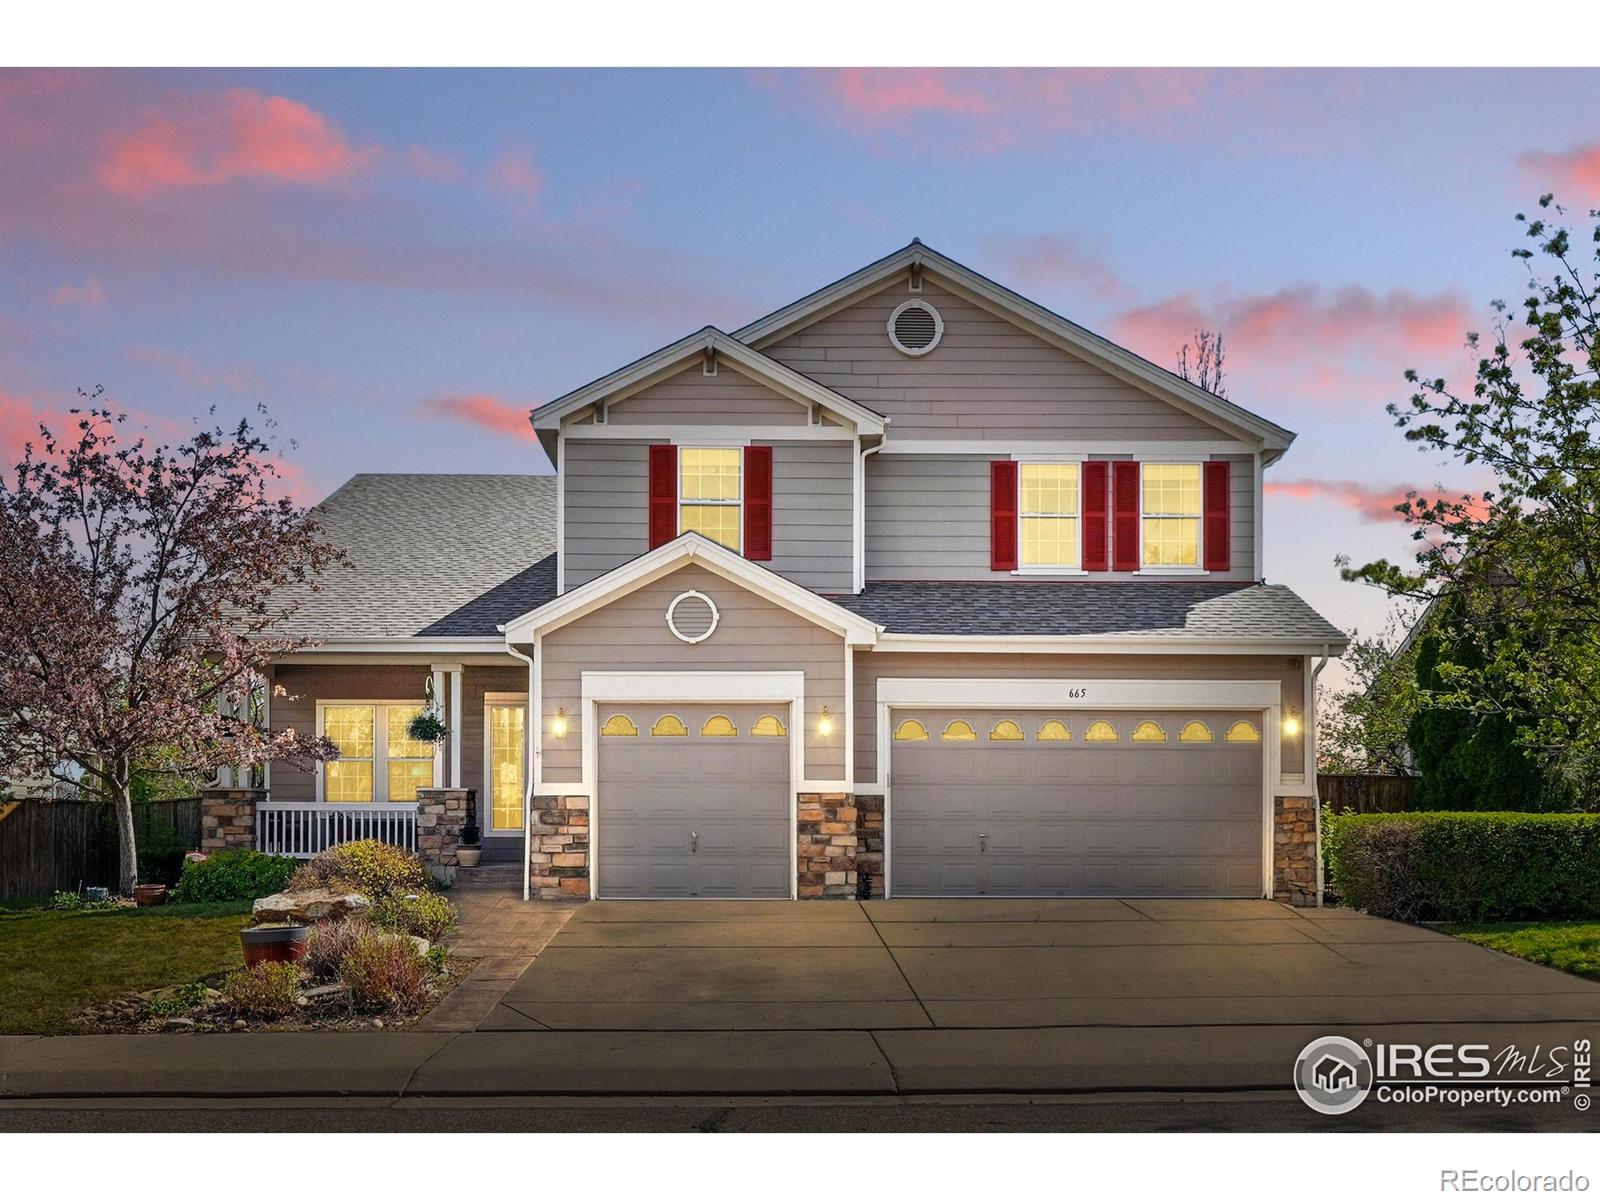
Active
$895,000
6
bds
|
4
ba
|
4,995
sqft
|
built
2001
665 Glenarbor Cir, Longmont, CO 80504
$-2,278
Cash flow
-13.3%
Cash-on-Cash Return
2.6%
Cap rate
0.4%
Rent to Value Ratio
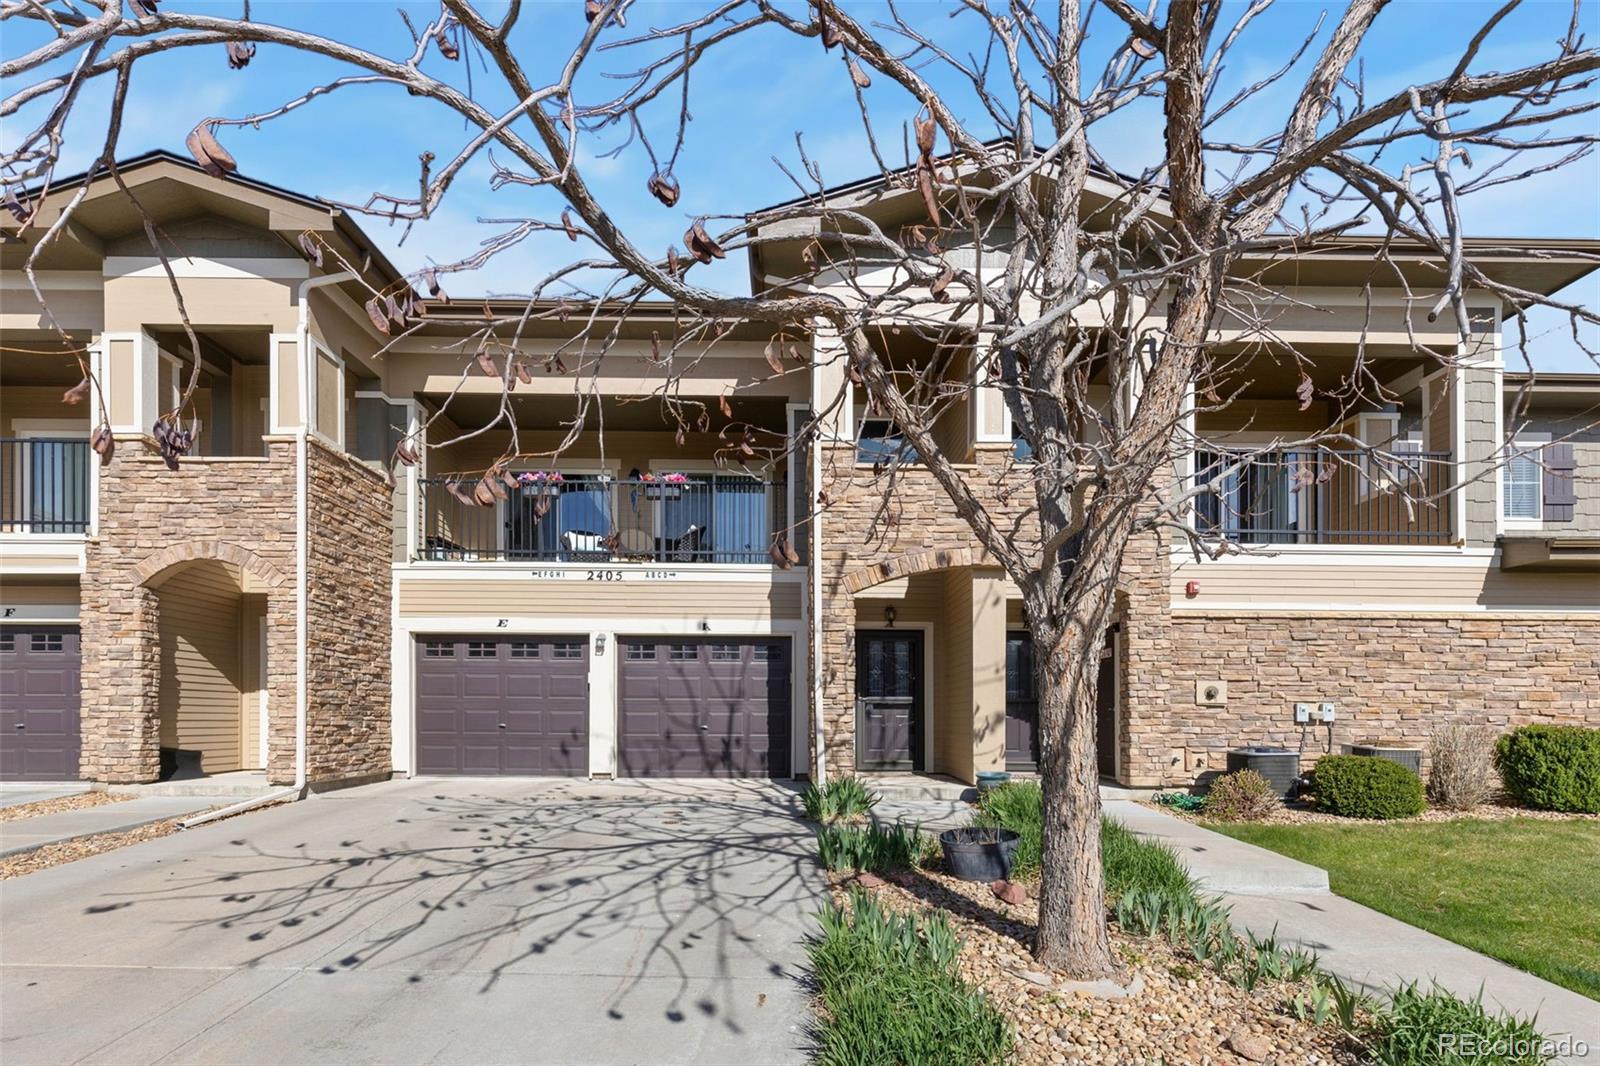
Active
$379,900
2
bds
|
2
ba
|
1,414
sqft
|
built
2010
2405 Calais Dr, Longmont, CO 80504
$-752
Cash flow
-10.3%
Cash-on-Cash Return
3.3%
Cap rate
0.6%
Rent to Value Ratio
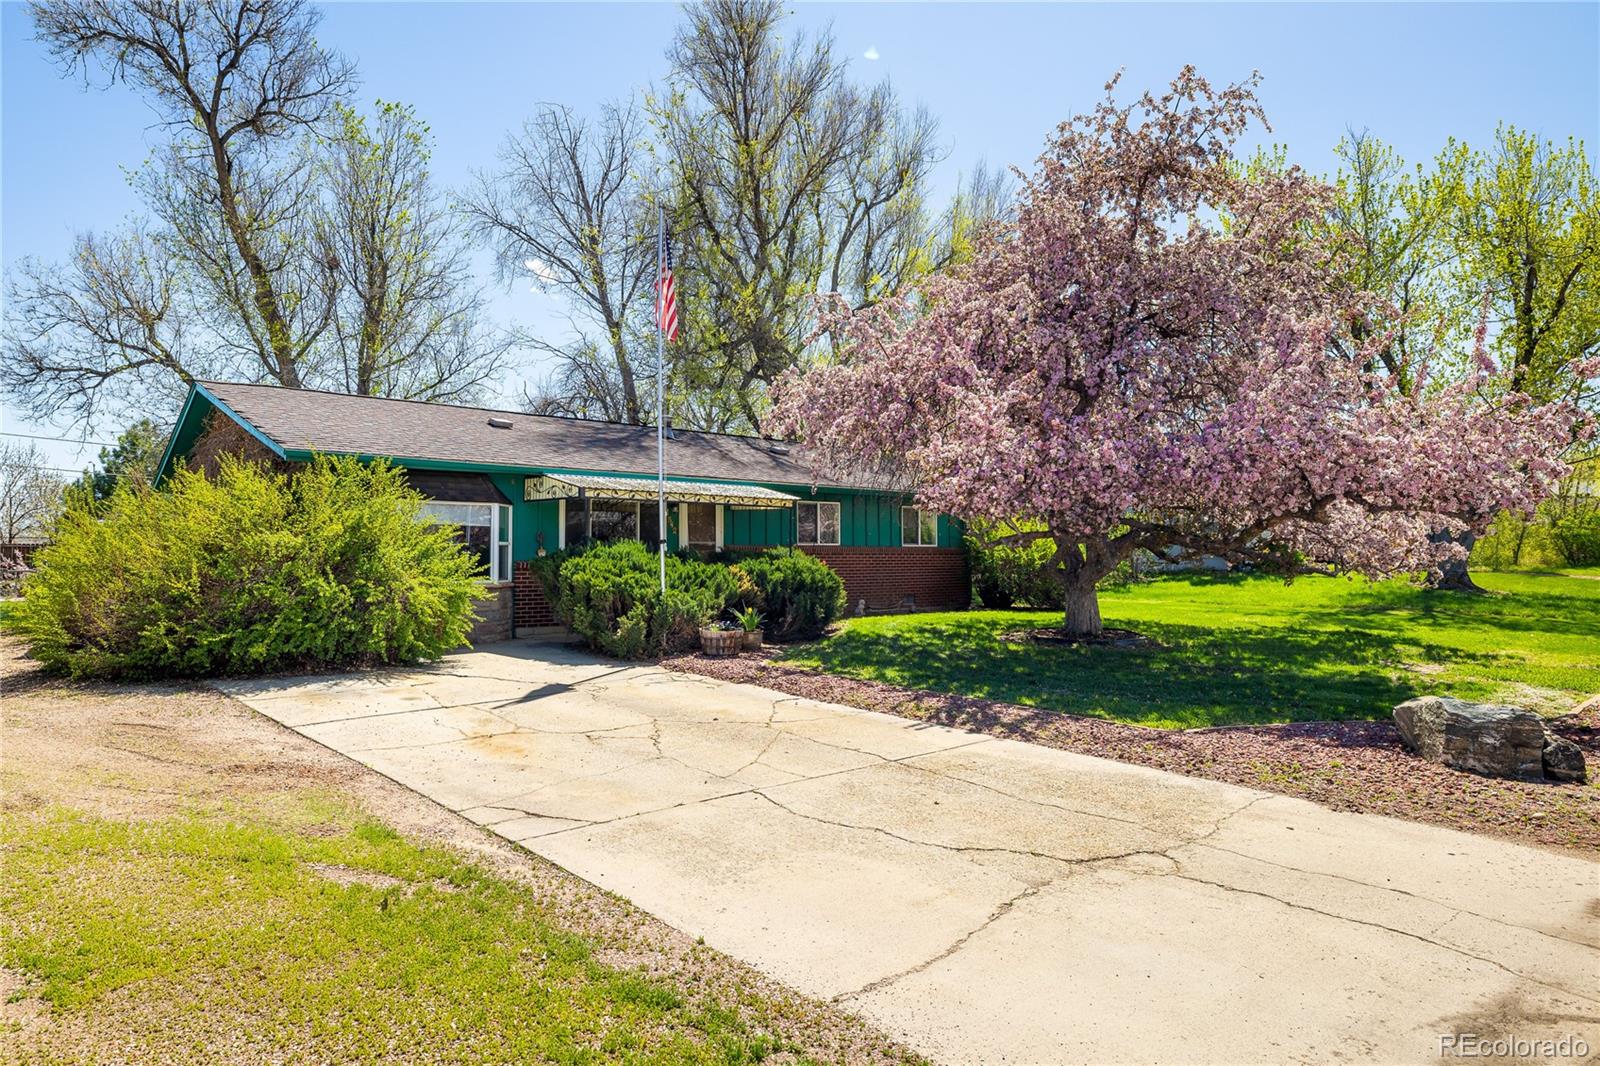
Active
$940,000
2
bds
|
1
ba
|
1,172
sqft
|
built
1958
1891 Orchard Ave, Boulder, CO 80304
$-2,461
Cash flow
-13.7%
Cash-on-Cash Return
2.5%
Cap rate
0.4%
Rent to Value Ratio
Active
$595,000
3
bds
|
1
ba
|
1,248
sqft
|
built
1965
1542 Kilkenny St, Boulder, CO 80303
$-1,278
Cash flow
-11.2%
Cash-on-Cash Return
3.1%
Cap rate
0.4%
Rent to Value Ratio

Active
$1,699,900
4
bds
|
3
ba
|
2,224
sqft
|
built
1967
3410 Heidelberg Dr, Boulder, CO 80305
$-5,986
Cash flow
-18.4%
Cash-on-Cash Return
1.5%
Cap rate
0.2%
Rent to Value Ratio
Active
$11,250,000
4
bds
|
5
ba
|
7,016
sqft
|
built
1964
1530 Timber Ln, Boulder, CO 80304
$-52,452
Cash flow
-24.3%
Cash-on-Cash Return
0.1%
Cap rate
0.1%
Rent to Value Ratio
Active
$585,000
3
bds
|
3
ba
|
2,150
sqft
|
built
1958
1211 16th Ave, Longmont, CO 80501
$-1,022
Cash flow
-9.1%
Cash-on-Cash Return
3.6%
Cap rate
0.5%
Rent to Value Ratio
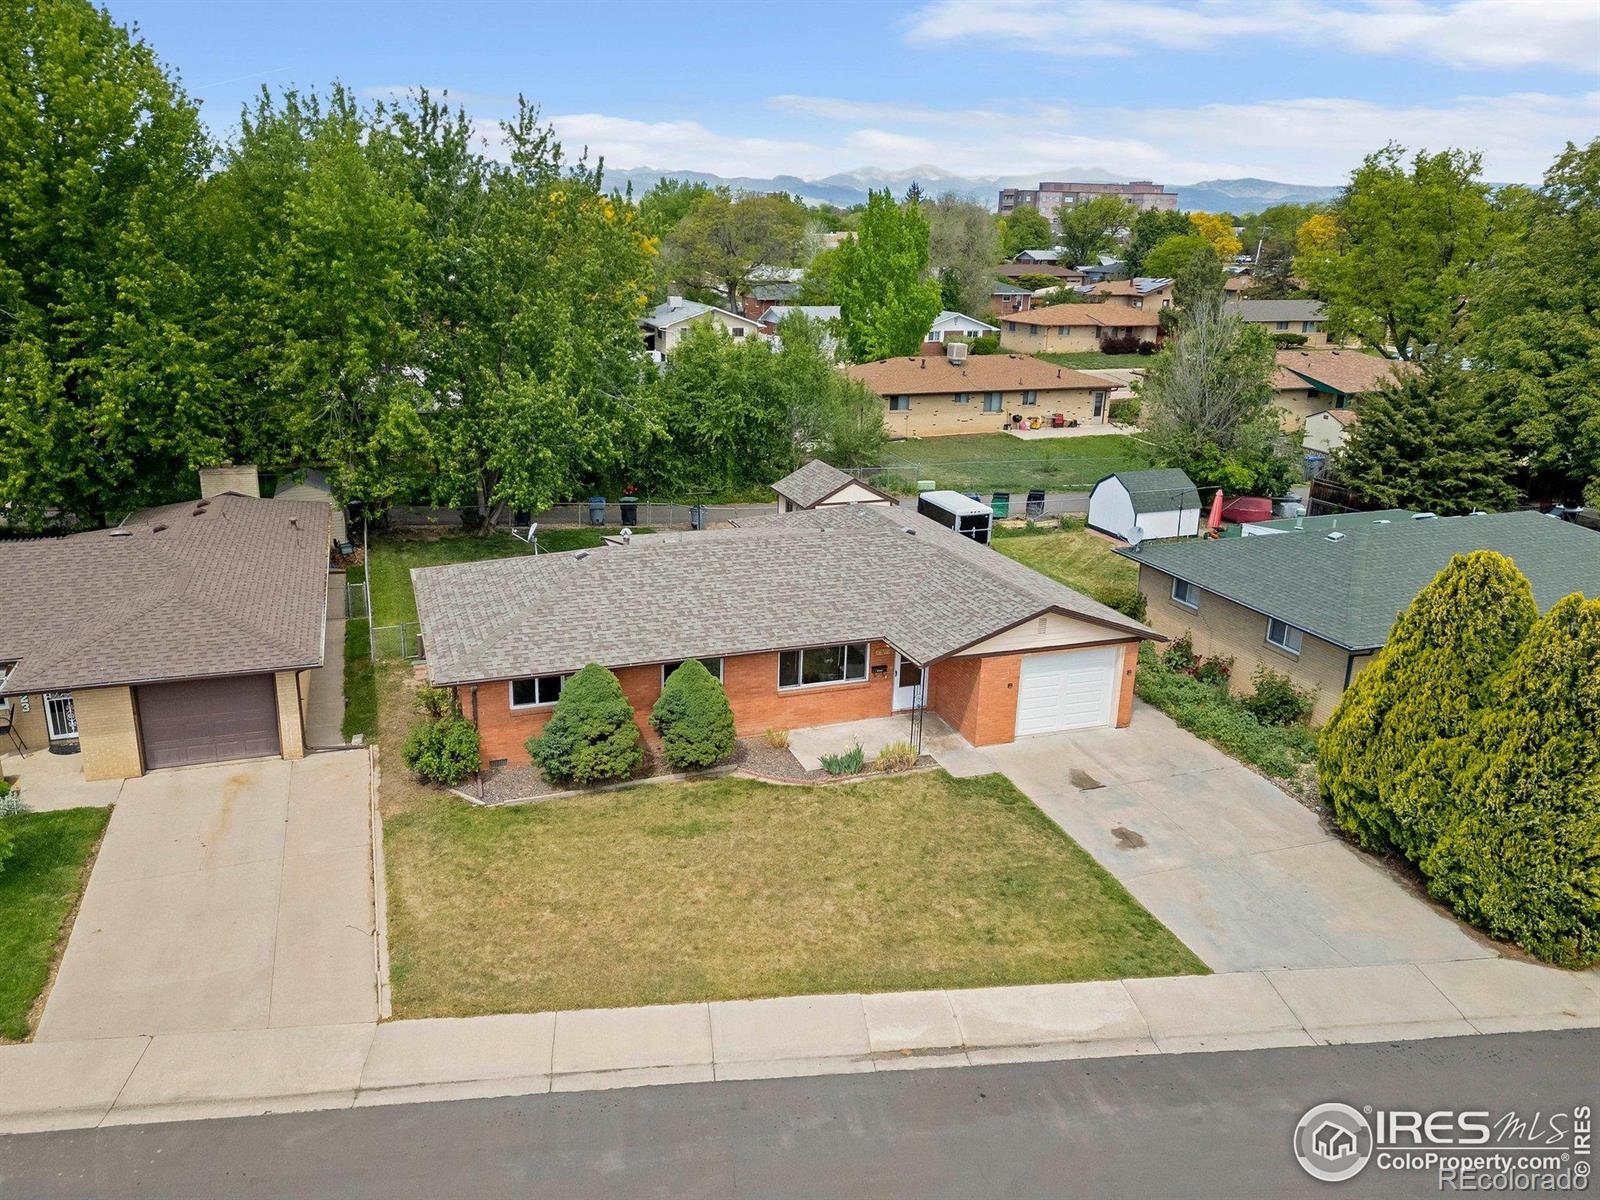
Active under contract
$510,000
4
bds
|
2
ba
|
1,404
sqft
|
built
1964
1229 Juniper St, Longmont, CO 80501
$-941
Cash flow
-9.6%
Cash-on-Cash Return
3.5%
Cap rate
0.5%
Rent to Value Ratio
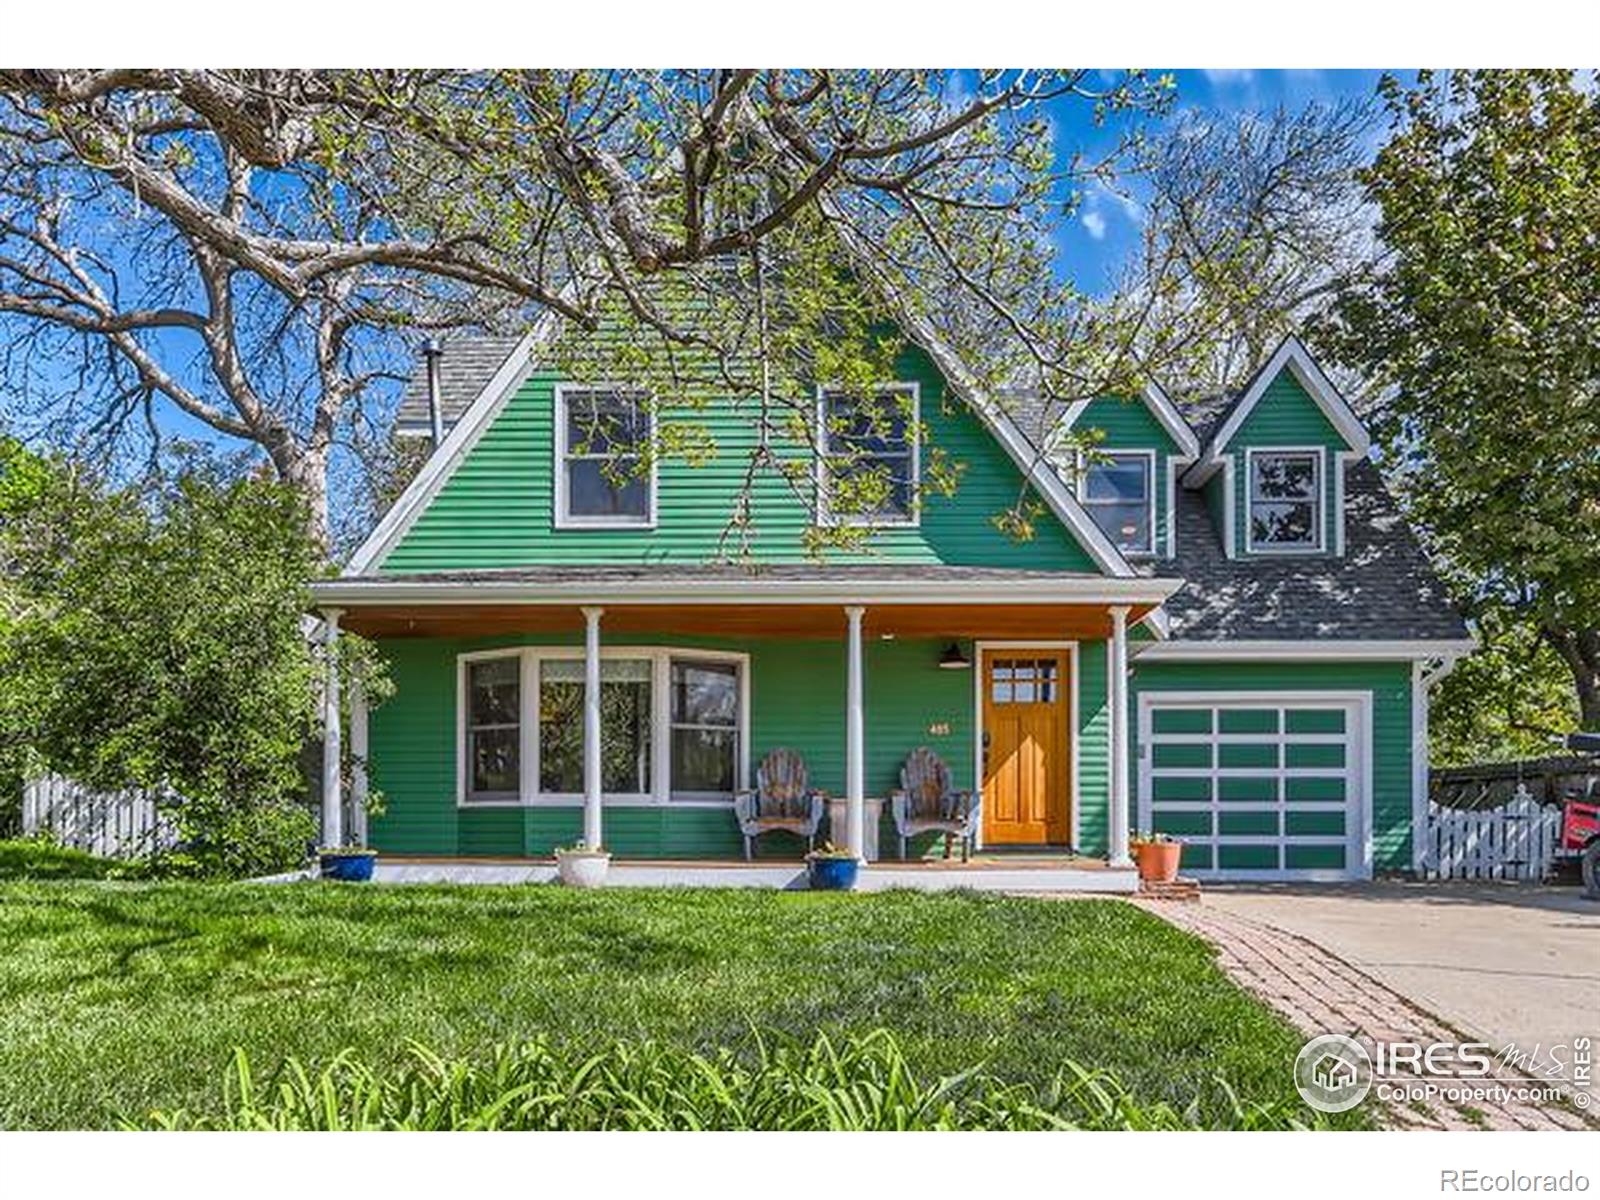
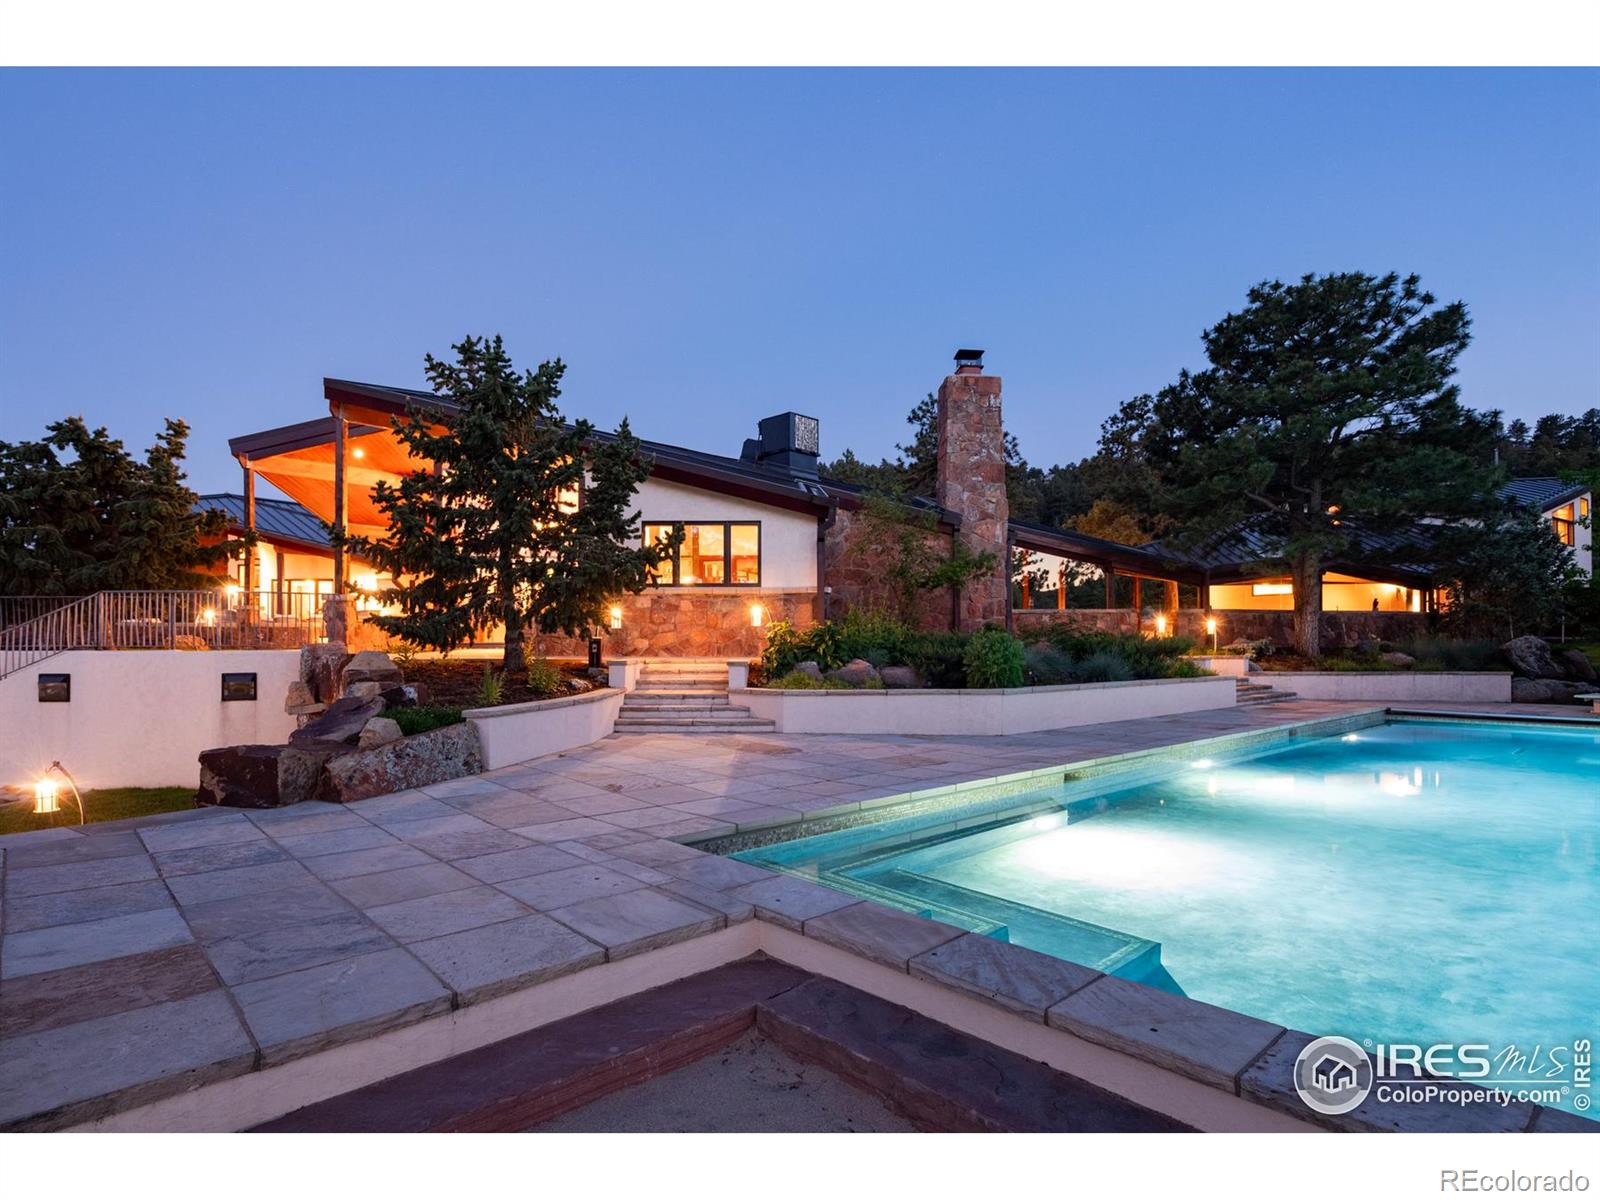
Active
$1,695,000
3
bds
|
3
ba
|
2,088
sqft
|
built
1956
485 Grape Ave, Boulder, CO 80304
$-5,239
Cash flow
-16.1%
Cash-on-Cash Return
2.0%
Cap rate
0.3%
Rent to Value Ratio
Active
$1,345,000
4
bds
|
4
ba
|
5,072
sqft
|
built
1999
2050 Emerald Dr, Longmont, CO 80504
$-4,338
Cash flow
-16.8%
Cash-on-Cash Return
1.8%
Cap rate
0.3%
Rent to Value Ratio
Active
$3,750,000
4
bds
|
5
ba
|
6,465
sqft
|
built
2000
15789 N 83rd St, Longmont, CO 80503
$-13,536
Cash flow
-18.8%
Cash-on-Cash Return
1.3%
Cap rate
0.2%
Rent to Value Ratio
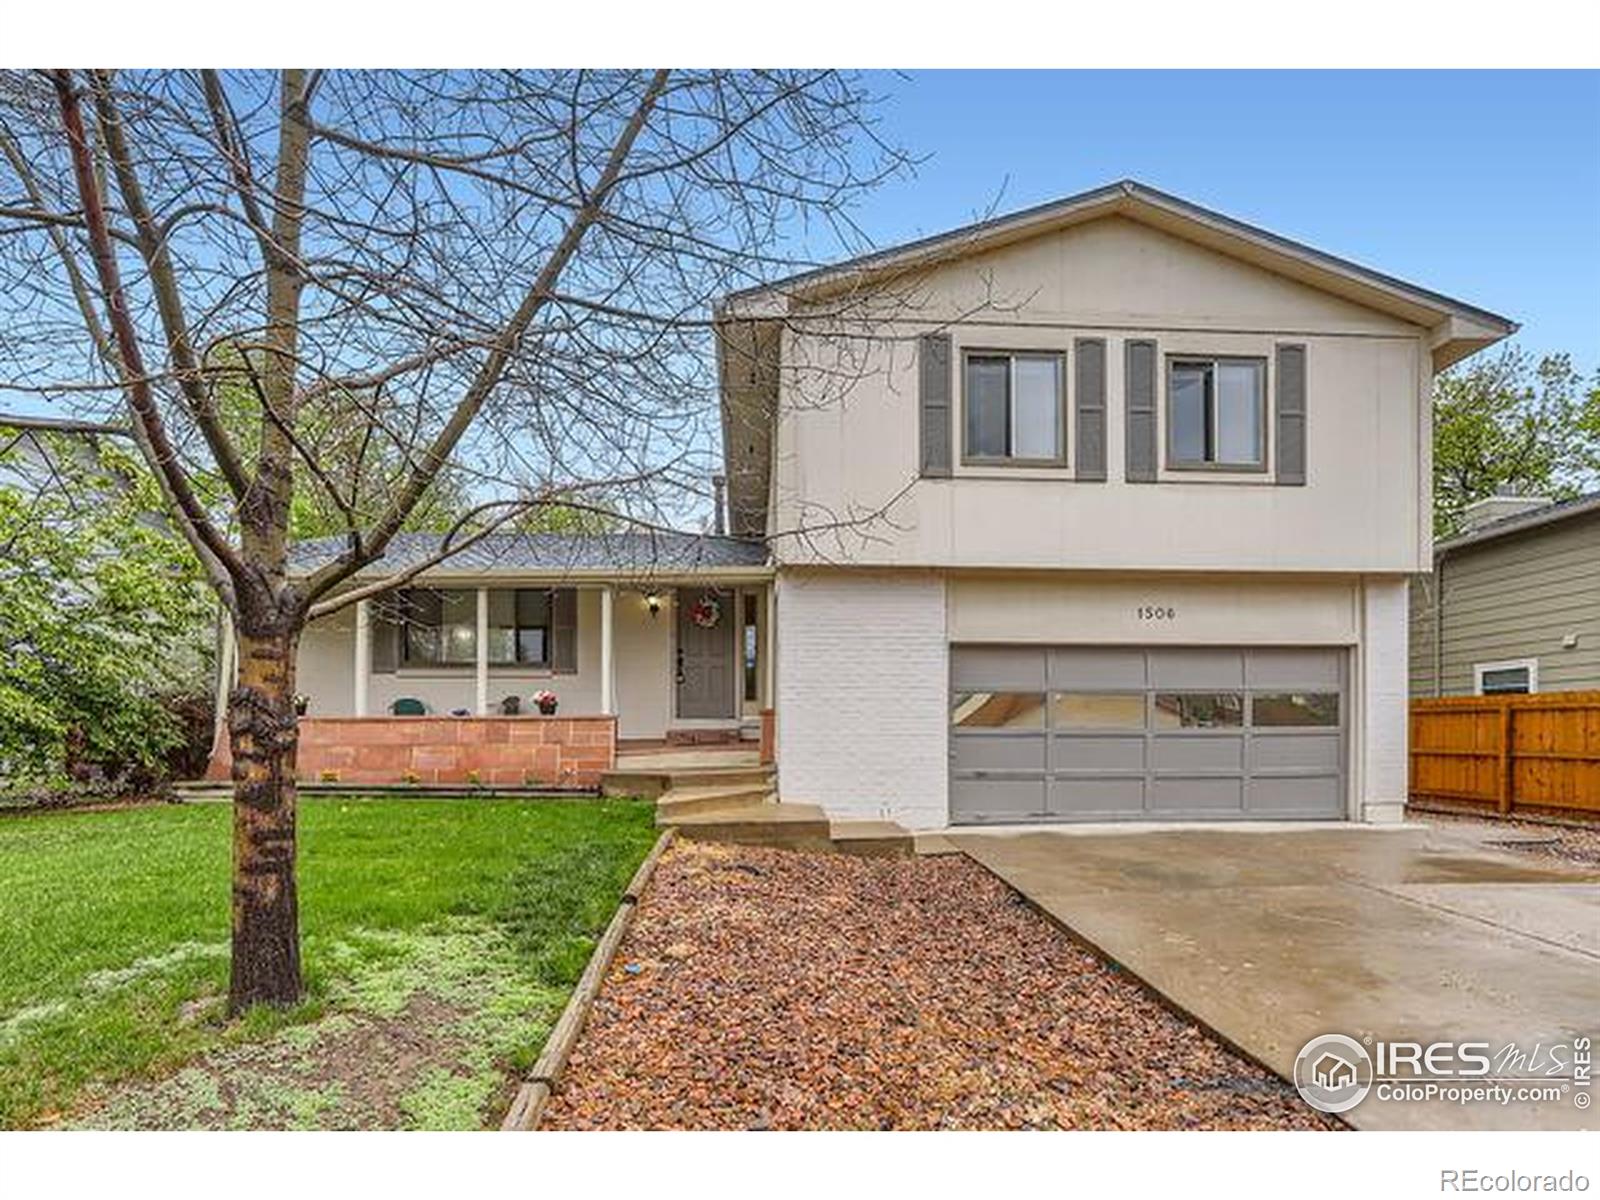
Active
$660,000
4
bds
|
3
ba
|
2,657
sqft
|
built
1983
1506 Fisk Ct, Longmont, CO 80503
$-1,286
Cash flow
-10.2%
Cash-on-Cash Return
3.3%
Cap rate
0.5%
Rent to Value Ratio