Denver County Investment Properties for Sale
Browse homes for sale and investment properties in Denver County. Refine your search by price, property type, or more.
Best cash flowing properties in Denver County
Active
$211,000
0
bds
|
1
ba
|
422
sqft
|
built
1971
65 N Clarkson St, Denver, CO 80218
$-194
Cash flow
-4.8%
Cash-on-Cash Return
4.6%
Cap rate
0.8%
Rent to Value Ratio
Active
$300,000
2
bds
|
2
ba
|
1,249
sqft
|
built
2005
5800 Tower Rd, Denver, CO 80249
$-416
Cash flow
-7.2%
Cash-on-Cash Return
4.0%
Cap rate
0.7%
Rent to Value Ratio
1,810 out of 1,906 properties for sale in Denver County
Limited Results Shown
Create a free account, or log in to reveal all property listings and enjoy the complete experience.
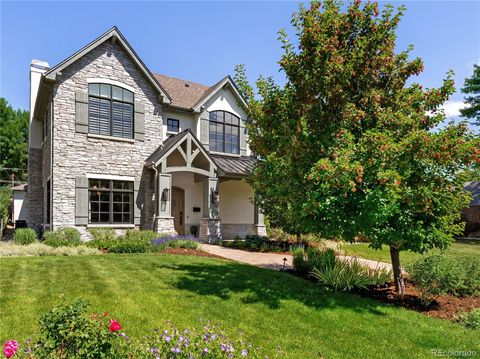
Active
$1,350,000
6
bds
|
5
ba
|
4,362
sqft
|
built
1967
3821 S Magnolia Way, Denver, CO 80237
$-4,066
Cash flow
-15.7%
Cash-on-Cash Return
2.1%
Cap rate
0.3%
Rent to Value Ratio

Active
$499,000
2
bds
|
2
ba
|
1,164
sqft
|
built
2006
410 Acoma St, Denver, CO 80204
$-1,422
Cash flow
-14.9%
Cash-on-Cash Return
2.3%
Cap rate
0.6%
Rent to Value Ratio
Active
$469,999
4
bds
|
3
ba
|
2,114
sqft
|
built
1967
3210 S Oneida Way, Denver, CO 80224
$-1,074
Cash flow
-11.9%
Cash-on-Cash Return
2.9%
Cap rate
0.6%
Rent to Value Ratio
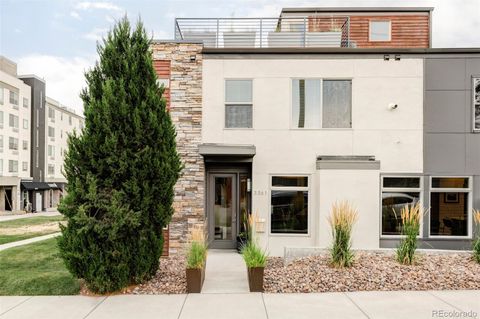
Active
$1,185,000
4
bds
|
3
ba
|
2,070
sqft
|
built
2013
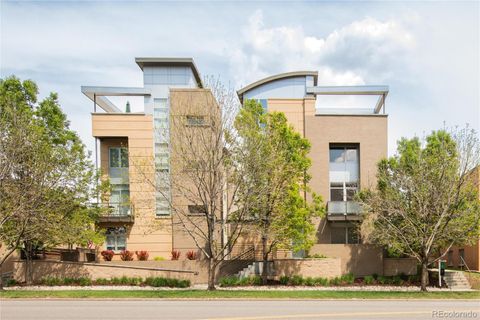
3361 Mariposa St, Denver, CO 80211
$-2,540
Cash flow
-11.2%
Cash-on-Cash Return
3.1%
Cap rate
0.4%
Rent to Value Ratio
Active
$1,995,000
4
bds
|
4
ba
|
4,855
sqft
|
built
2006
852 Pontiac St, Denver, CO 80220
$-4,776
Cash flow
-12.5%
Cash-on-Cash Return
2.8%
Cap rate
0.4%
Rent to Value Ratio
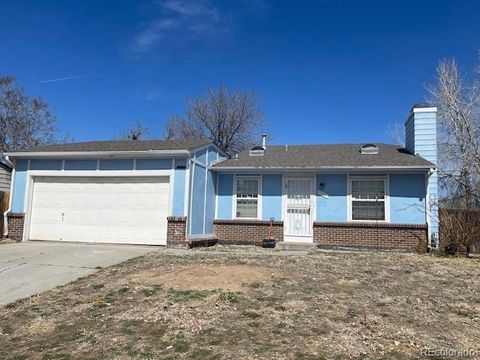
Active
$437,200
4
bds
|
2
ba
|
1,661
sqft
|
built
1980
14425 Albrook Dr, Denver, CO 80239
$-497
Cash flow
-5.9%
Cash-on-Cash Return
4.3%
Cap rate
0.6%
Rent to Value Ratio
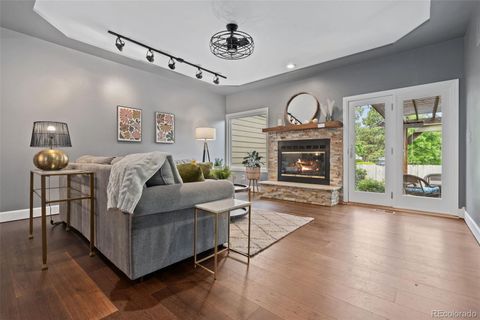
Active
$634,000
4
bds
|
4
ba
|
2,971
sqft
|
built
1988
10000 E Yale Ave, Denver, CO 80231
$-1,152
Cash flow
-9.5%
Cash-on-Cash Return
3.5%
Cap rate
0.6%
Rent to Value Ratio
Active
$525,000
3
bds
|
4
ba
|
1,896
sqft
|
built
2014
3612 Hudson St, Denver, CO 80207
$-681
Cash flow
-6.8%
Cash-on-Cash Return
4.1%
Cap rate
0.6%
Rent to Value Ratio
Active
$540,052
5
bds
|
3
ba
|
3,396
sqft
|
built
2005
21476 E 53rd Pl, Denver, CO 80249
$-875
Cash flow
-8.5%
Cash-on-Cash Return
3.7%
Cap rate
0.5%
Rent to Value Ratio
Active
$605,900
4
bds
|
3
ba
|
2,389
sqft
|
built
1974
2743 S Reading Ct, Denver, CO 80231
$-751
Cash flow
-6.5%
Cash-on-Cash Return
4.2%
Cap rate
0.6%
Rent to Value Ratio
Active
$2,595,000
4
bds
|
4
ba
|
4,407
sqft
|
built
1987
3000 E Cedar Ave, Denver, CO 80209
$-7,974
Cash flow
-16.0%
Cash-on-Cash Return
2.0%
Cap rate
0.3%
Rent to Value Ratio
Active
$749,000
3
bds
|
4
ba
|
2,524
sqft
|
built
2008
2314 S University Blvd, Denver, CO 80210
$-1,557
Cash flow
-10.8%
Cash-on-Cash Return
3.2%
Cap rate
0.5%
Rent to Value Ratio
Active
$625,000
2
bds
|
2
ba
|
1,205
sqft
|
built
1979
1551 Larimer St, Denver, CO 80202
$-2,124
Cash flow
-17.7%
Cash-on-Cash Return
1.6%
Cap rate
0.4%
Rent to Value Ratio

Active
$725,000
4
bds
|
3
ba
|
3,002
sqft
|
built
1996
1011 S Valentia St, Denver, CO 80247
$-1,679
Cash flow
-12.1%
Cash-on-Cash Return
2.9%
Cap rate
0.5%
Rent to Value Ratio
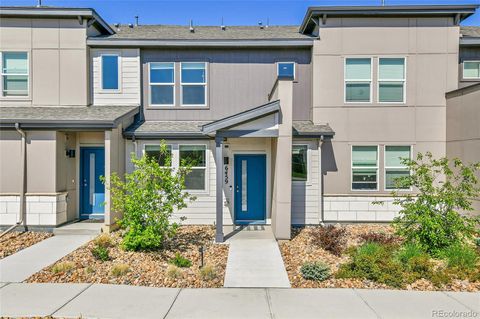
Active
$410,000
3
bds
|
3
ba
|
1,443
sqft
|
built
2023
6459 N Dunkirk St, Denver, CO 80249
$-615
Cash flow
-7.8%
Cash-on-Cash Return
3.9%
Cap rate
0.6%
Rent to Value Ratio
Active
$405,000
1
bds
|
1
ba
|
826
sqft
|
built
2003
1440 Little Raven St, Denver, CO 80202
$-1,009
Cash flow
-13.0%
Cash-on-Cash Return
2.7%
Cap rate
0.5%
Rent to Value Ratio
Active
$1,097,500
3
bds
|
3
ba
|
2,082
sqft
|
built
1903
432 N Ogden St, Denver, CO 80218
$-2,499
Cash flow
-11.9%
Cash-on-Cash Return
2.9%
Cap rate
0.4%
Rent to Value Ratio
Active
$730,000
3
bds
|
2
ba
|
1,799
sqft
|
built
1942
3532 N Fillmore St, Denver, CO 80205
$-2,126
Cash flow
-15.2%
Cash-on-Cash Return
2.2%
Cap rate
0.3%
Rent to Value Ratio
Active
$599,000
1
bds
|
1
ba
|
1,027
sqft
|
built
1933
2500 Walnut St, Denver, CO 80205
$-1,570
Cash flow
-13.7%
Cash-on-Cash Return
2.5%
Cap rate
0.5%
Rent to Value Ratio
Active
$379,900
2
bds
|
2
ba
|
1,166
sqft
|
built
1986
1470 S Quebec Way, Denver, CO 80231
$-872
Cash flow
-12.0%
Cash-on-Cash Return
2.9%
Cap rate
0.6%
Rent to Value Ratio
Active
$800,000
3
bds
|
2
ba
|
1,909
sqft
|
built
1981
1777 Larimer St, Denver, CO 80202
$-3,236
Cash flow
-21.1%
Cash-on-Cash Return
0.8%
Cap rate
0.5%
Rent to Value Ratio
Active
$445,000
1
bds
|
1
ba
|
954
sqft
|
built
2005
3100 Huron St, Denver, CO 80202
$-976
Cash flow
-11.4%
Cash-on-Cash Return
3.0%
Cap rate
0.6%
Rent to Value Ratio
Active
$365,000
1
bds
|
1
ba
|
720
sqft
|
built
1967
1255 N Ogden St, Denver, CO 80218
$-1,232
Cash flow
-17.6%
Cash-on-Cash Return
1.6%
Cap rate
0.5%
Rent to Value Ratio
Active
$1,100,000
6
bds
|
4
ba
|
3,559
sqft
|
built
1957
3854 Perry St, Denver, CO 80212
$-3,163
Cash flow
-15.0%
Cash-on-Cash Return
2.2%
Cap rate
0.4%
Rent to Value Ratio
Active
$275,000
1
bds
|
1
ba
|
720
sqft
|
built
1966
1350 Josephine St, Denver, CO 80206
$-638
Cash flow
-12.1%
Cash-on-Cash Return
2.9%
Cap rate
0.7%
Rent to Value Ratio
Active
$1,950,000
6
bds
|
5
ba
|
4,903
sqft
|
built
2001
2411 S Garfield St, Denver, CO 80210
$-5,555
Cash flow
-14.9%
Cash-on-Cash Return
2.3%
Cap rate
0.3%
Rent to Value Ratio
Active
$1,749,000
3
bds
|
4
ba
|
4,514
sqft
|
built
1940
5530 E 6th Avenue Pkwy, Denver, CO 80220
$-4,827
Cash flow
-14.4%
Cash-on-Cash Return
2.4%
Cap rate
0.4%
Rent to Value Ratio
Active
$4,850,000
4
bds
|
6
ba
|
5,324
sqft
|
built
2015
2539 E 5th Ave, Denver, CO 80206
$-18,984
Cash flow
-20.4%
Cash-on-Cash Return
1.0%
Cap rate
0.2%
Rent to Value Ratio
Active
$2,325,000
4
bds
|
6
ba
|
4,045
sqft
|
built
2007
512 Cook St, Denver, CO 80206
$-8,074
Cash flow
-18.1%
Cash-on-Cash Return
1.5%
Cap rate
0.2%
Rent to Value Ratio
Active
$274,900
1
bds
|
1
ba
|
690
sqft
|
built
1938
444 17th St, Denver, CO 80202
$-773
Cash flow
-14.7%
Cash-on-Cash Return
2.3%
Cap rate
0.5%
Rent to Value Ratio
Active
$719,500
4
bds
|
2
ba
|
1,580
sqft
|
built
1941
2634 S Humboldt St, Denver, CO 80210
$-1,521
Cash flow
-11.0%
Cash-on-Cash Return
3.1%
Cap rate
0.4%
Rent to Value Ratio
Active
$3,795,000
5
bds
|
6
ba
|
7,149
sqft
|
built
2007
295 Jersey St, Denver, CO 80220
$-15,151
Cash flow
-20.8%
Cash-on-Cash Return
0.9%
Cap rate
0.2%
Rent to Value Ratio
Active
$585,000
1
bds
|
2
ba
|
1,161
sqft
|
built
1928
1435 Wazee St, Denver, CO 80202
$-1,296
Cash flow
-11.6%
Cash-on-Cash Return
3.0%
Cap rate
0.5%
Rent to Value Ratio
Active
$1,400,000
3
bds
|
4
ba
|
3,141
sqft
|
built
1890
1928 S Washington St, Denver, CO 80210
$-2,883
Cash flow
-10.7%
Cash-on-Cash Return
3.2%
Cap rate
0.4%
Rent to Value Ratio
Active
$1,706,250
7
bds
|
4
ba
|
3,958
sqft
|
built
1912
2900 W 32nd Ave, Denver, CO 80211
$-4,982
Cash flow
-15.2%
Cash-on-Cash Return
2.2%
Cap rate
0.3%
Rent to Value Ratio

Active
$352,000
2
bds
|
2
ba
|
1,509
sqft
|
built
1970
2815 S Locust St, Denver, CO 80222
$-530
Cash flow
-7.9%
Cash-on-Cash Return
3.9%
Cap rate
0.7%
Rent to Value Ratio
Active
$787,500
2
bds
|
3
ba
|
1,941
sqft
|
built
1981
1350 Lawrence St, Denver, CO 80204
$-2,747
Cash flow
-18.2%
Cash-on-Cash Return
1.5%
Cap rate
0.5%
Rent to Value Ratio
Active
$499,000
3
bds
|
4
ba
|
2,260
sqft
|
built
2017
19096 E 55th Ave, Denver, CO 80249
$-866
Cash flow
-9.1%
Cash-on-Cash Return
3.6%
Cap rate
0.6%
Rent to Value Ratio