Denver County Investment Properties for Sale
Browse homes for sale and investment properties in Denver County. Refine your search by price, property type, or more.
Best cash flowing properties in Denver County
Active
$230,000
1
bds
|
1
ba
|
804
sqft
|
built
1980
4896 S Dudley St, Littleton, CO 80123
$-290
Cash flow
-6.6%
Cash-on-Cash Return
4.2%
Cap rate
0.7%
Rent to Value Ratio
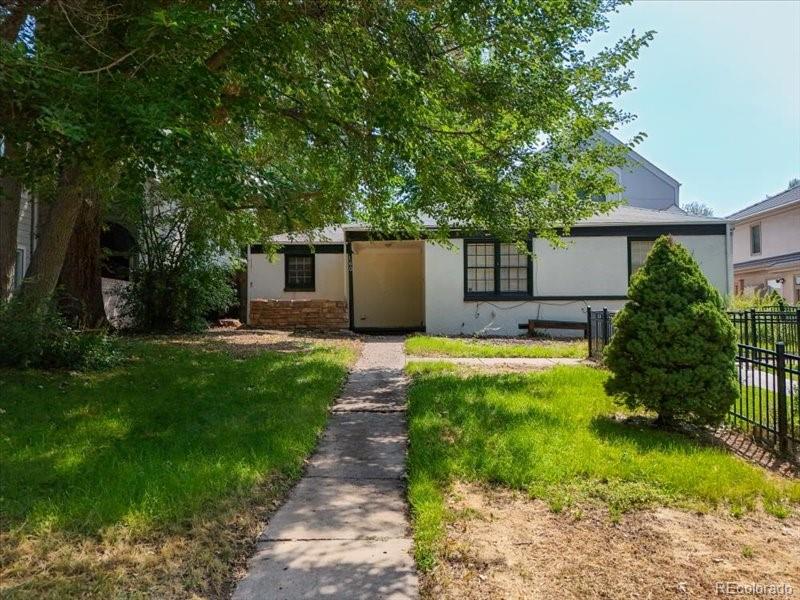
Active
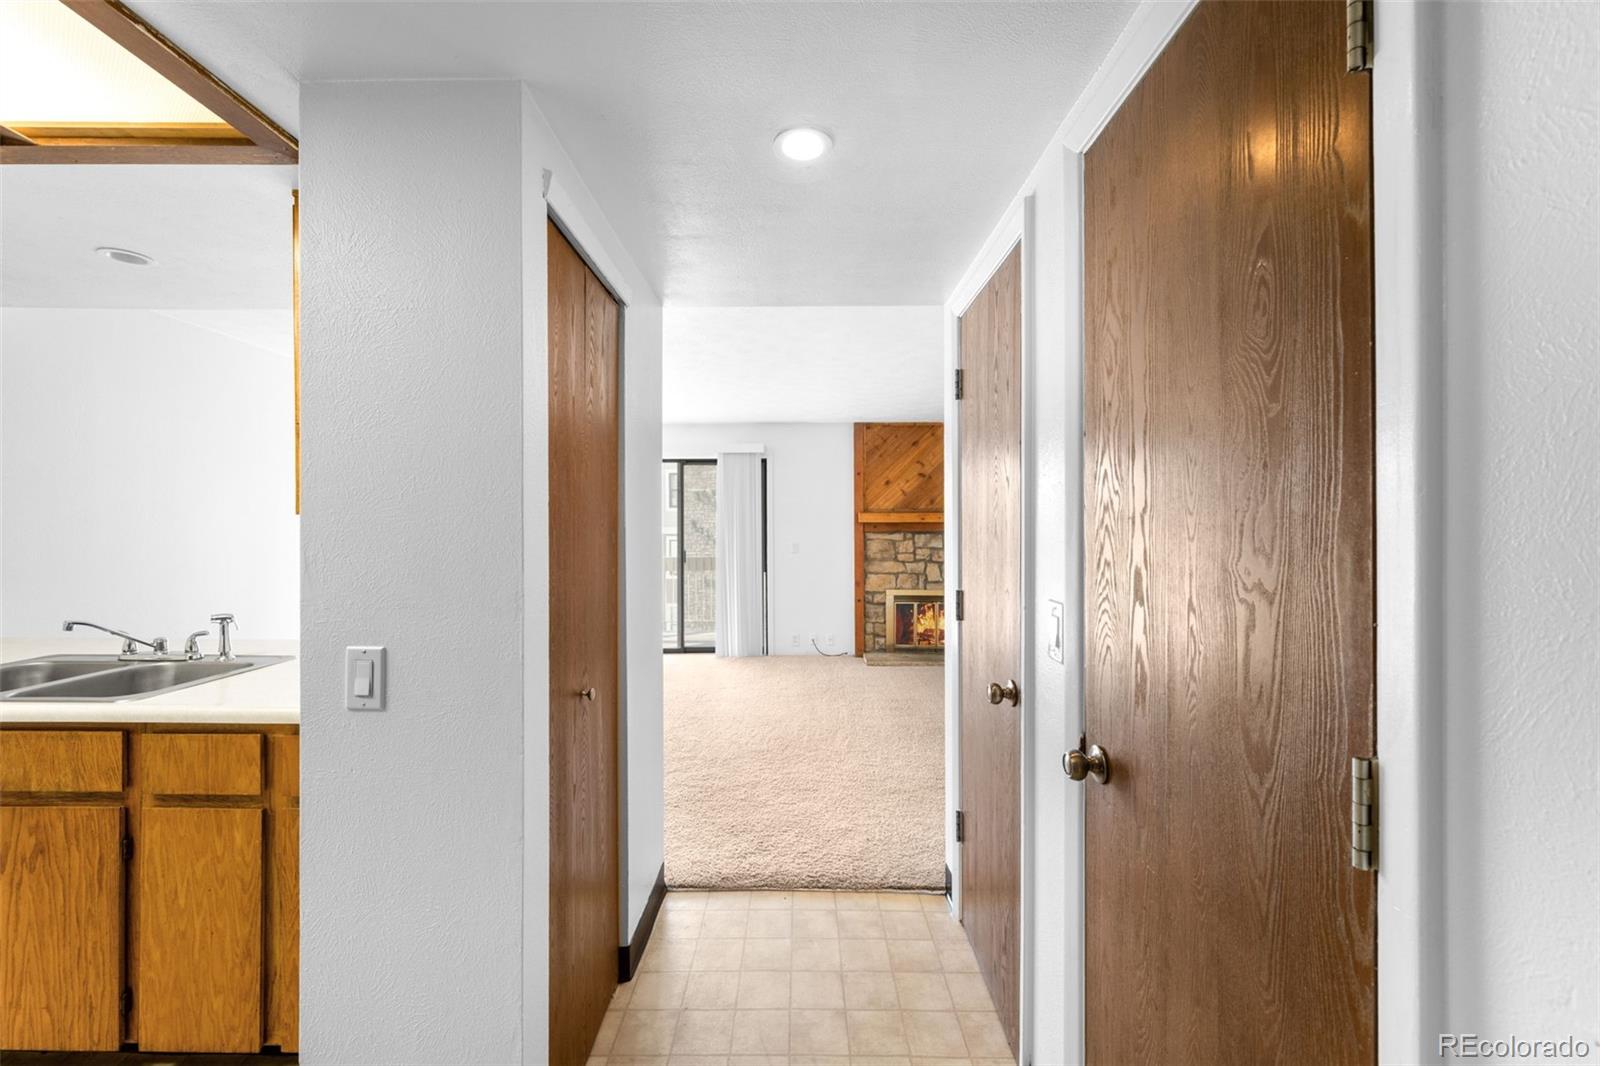
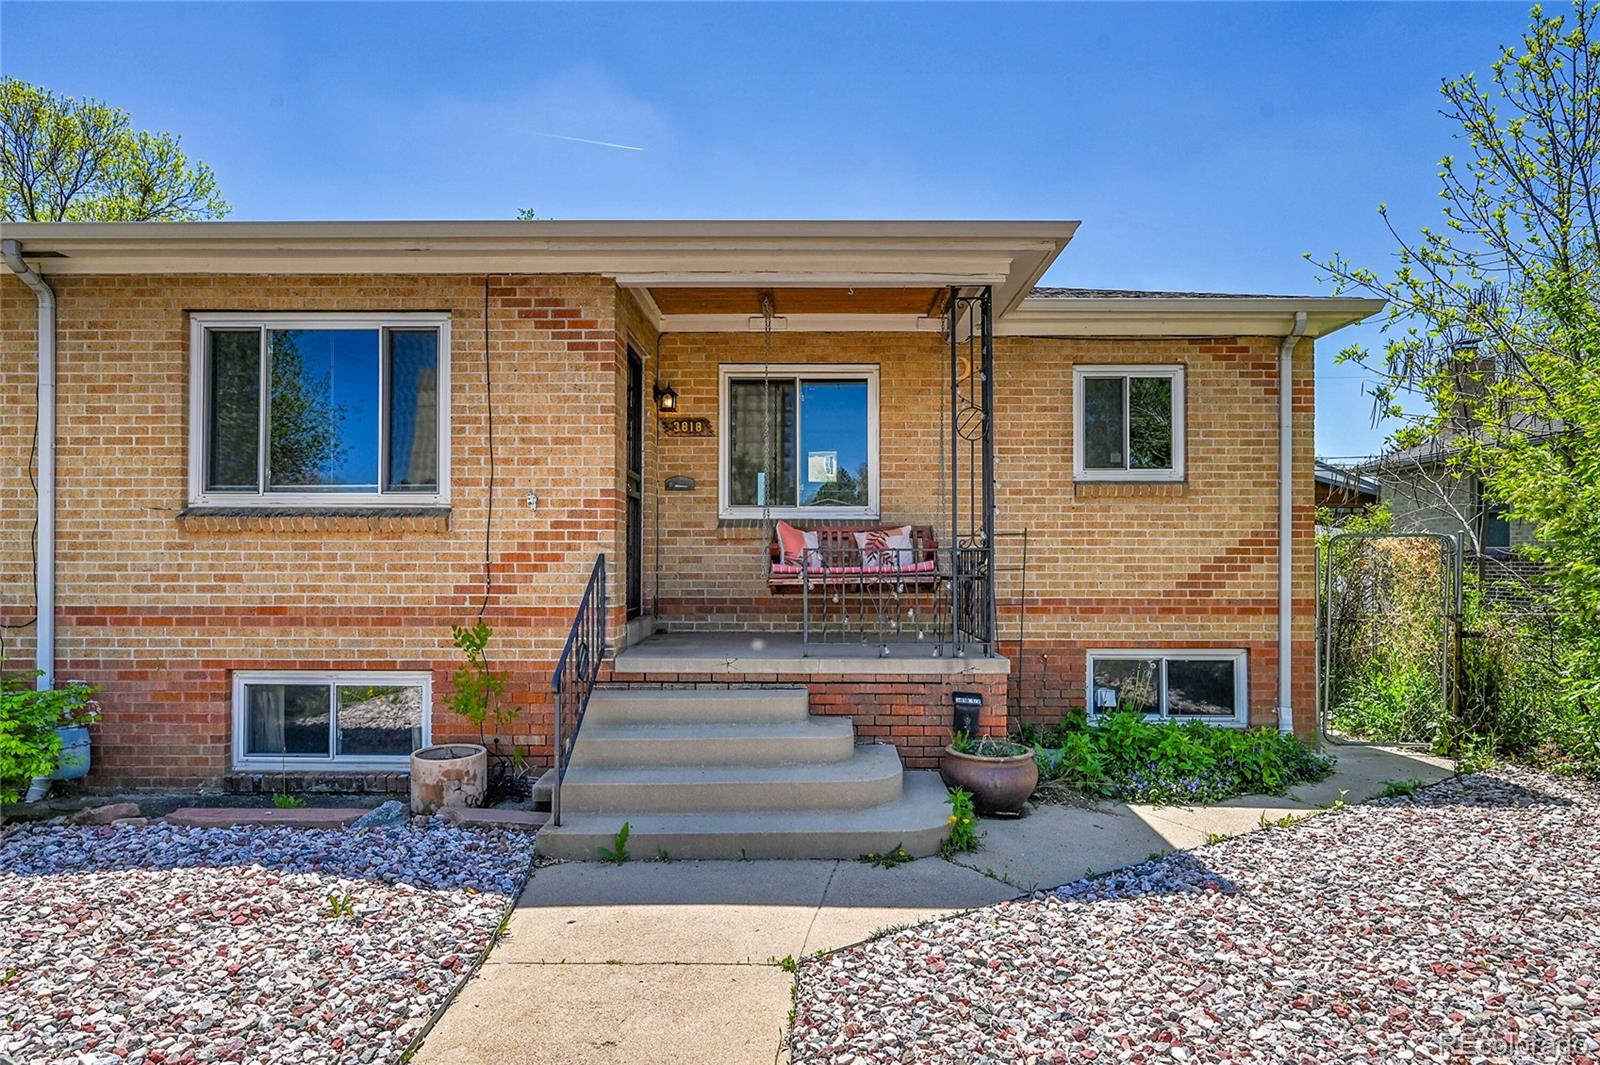
$565,000
3
bds
|
2
ba
|
975
sqft
|
built
1952
3818 W 25th Ave, Denver, CO 80211
$-878
Cash flow
-8.1%
Cash-on-Cash Return
3.8%
Cap rate
0.6%
Rent to Value Ratio
3,085 out of 3,194 properties for sale in Denver County
Limited Results Shown
Create a free account, or log in to reveal all property listings and enjoy the complete experience.
Active
$230,000
1
bds
|
1
ba
|
804
sqft
|
built
1980
4896 S Dudley St, Littleton, CO 80123
$-290
Cash flow
-6.6%
Cash-on-Cash Return
4.2%
Cap rate
0.7%
Rent to Value Ratio
Active under contract
$1,150,000
4
bds
|
4
ba
|
2,411
sqft
|
built
2017
3658 Quivas St, Denver, CO 80211
$-2,179
Cash flow
-9.9%
Cash-on-Cash Return
3.4%
Cap rate
0.5%
Rent to Value Ratio
Active
$565,000
3
bds
|
2
ba
|
975
sqft
|
built
1952
3818 W 25th Ave, Denver, CO 80211
$-878
Cash flow
-8.1%
Cash-on-Cash Return
3.8%
Cap rate
0.6%
Rent to Value Ratio
Active
$870,000
4
bds
|
2
ba
|
1,873
sqft
|
built
1940
1219 Cherry St, Denver, CO 80220
$-2,634
Cash flow
-15.8%
Cash-on-Cash Return
2.0%
Cap rate
0.3%
Rent to Value Ratio
Active
$2,299,900
4
bds
|
7
ba
|
5,759
sqft
|
built
2008
579 Madison St, Denver, CO 80206
$-5,291
Cash flow
-12.0%
Cash-on-Cash Return
2.9%
Cap rate
0.4%
Rent to Value Ratio
Active
$1,175,000
4
bds
|
3
ba
|
2,953
sqft
|
built
1909
3811 N Clay St, Denver, CO 80211
$-2,305
Cash flow
-10.2%
Cash-on-Cash Return
3.3%
Cap rate
0.4%
Rent to Value Ratio
Active
$1,215,000
4
bds
|
4
ba
|
2,479
sqft
|
built
2017
3201 W 25th Ave, Denver, CO 80211
$-2,738
Cash flow
-11.8%
Cash-on-Cash Return
3.0%
Cap rate
0.4%
Rent to Value Ratio
Active
$797,000
2
bds
|
1
ba
|
1,000
sqft
|
built
1952
2031 Meade St, Denver, CO 80211
$-1,589
Cash flow
-10.4%
Cash-on-Cash Return
3.3%
Cap rate
0.5%
Rent to Value Ratio
Active
$1,125,000
3
bds
|
5
ba
|
3,027
sqft
|
built
2016
3941 Vallejo St, Denver, CO 80211
$-2,614
Cash flow
-12.1%
Cash-on-Cash Return
2.9%
Cap rate
0.4%
Rent to Value Ratio
Pending
$999,999
6
bds
|
4
ba
|
4,782
sqft
|
built
2020
20603 E 50th Pl, Denver, CO 80249
$-2,474
Cash flow
-12.9%
Cash-on-Cash Return
2.7%
Cap rate
0.4%
Rent to Value Ratio
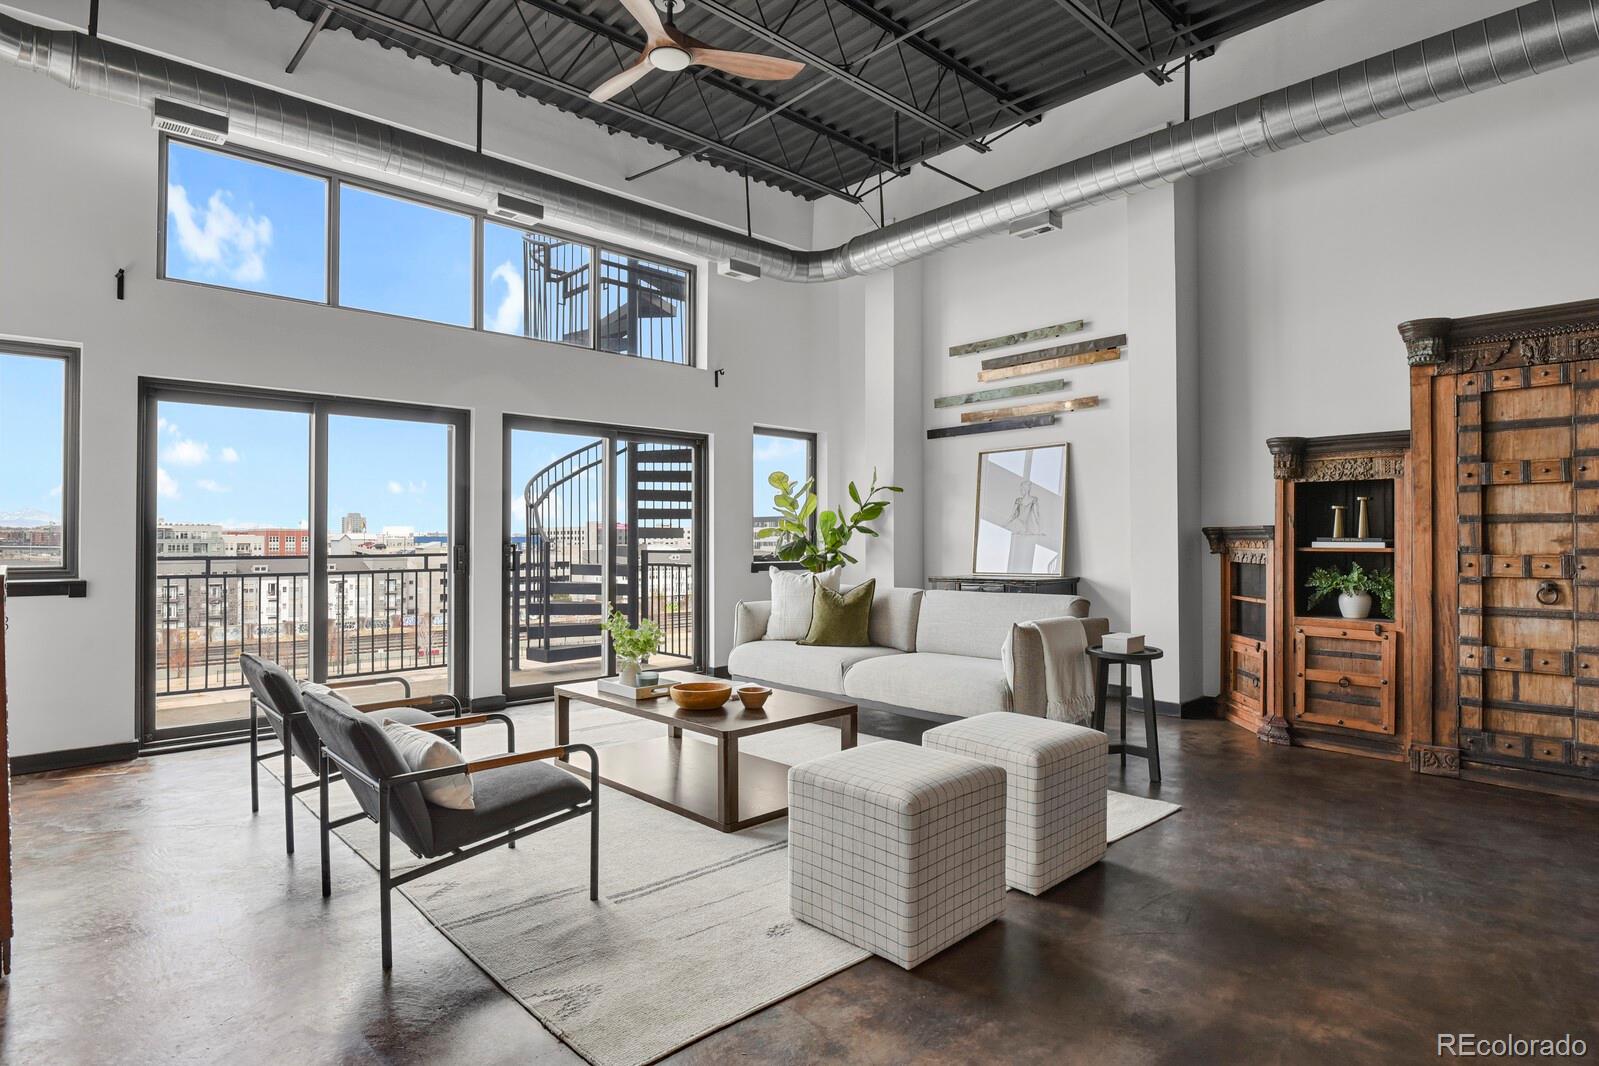
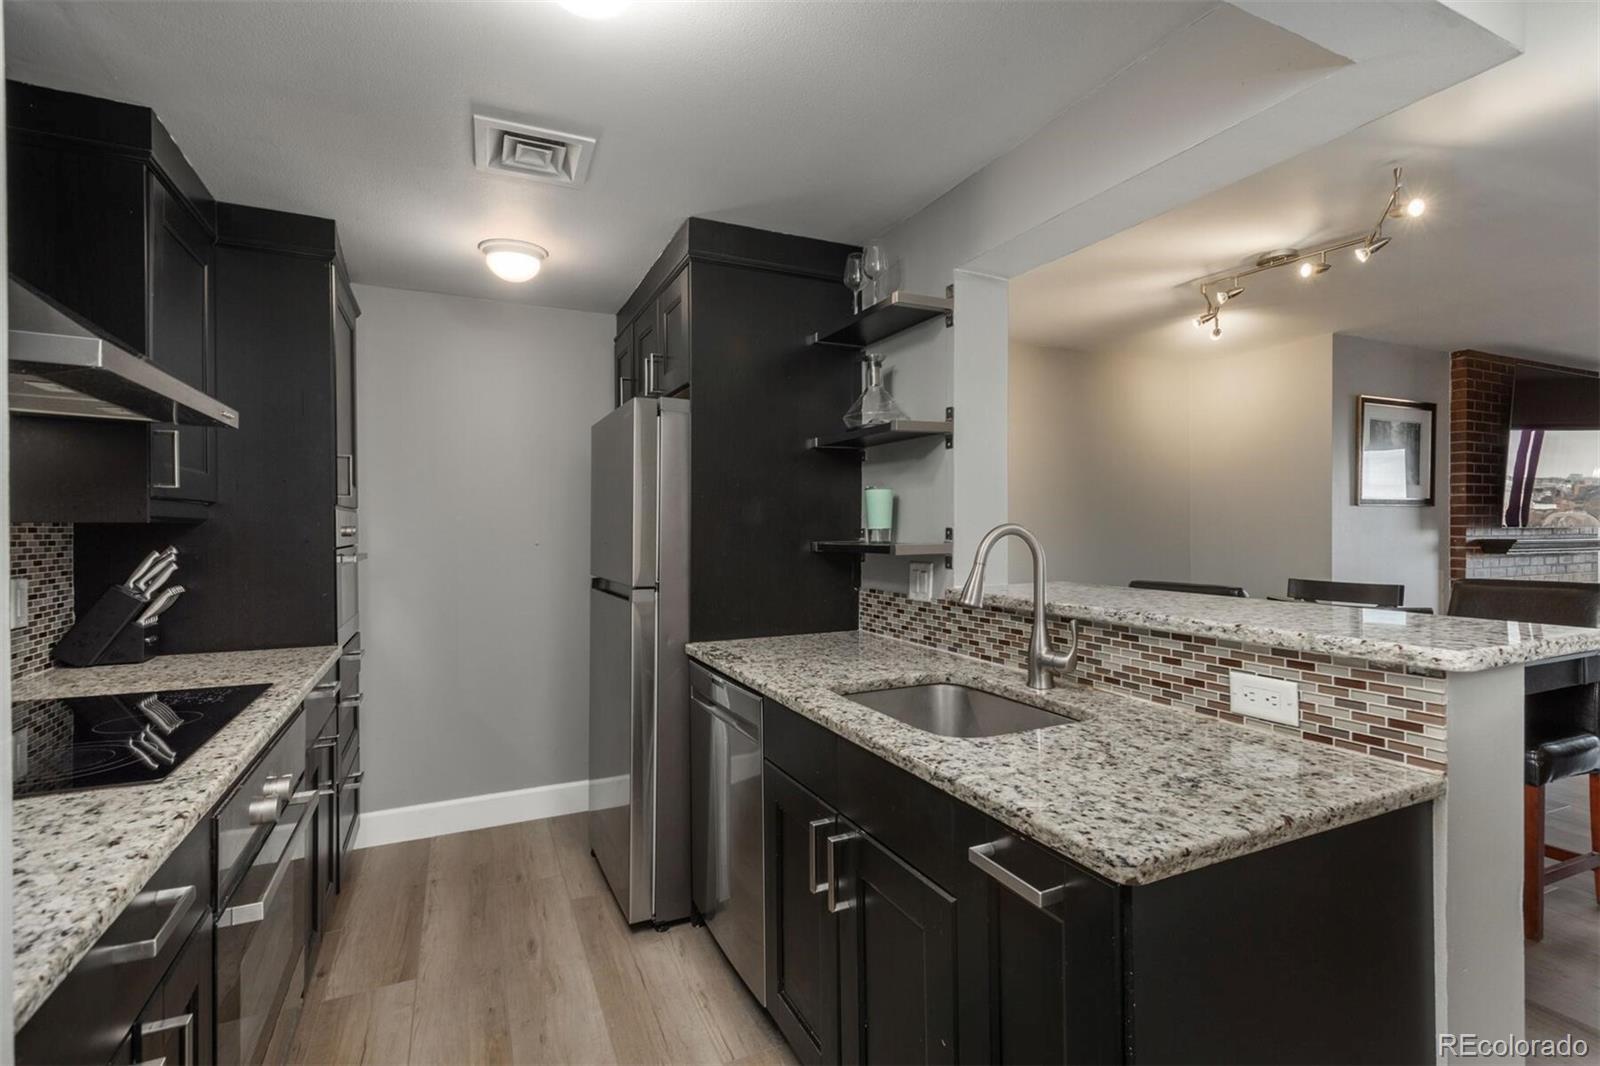
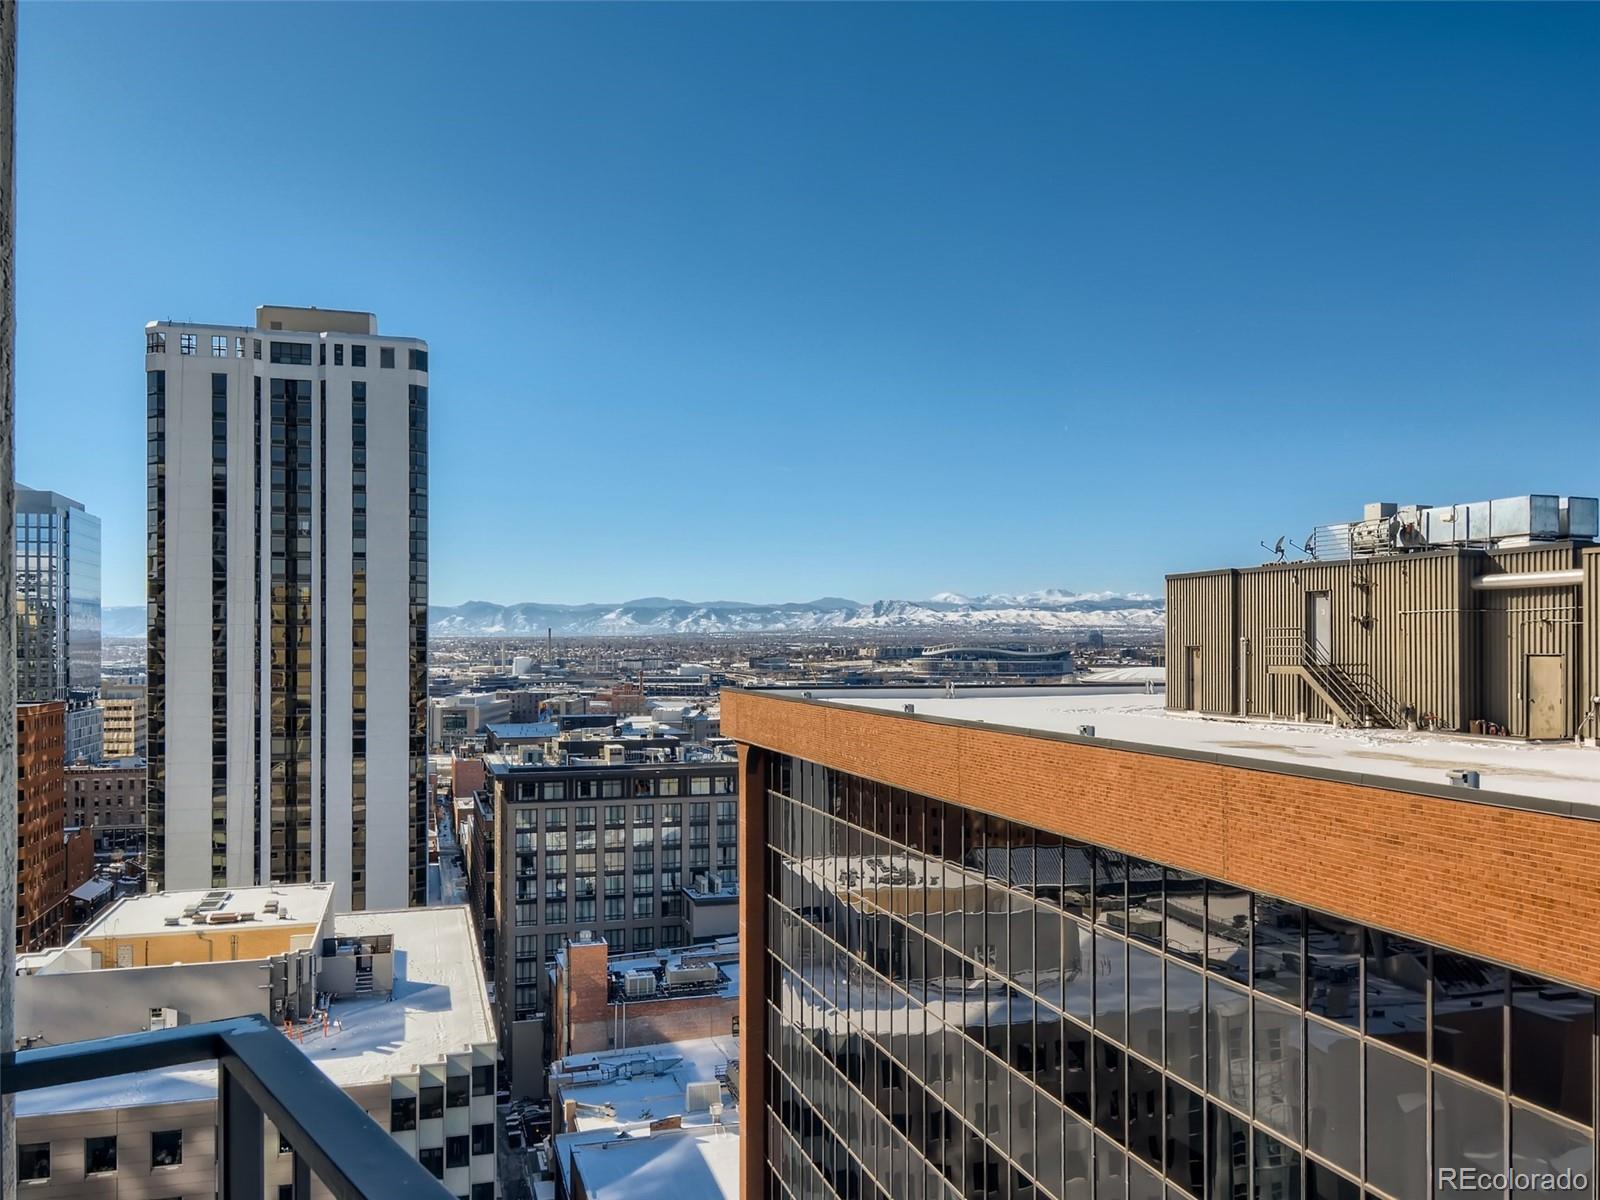
Active
$975,000
2
bds
|
3
ba
|
1,467
sqft
|
built
2009
2001 Lincoln St, Denver, CO 80202
$-3,137
Cash flow
-16.8%
Cash-on-Cash Return
1.8%
Cap rate
0.4%
Rent to Value Ratio
Active
$635,000
3
bds
|
3
ba
|
1,451
sqft
|
built
2006
1738 N Franklin St, Denver, CO 80218
$-1,627
Cash flow
-13.4%
Cash-on-Cash Return
2.6%
Cap rate
0.5%
Rent to Value Ratio
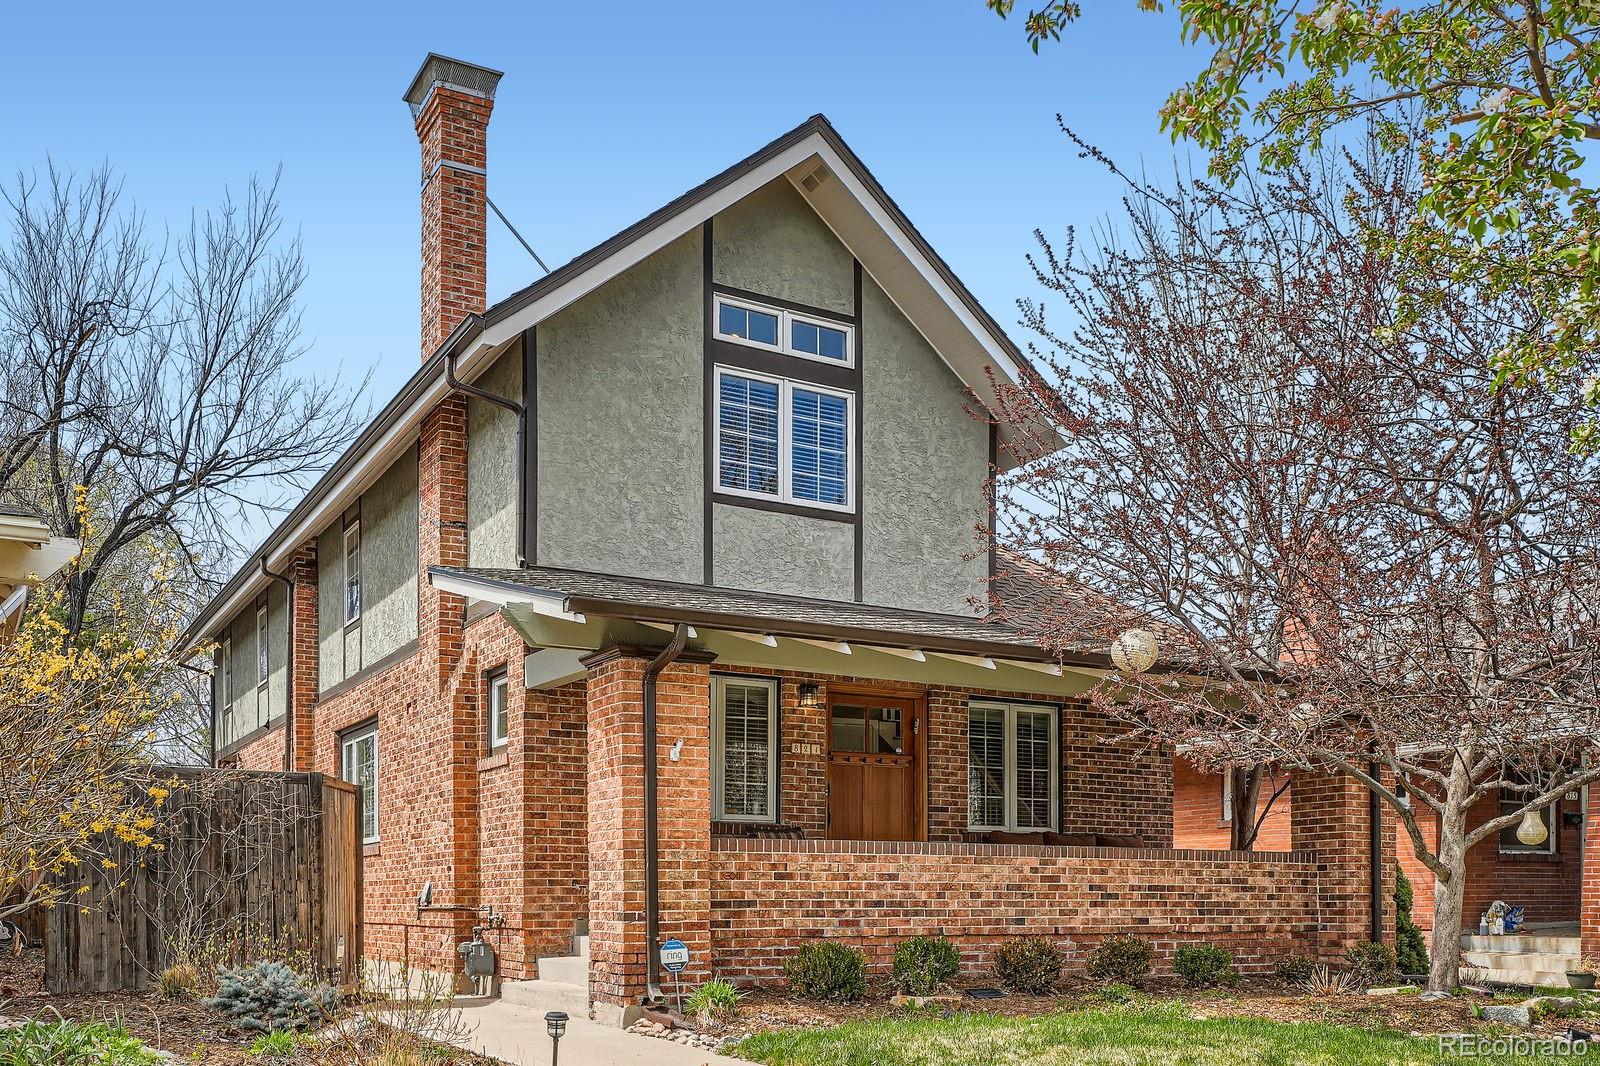
Active
$1,549,900
3
bds
|
4
ba
|
3,343
sqft
|
built
1920
821 S High St, Denver, CO 80209
$-4,143
Cash flow
-13.9%
Cash-on-Cash Return
2.5%
Cap rate
0.4%
Rent to Value Ratio
Active
$679,000
1
bds
|
2
ba
|
1,197
sqft
|
built
2004
2715 Blake St, Denver, CO 80205
$-1,856
Cash flow
-14.3%
Cash-on-Cash Return
2.4%
Cap rate
0.4%
Rent to Value Ratio
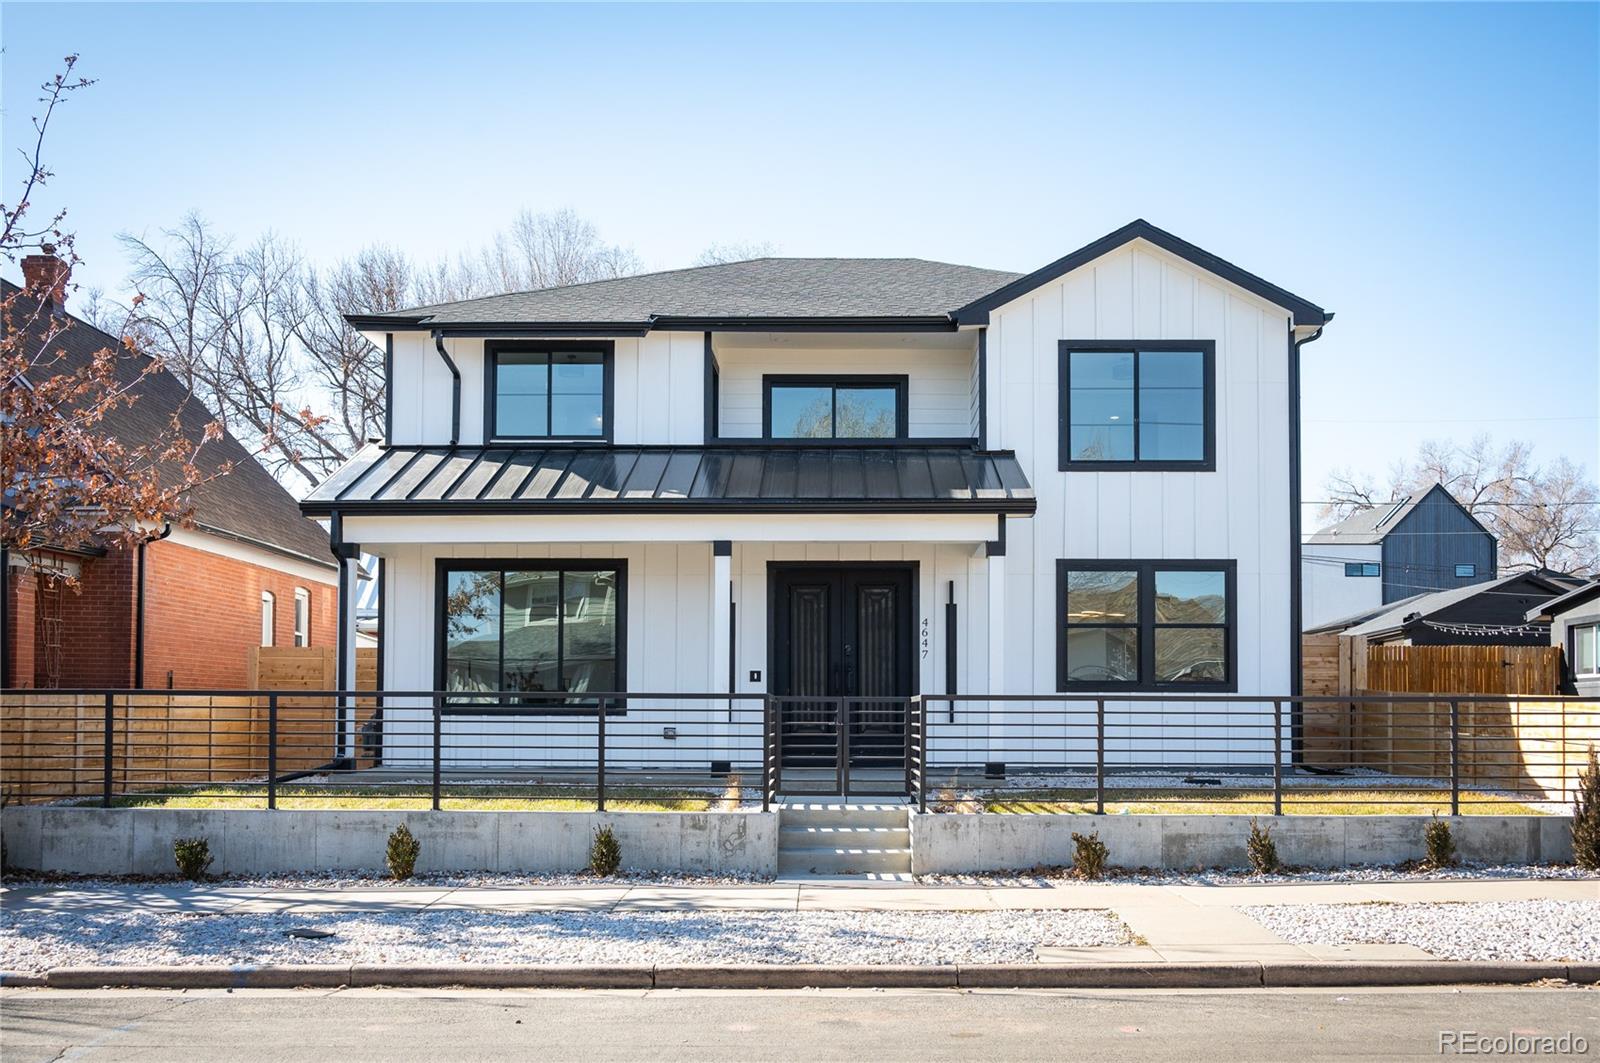
Active
$2,125,000
5
bds
|
5
ba
|
4,500
sqft
|
built
2025
4647 Bryant St, Denver, CO 80211
$-7,728
Cash flow
-19.0%
Cash-on-Cash Return
1.3%
Cap rate
0.2%
Rent to Value Ratio

Active
$689,899
4
bds
|
3
ba
|
1,193
sqft
|
built
1964
8307 E Lehigh Dr, Denver, CO 80237
$-1,120
Cash flow
-8.5%
Cash-on-Cash Return
3.7%
Cap rate
0.5%
Rent to Value Ratio
Active
$1,175,000
3
bds
|
2
ba
|
1,188
sqft
|
built
1946
160 Monroe St, Denver, CO 80206
$-3,249
Cash flow
-14.4%
Cash-on-Cash Return
2.4%
Cap rate
0.3%
Rent to Value Ratio
Active under contract
$585,000
4
bds
|
2
ba
|
1,936
sqft
|
built
1938
1419 Dexter St, Denver, CO 80220
$-1,225
Cash flow
-10.9%
Cash-on-Cash Return
3.2%
Cap rate
0.5%
Rent to Value Ratio
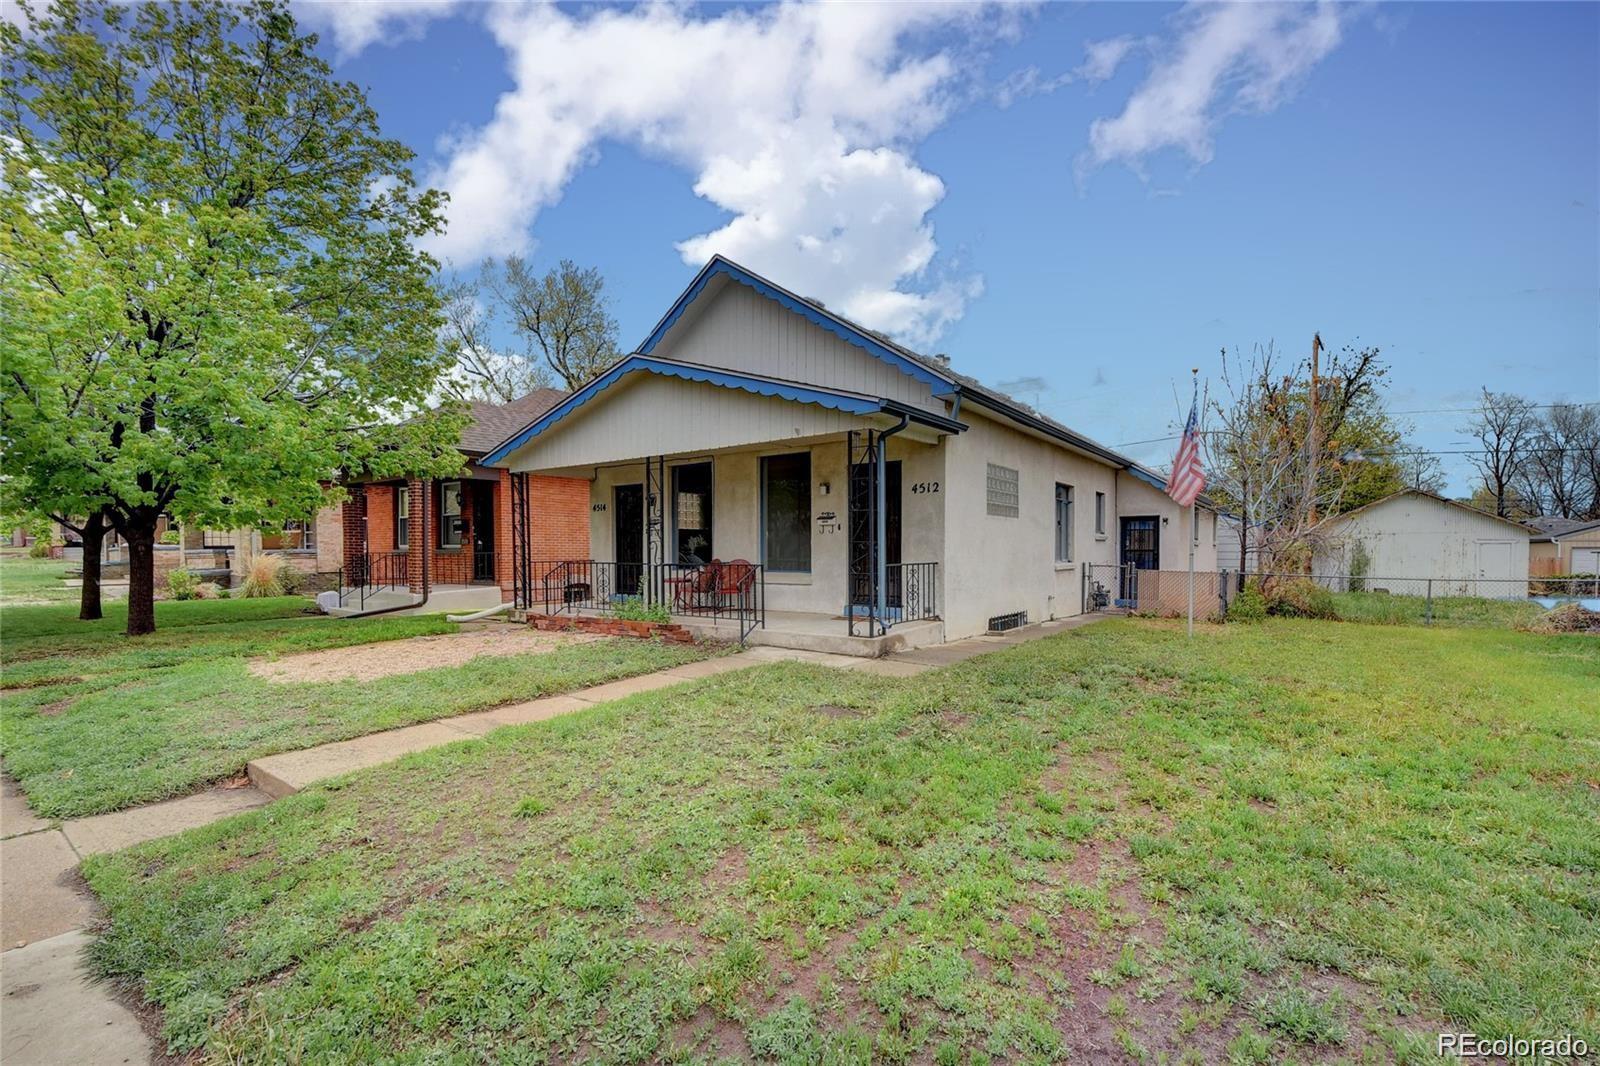
Active
$950,000
5
bds
|
3
ba
|
2,516
sqft
|
built
1909
4514 Bryant St, Denver, CO 80211
$-2,962
Cash flow
-16.3%
Cash-on-Cash Return
1.9%
Cap rate
0.3%
Rent to Value Ratio
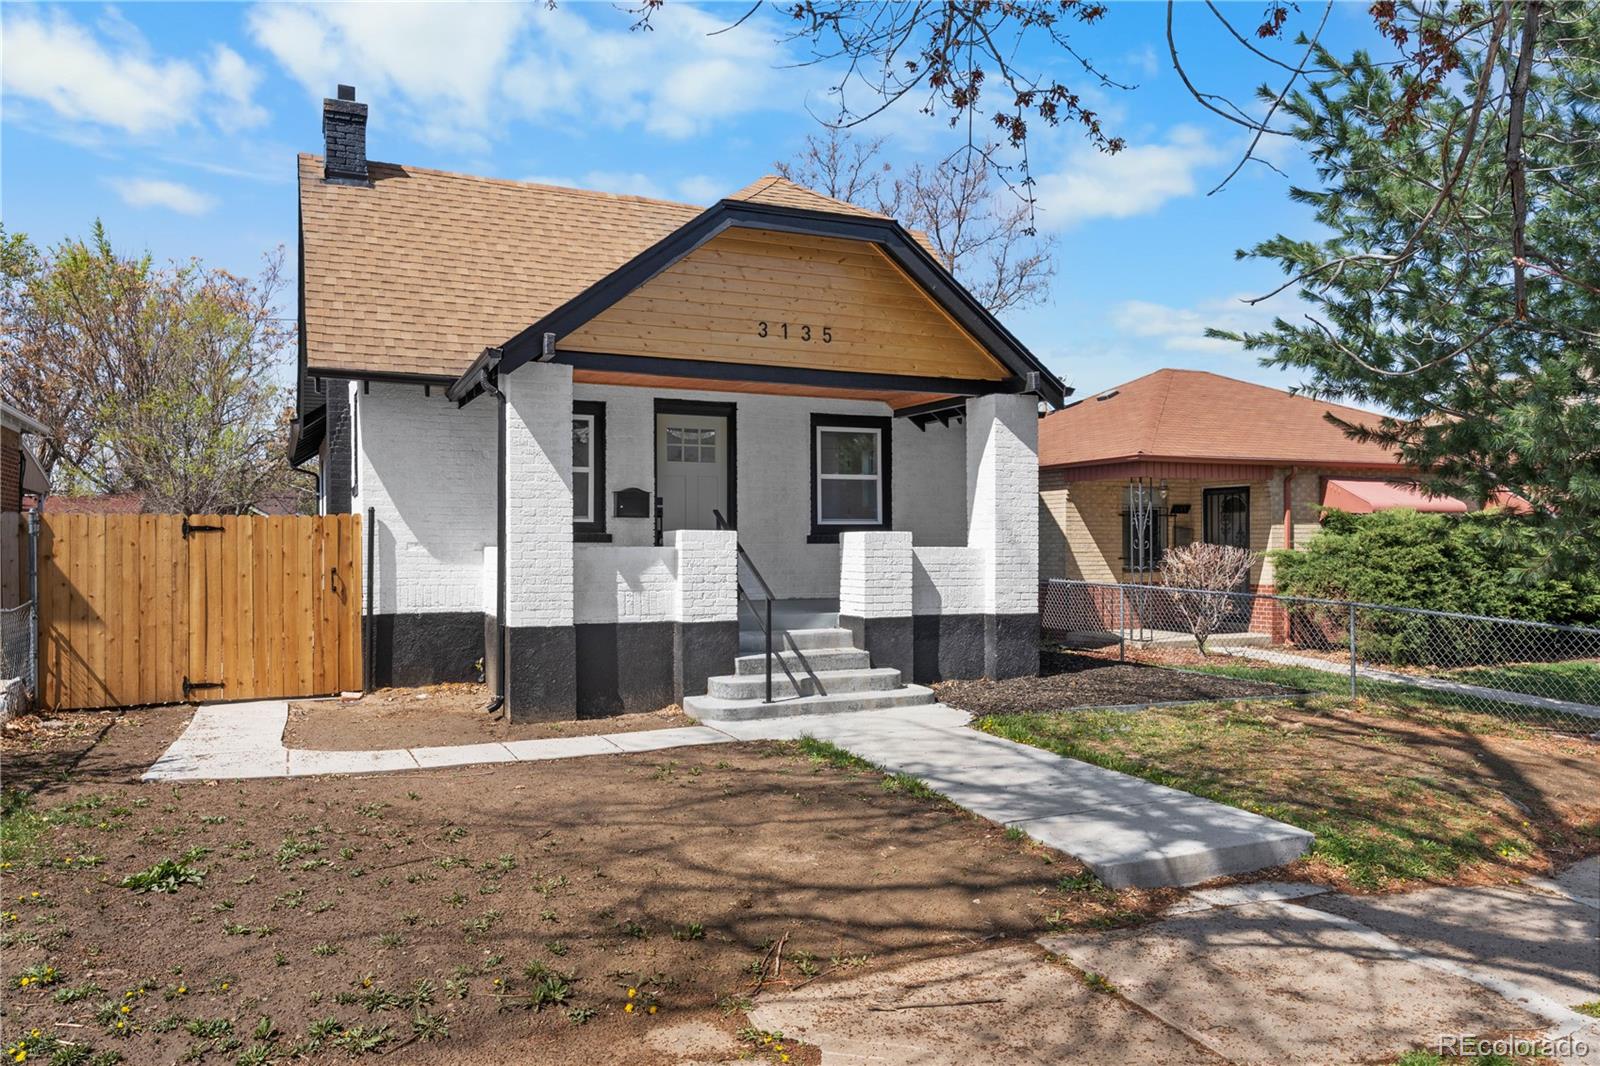
Active
$769,900
3
bds
|
2
ba
|
1,900
sqft
|
built
1931
3135 N Columbine St, Denver, CO 80205
$-2,325
Cash flow
-15.8%
Cash-on-Cash Return
2.1%
Cap rate
0.3%
Rent to Value Ratio
Active
$5,750,000
5
bds
|
7
ba
|
7,835
sqft
|
built
1921
3309 E 7th Avenue Pkwy, Denver, CO 80206
$-22,159
Cash flow
-20.1%
Cash-on-Cash Return
1.1%
Cap rate
0.2%
Rent to Value Ratio
Active
$370,000
1
bds
|
1
ba
|
937
sqft
|
built
1978
800 N Pearl St, Denver, CO 80203
$-996
Cash flow
-14.0%
Cash-on-Cash Return
2.4%
Cap rate
0.6%
Rent to Value Ratio
Active
$680,000
2
bds
|
2
ba
|
1,909
sqft
|
built
1981
1777 Larimer St, Denver, CO 80202
$-2,526
Cash flow
-19.4%
Cash-on-Cash Return
1.2%
Cap rate
0.6%
Rent to Value Ratio
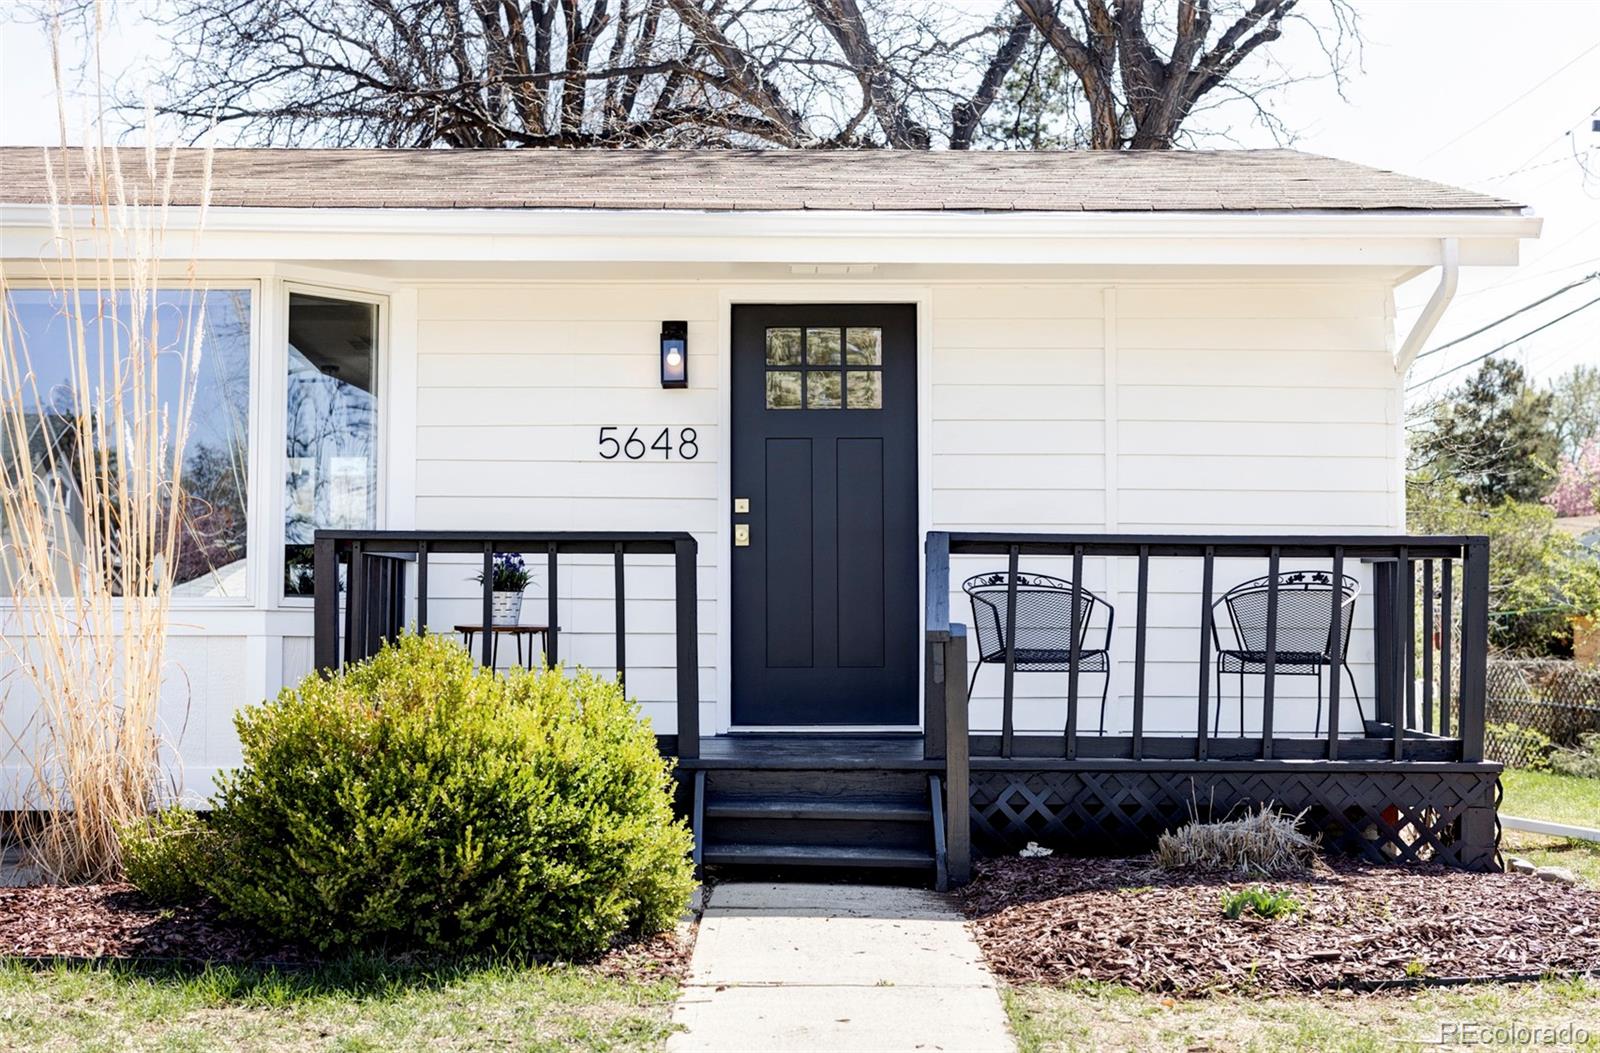
Active
$619,500
3
bds
|
2
ba
|
1,441
sqft
|
built
1957
5648 E Greenwood Pl, Denver, CO 80222
$-1,225
Cash flow
-10.3%
Cash-on-Cash Return
3.3%
Cap rate
0.5%
Rent to Value Ratio
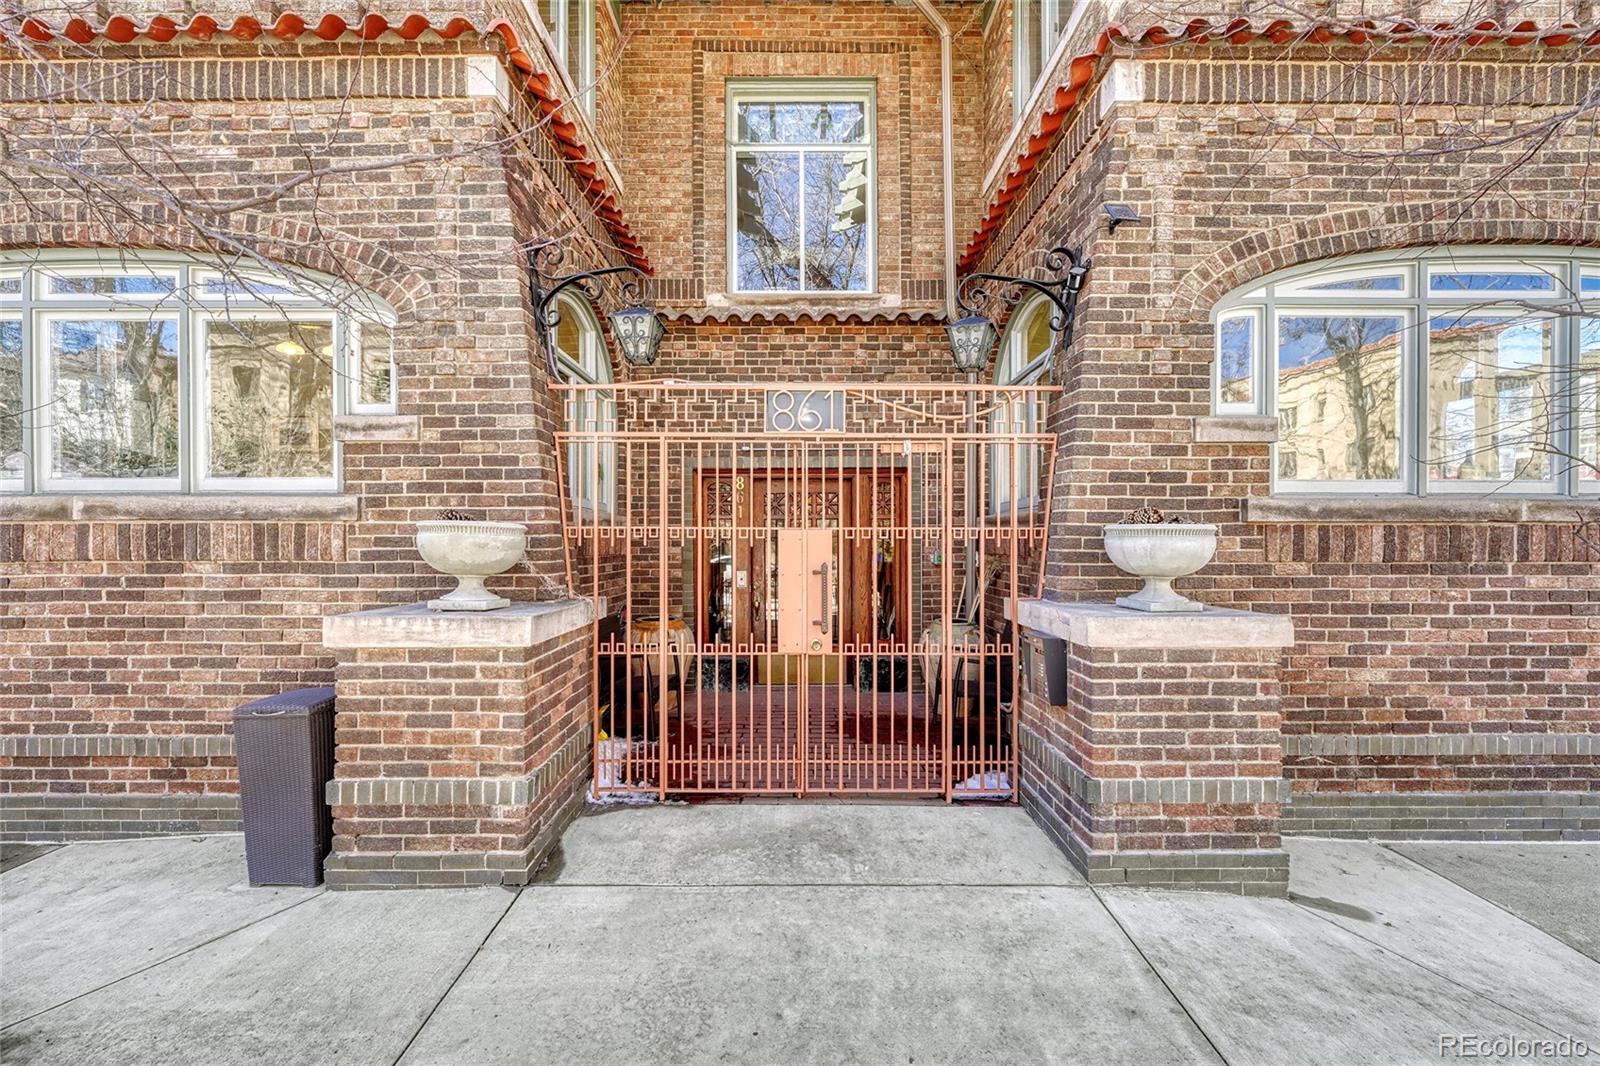
Pending
$799,000
2
bds
|
3
ba
|
1,659
sqft
|
built
1915
861 N Humboldt St, Denver, CO 80218
$-2,456
Cash flow
-16.0%
Cash-on-Cash Return
2.0%
Cap rate
0.4%
Rent to Value Ratio
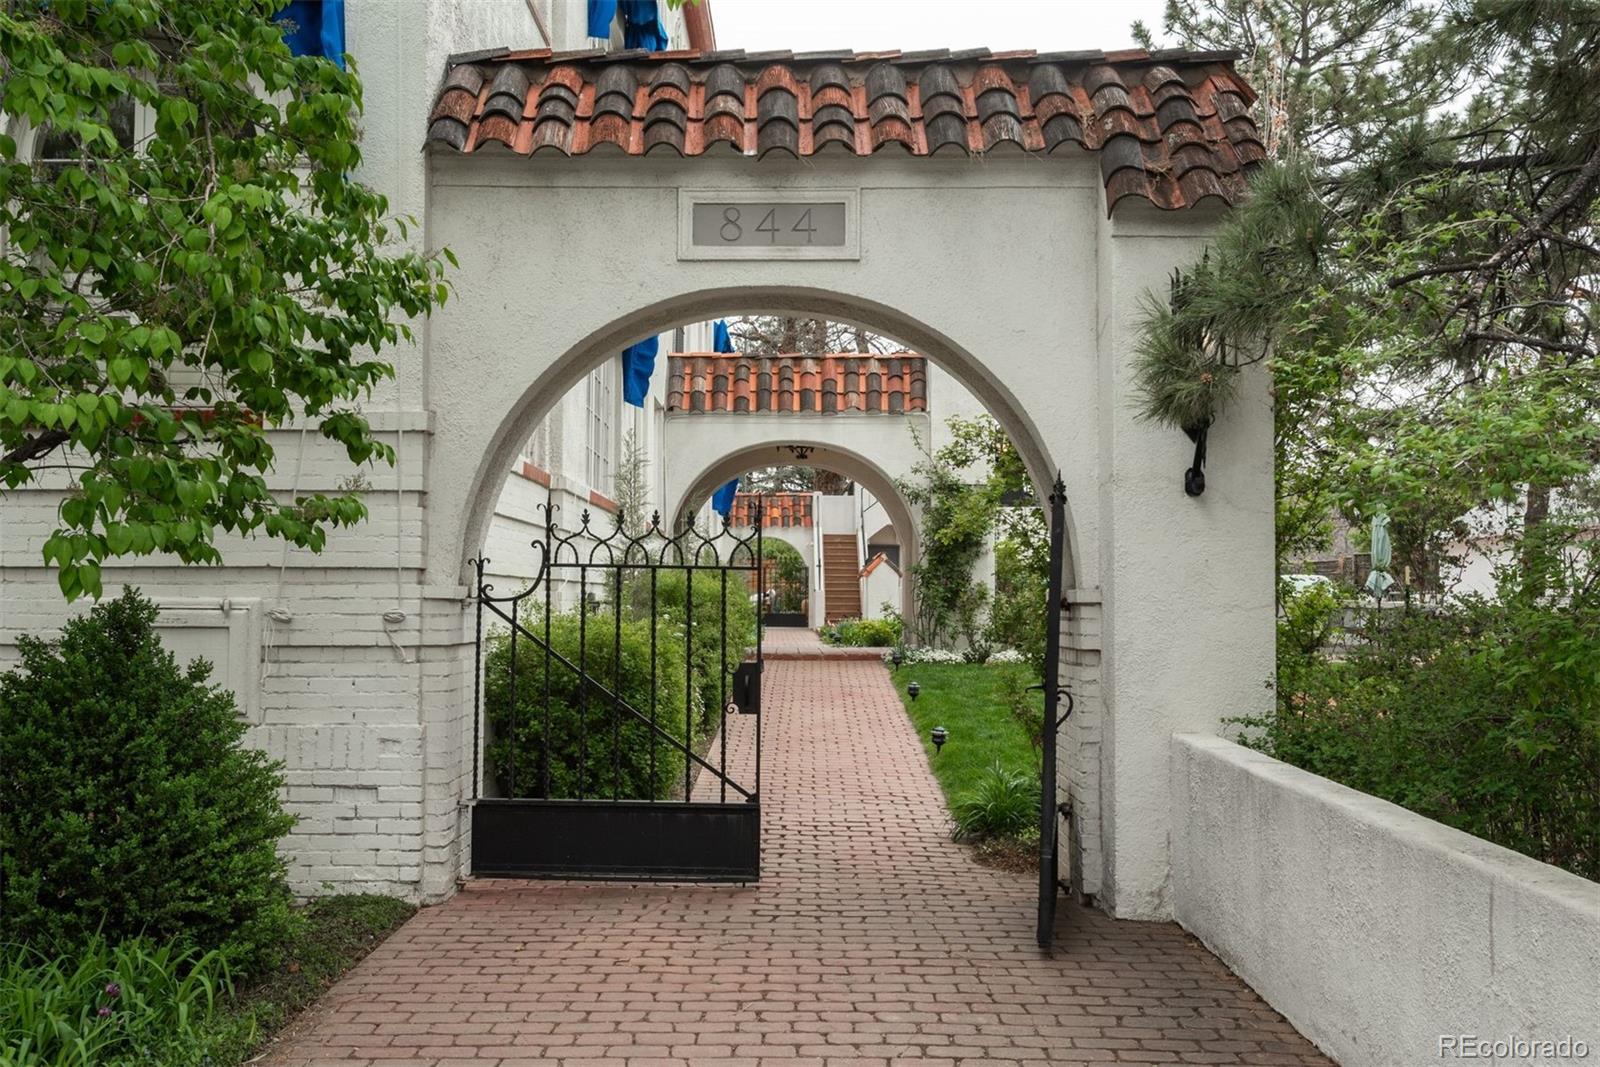
Active
$1,049,000
3
bds
|
2
ba
|
1,920
sqft
|
built
1923
844 N Humboldt St, Denver, CO 80218
$-3,377
Cash flow
-16.8%
Cash-on-Cash Return
1.8%
Cap rate
0.4%
Rent to Value Ratio
Active
$825,000
3
bds
|
3
ba
|
2,023
sqft
|
built
2016
3450 N Downing St, Denver, CO 80205
$-1,194
Cash flow
-7.6%
Cash-on-Cash Return
3.9%
Cap rate
0.5%
Rent to Value Ratio
Active
$1,050,000
5
bds
|
3
ba
|
4,353
sqft
|
built
1976
4505 S Yosemite St, Denver, CO 80237
$-2,703
Cash flow
-13.4%
Cash-on-Cash Return
2.6%
Cap rate
0.5%
Rent to Value Ratio
Active under contract
$385,000
1
bds
|
1
ba
|
690
sqft
|
built
1963
1200 Vine St, Denver, CO 80206
$-1,213
Cash flow
-16.4%
Cash-on-Cash Return
1.9%
Cap rate
0.5%
Rent to Value Ratio
Active
$519,999
2
bds
|
2
ba
|
1,146
sqft
|
built
1969
130 N Pearl St, Denver, CO 80203
$-1,136
Cash flow
-11.4%
Cash-on-Cash Return
3.1%
Cap rate
0.6%
Rent to Value Ratio
Active
$2,295,000
5
bds
|
4
ba
|
4,100
sqft
|
built
1885
3520 Newton St, Denver, CO 80211
$-8,188
Cash flow
-18.6%
Cash-on-Cash Return
1.4%
Cap rate
0.2%
Rent to Value Ratio
Active
$1,425,000
4
bds
|
4
ba
|
3,564
sqft
|
built
2016
65 Newport St, Denver, CO 80230
$-3,855
Cash flow
-14.1%
Cash-on-Cash Return
2.4%
Cap rate
0.4%
Rent to Value Ratio
Active
$995,000
3
bds
|
2
ba
|
1,255
sqft
|
built
1955
1333 S Eudora St, Denver, CO 80222
$-1,991
Cash flow
-10.4%
Cash-on-Cash Return
3.3%
Cap rate
0.4%
Rent to Value Ratio
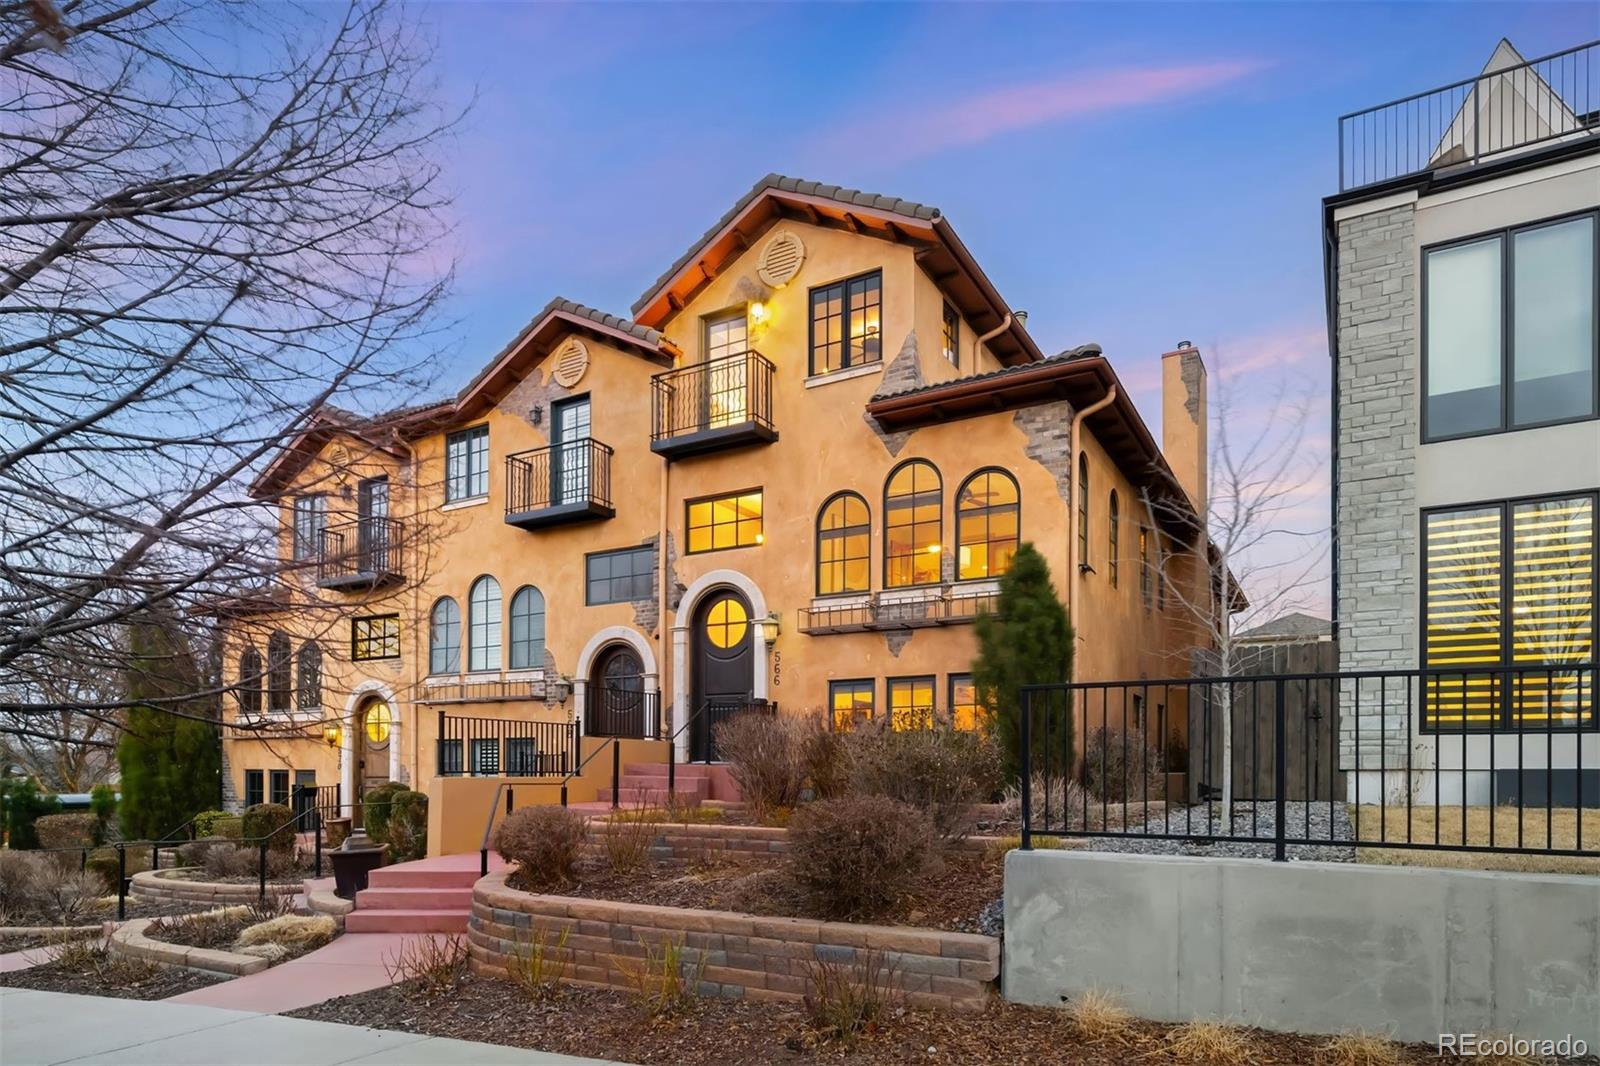
Active
$1,845,000
3
bds
|
4
ba
|
4,389
sqft
|
built
2007
566 Monroe St, Denver, CO 80206
$-5,420
Cash flow
-15.3%
Cash-on-Cash Return
2.2%
Cap rate
0.3%
Rent to Value Ratio
Pending
$940,000
3
bds
|
3
ba
|
2,269
sqft
|
built
2008
85 Rampart Way, Denver, CO 80230
$-2,894
Cash flow
-16.1%
Cash-on-Cash Return
2.0%
Cap rate
0.4%
Rent to Value Ratio
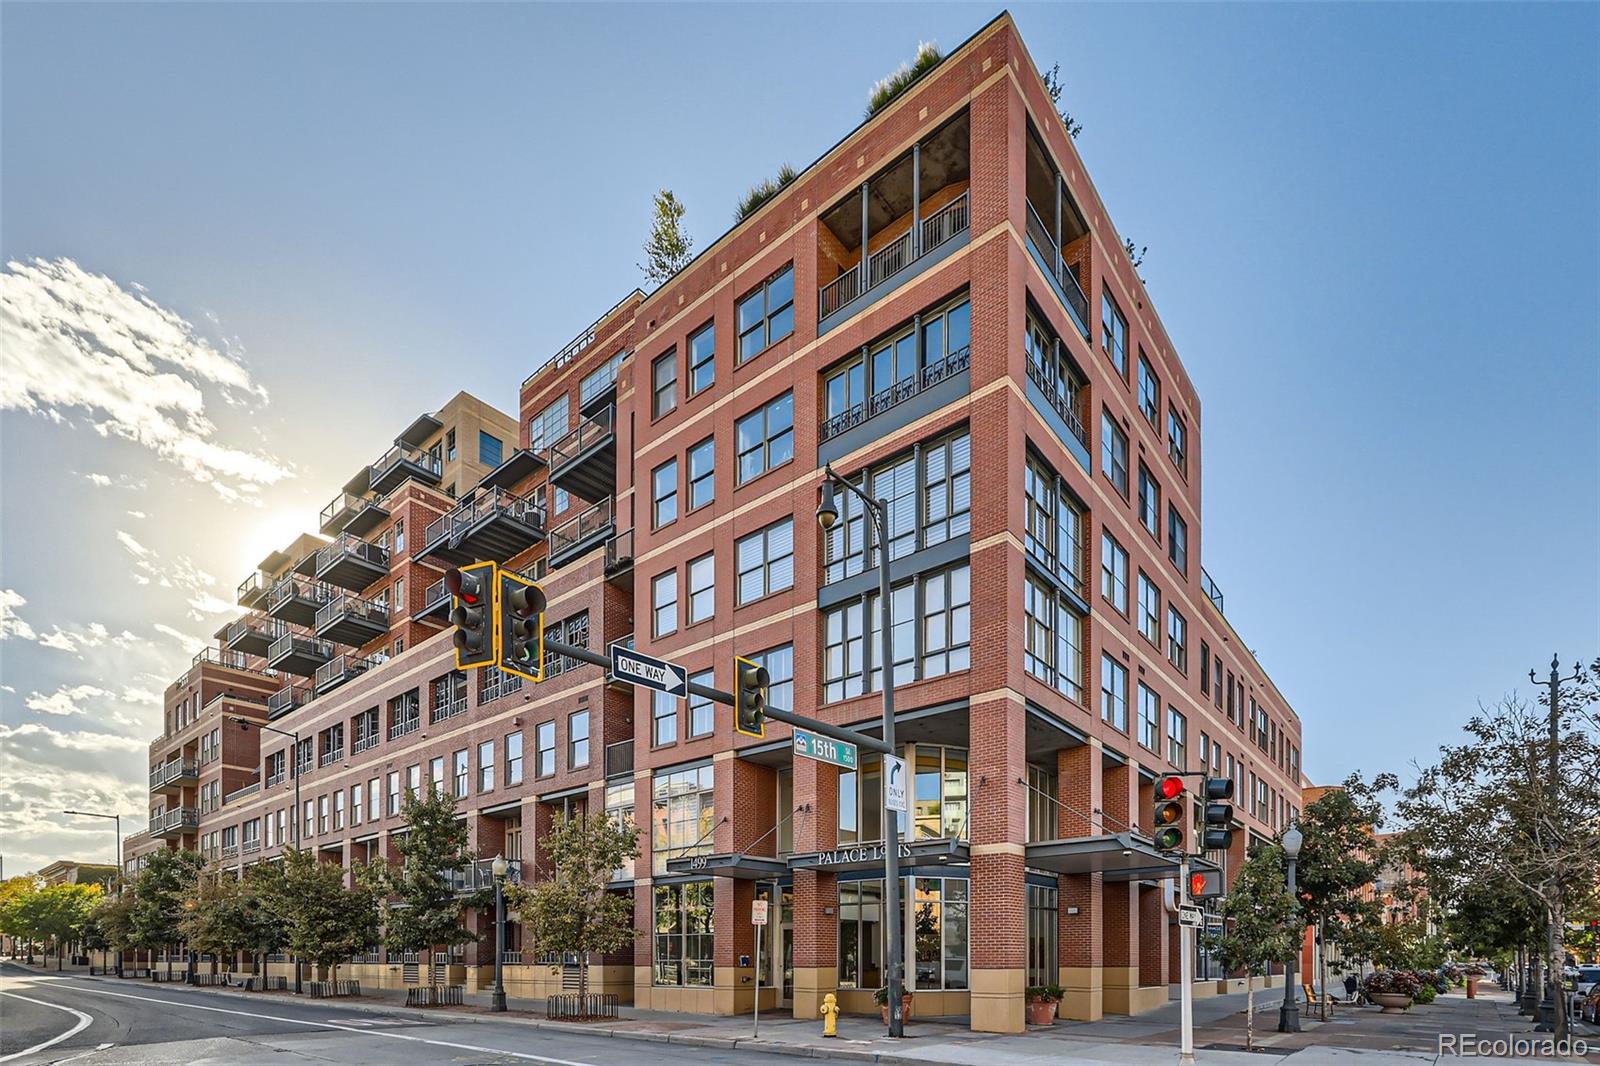
Active
$610,000
2
bds
|
1
ba
|
1,093
sqft
|
built
1997
1499 Blake St, Denver, CO 80202
$-1,668
Cash flow
-14.3%
Cash-on-Cash Return
2.4%
Cap rate
0.5%
Rent to Value Ratio
Active
$2,950,000
4
bds
|
6
ba
|
3,405
sqft
|
built
2016
427 Milwaukee St, Denver, CO 80206
$-11,182
Cash flow
-19.8%
Cash-on-Cash Return
1.1%
Cap rate
0.2%
Rent to Value Ratio
Active
$1,050,000
2
bds
|
2
ba
|
1,306
sqft
|
built
2005
1700 Bassett St, Denver, CO 80202
$-3,507
Cash flow
-17.4%
Cash-on-Cash Return
1.7%
Cap rate
0.4%
Rent to Value Ratio
Active
$889,000
2
bds
|
2
ba
|
1,513
sqft
|
built
2000
2100 16th St, Denver, CO 80202
$-2,530
Cash flow
-14.8%
Cash-on-Cash Return
2.3%
Cap rate
0.5%
Rent to Value Ratio
Active
$730,000
5
bds
|
2
ba
|
1,687
sqft
|
built
1925
4556 Decatur St, Denver, CO 80211
$-1,582
Cash flow
-11.3%
Cash-on-Cash Return
3.1%
Cap rate
0.4%
Rent to Value Ratio