Denver County Investment Properties for Sale
Browse homes for sale and investment properties in Denver County. Refine your search by price, property type, or more.
Best cash flowing properties in Denver County
Active
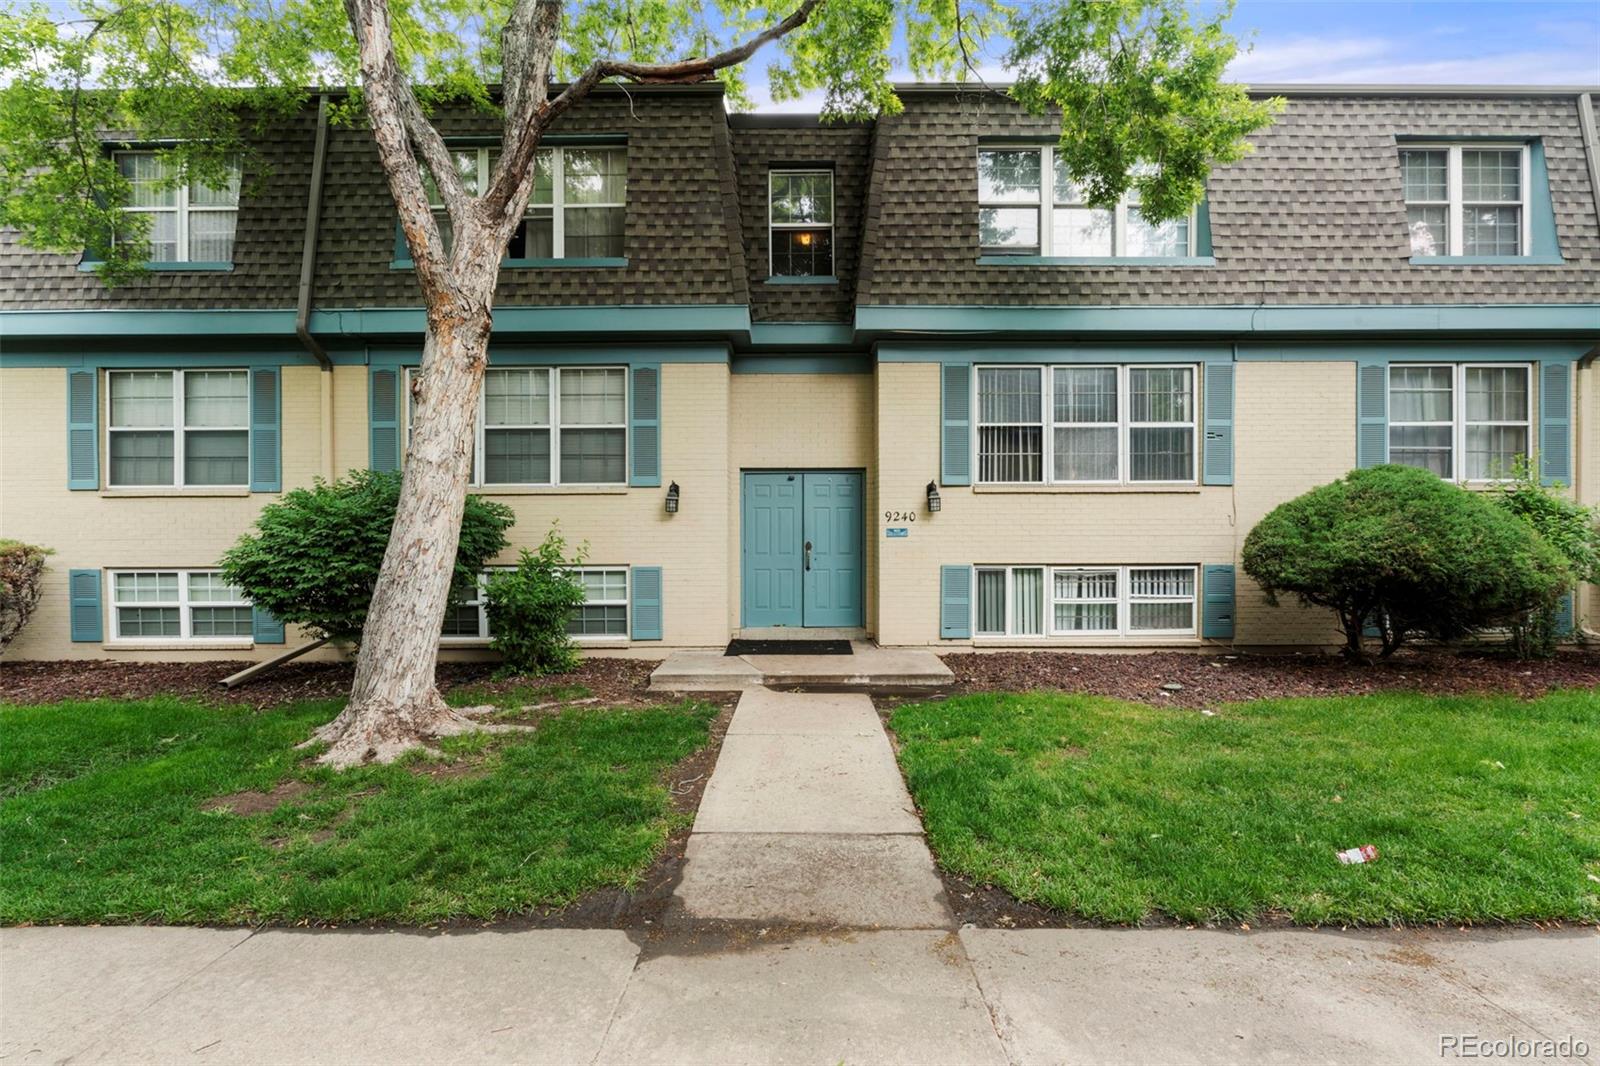
$200,000
2
bds
|
2
ba
|
980
sqft
|
built
1969
9240 E Girard Ave, Denver, CO 80231
$-215
Cash flow
-5.6%
Cash-on-Cash Return
5.0%
Cap rate
0.9%
Rent to Value Ratio
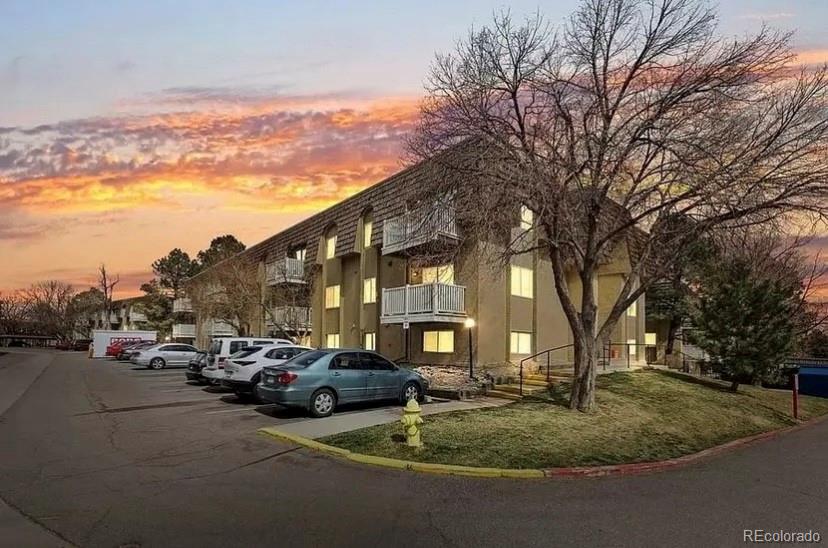
Active
$179,900
1
bds
|
1
ba
|
654
sqft
|
built
1980
10150 E Virginia Ave, Denver, CO 80247
$-402
Cash flow
-11.7%
Cash-on-Cash Return
3.6%
Cap rate
0.8%
Rent to Value Ratio
3,085 out of 3,194 properties for sale in Denver County
Limited Results Shown
Create a free account, or log in to reveal all property listings and enjoy the complete experience.
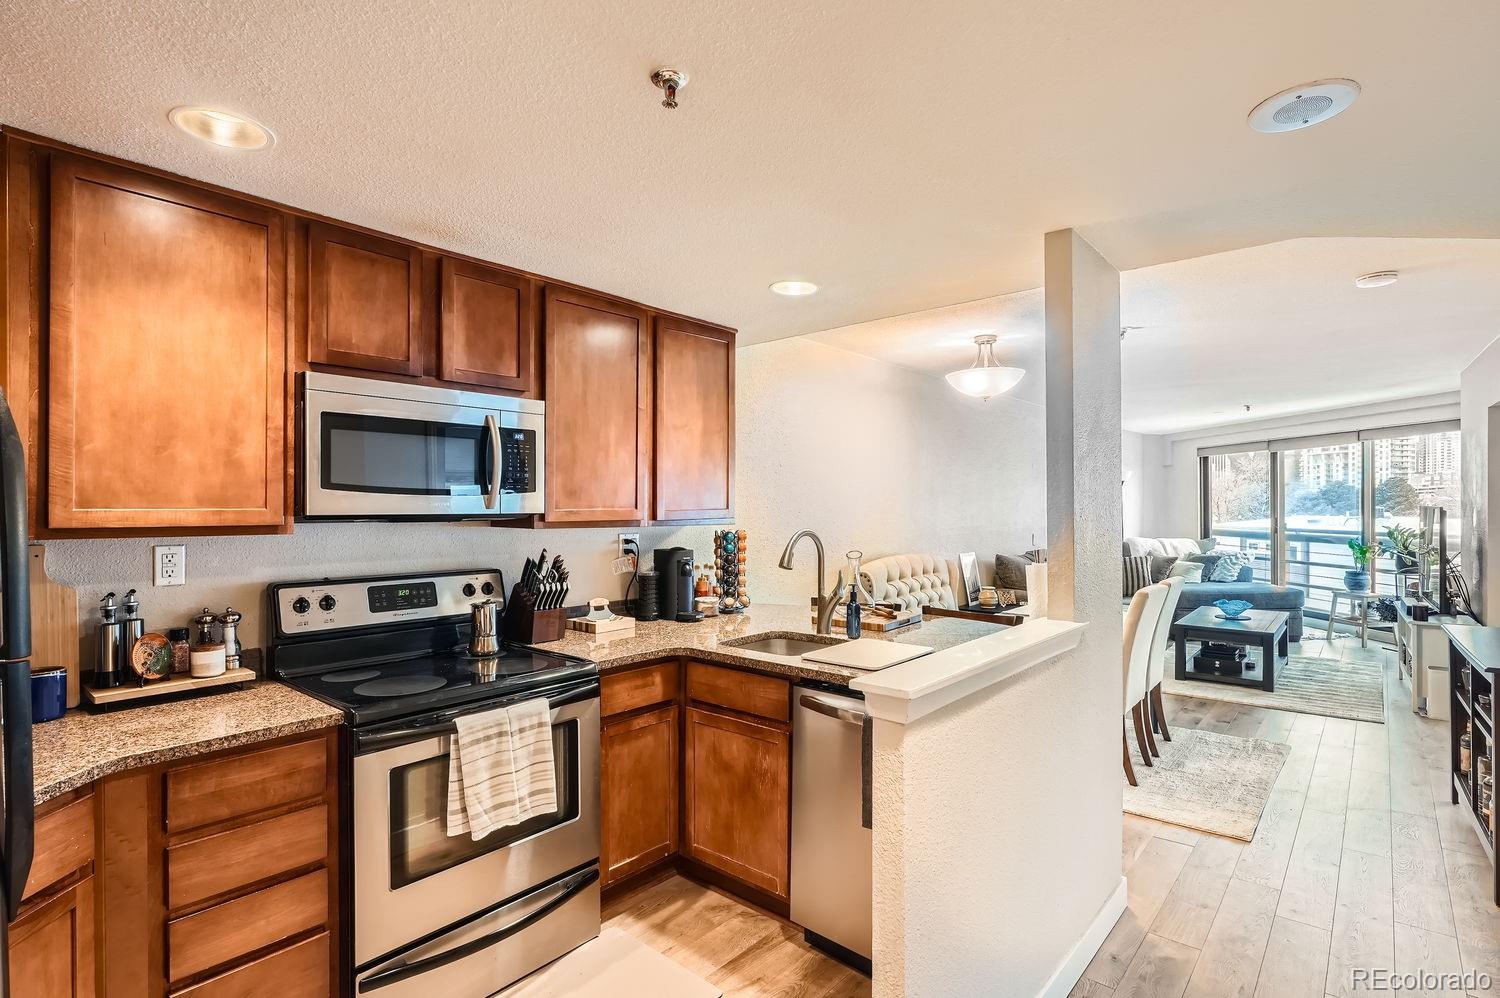
Active
$500,000
2
bds
|
2
ba
|
982
sqft
|
built
2020
1898 S Bannock St, Denver, CO 80223
$-1,231
Cash flow
-12.8%
Cash-on-Cash Return
3.3%
Cap rate
0.6%
Rent to Value Ratio
Active
$819,000
3
bds
|
4
ba
|
2,524
sqft
|
built
2008
2314 S University Blvd, Denver, CO 80210
$-2,295
Cash flow
-14.6%
Cash-on-Cash Return
2.9%
Cap rate
0.5%
Rent to Value Ratio
Active
$245,000
1
bds
|
1
ba
|
779
sqft
|
built
1984
100 Park Ave W, Denver, CO 80205
$-655
Cash flow
-13.9%
Cash-on-Cash Return
3.1%
Cap rate
0.9%
Rent to Value Ratio
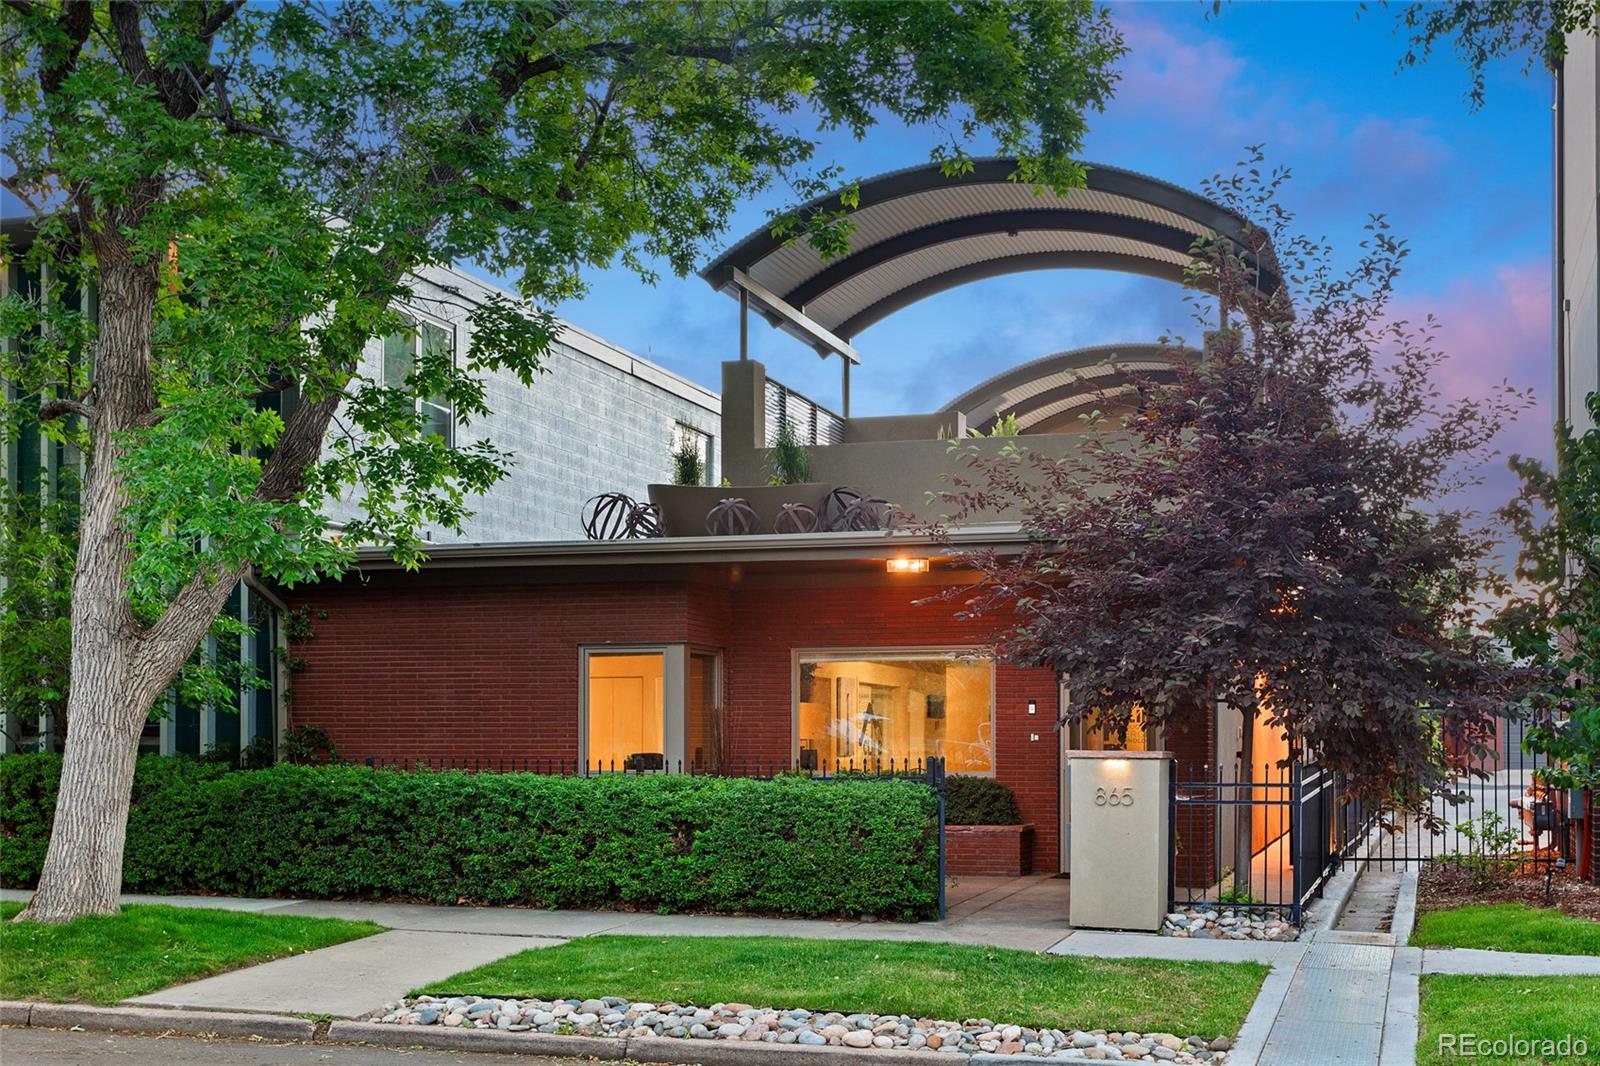
Active
$1,775,000
3
bds
|
3
ba
|
3,679
sqft
|
built
1964
865 Delaware St, Denver, CO 80204
$-3,802
Cash flow
-11.2%
Cash-on-Cash Return
3.7%
Cap rate
0.5%
Rent to Value Ratio
Active
$1,184,000
4
bds
|
3
ba
|
2,070
sqft
|
built
2013
3361 Mariposa St, Denver, CO 80211
$-3,122
Cash flow
-13.8%
Cash-on-Cash Return
3.1%
Cap rate
0.4%
Rent to Value Ratio
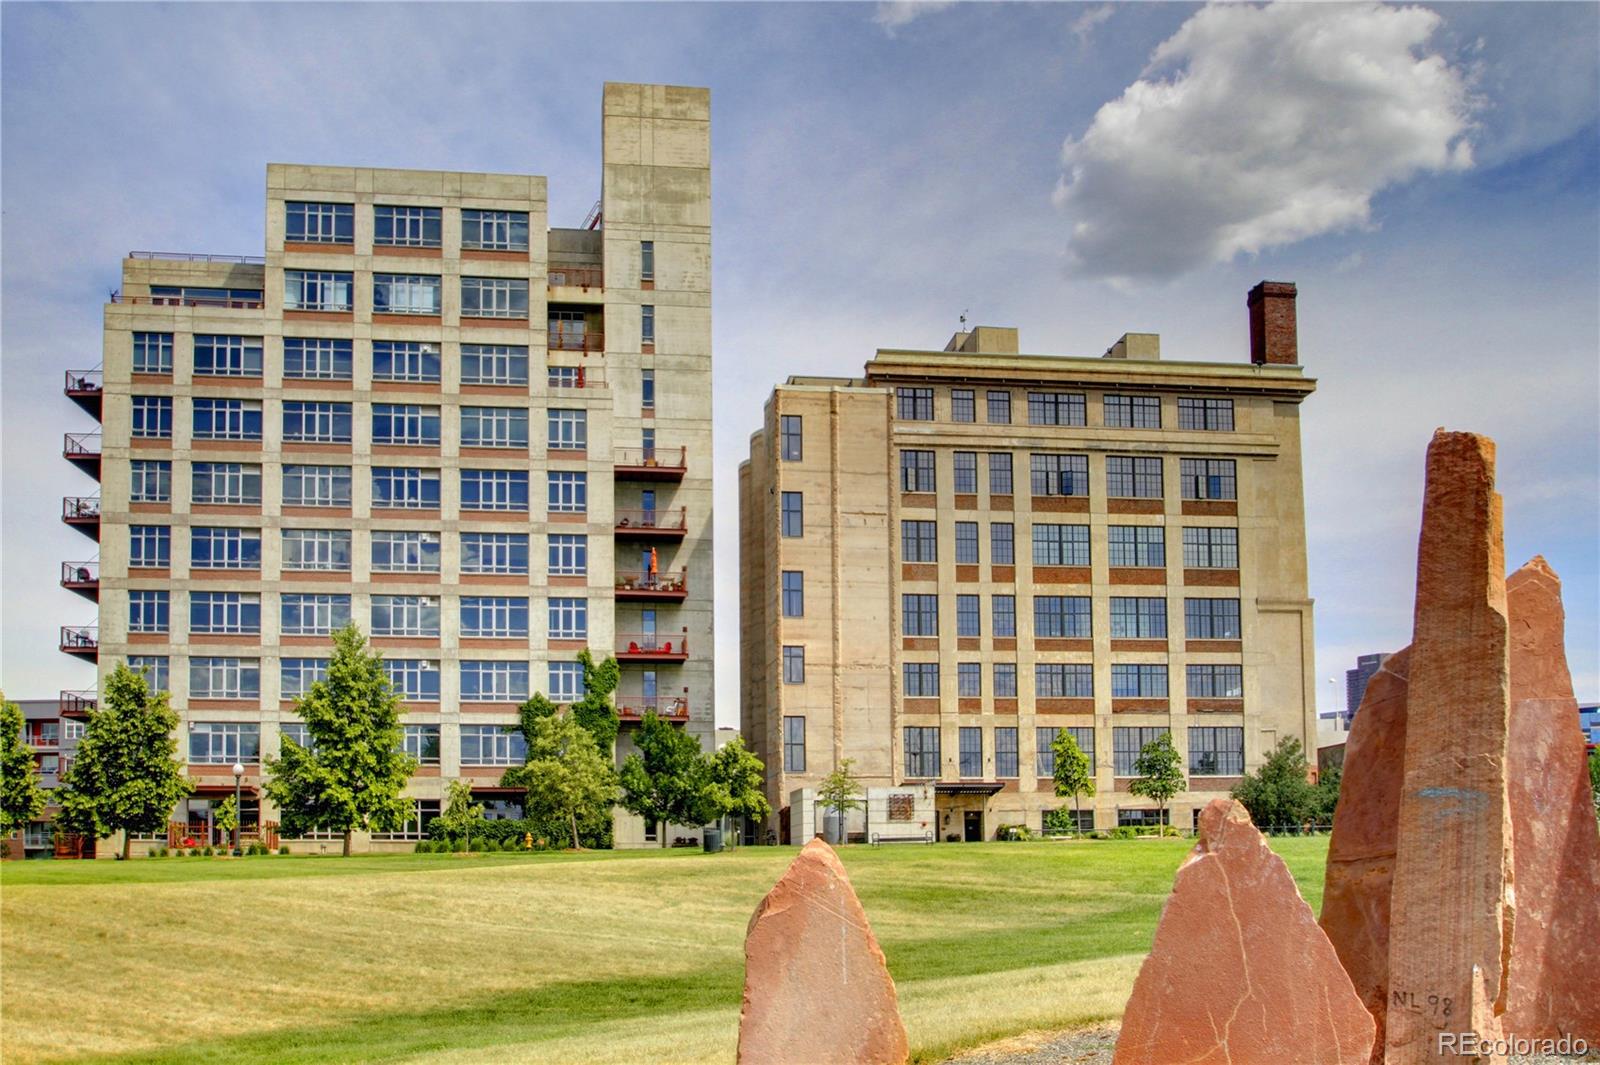
Active
$1,950,000
2
bds
|
2
ba
|
3,444
sqft
|
built
1920
2000 Little Raven St, Denver, CO 80202
$-9,691
Cash flow
-25.9%
Cash-on-Cash Return
0.3%
Cap rate
0.3%
Rent to Value Ratio
Active under contract
$375,000
2
bds
|
1
ba
|
672
sqft
|
built
1949
1941 Wabash St, Denver, CO 80220
$-749
Cash flow
-10.4%
Cash-on-Cash Return
3.9%
Cap rate
0.5%
Rent to Value Ratio
Active
$325,000
2
bds
|
1
ba
|
1,069
sqft
|
built
1947
1210 E Colfax Ave, Denver, CO 80218
$-869
Cash flow
-14.0%
Cash-on-Cash Return
3.1%
Cap rate
0.7%
Rent to Value Ratio
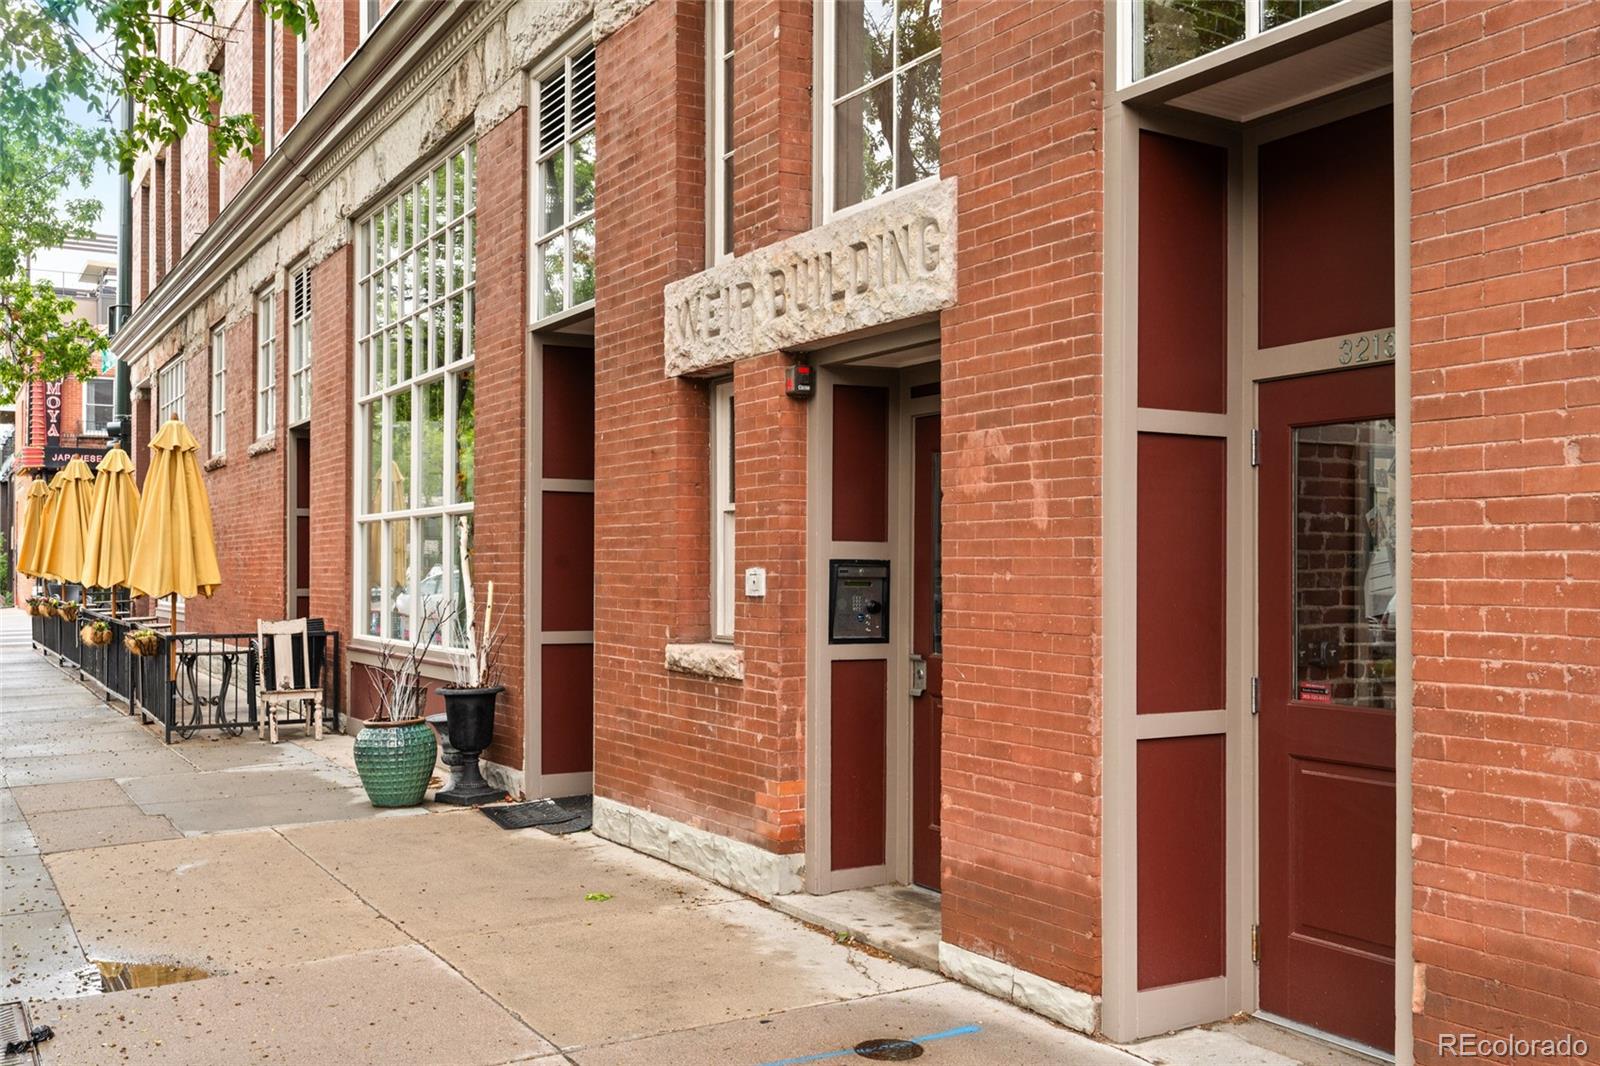
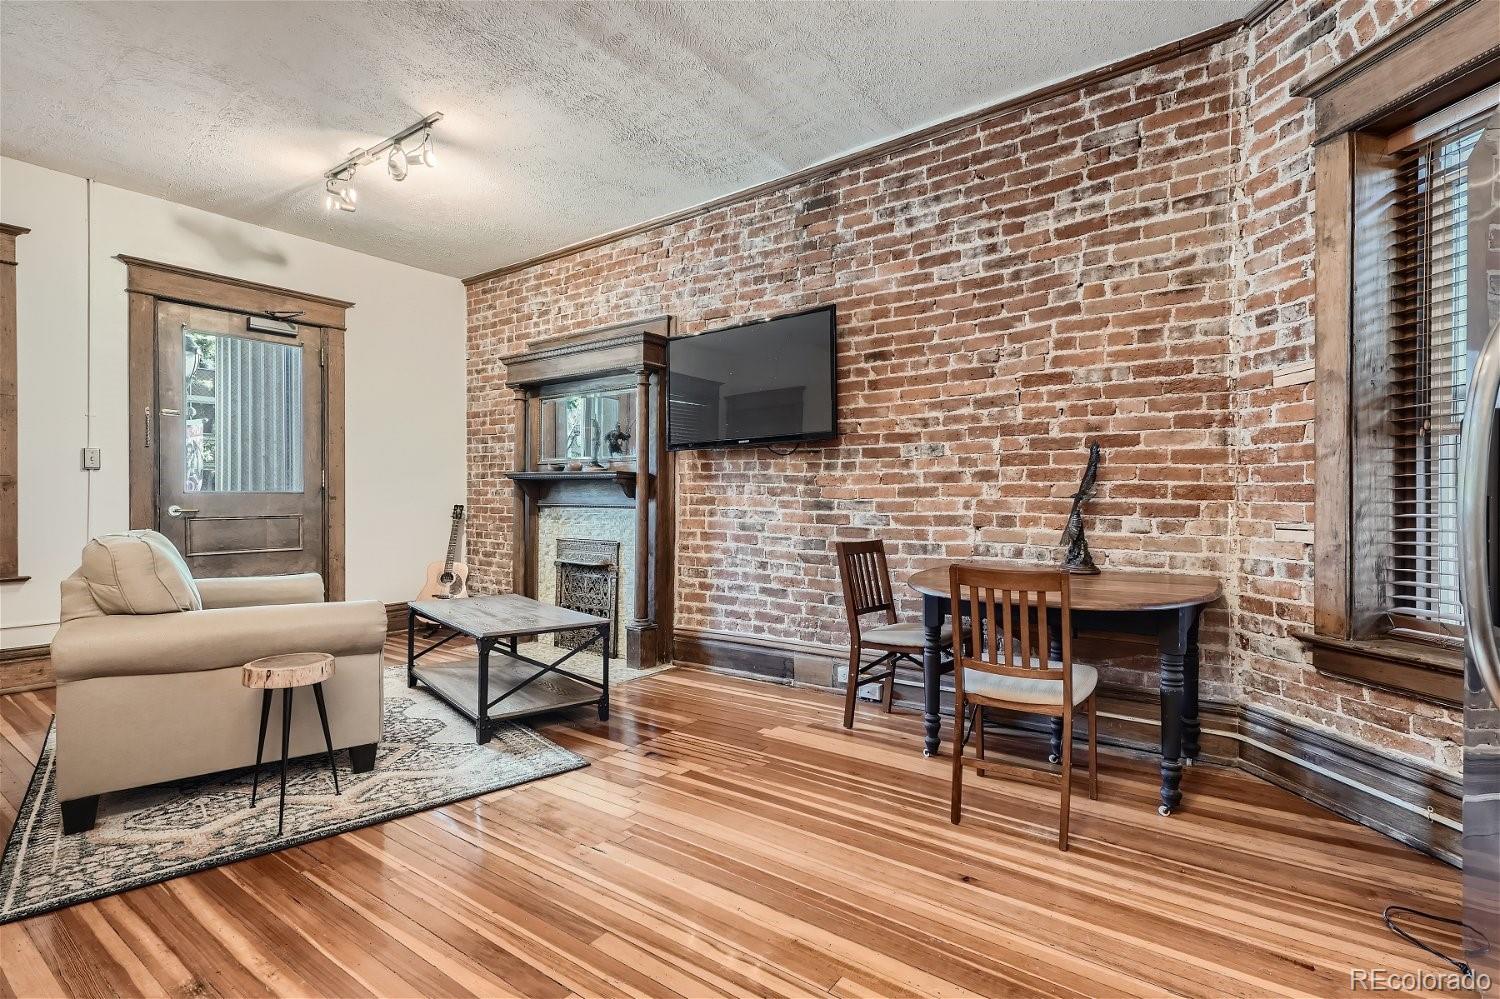
Active
$420,000
1
bds
|
1
ba
|
648
sqft
|
built
1902
3211 Zuni St, Denver, CO 80211
$-1,101
Cash flow
-13.7%
Cash-on-Cash Return
3.1%
Cap rate
0.5%
Rent to Value Ratio
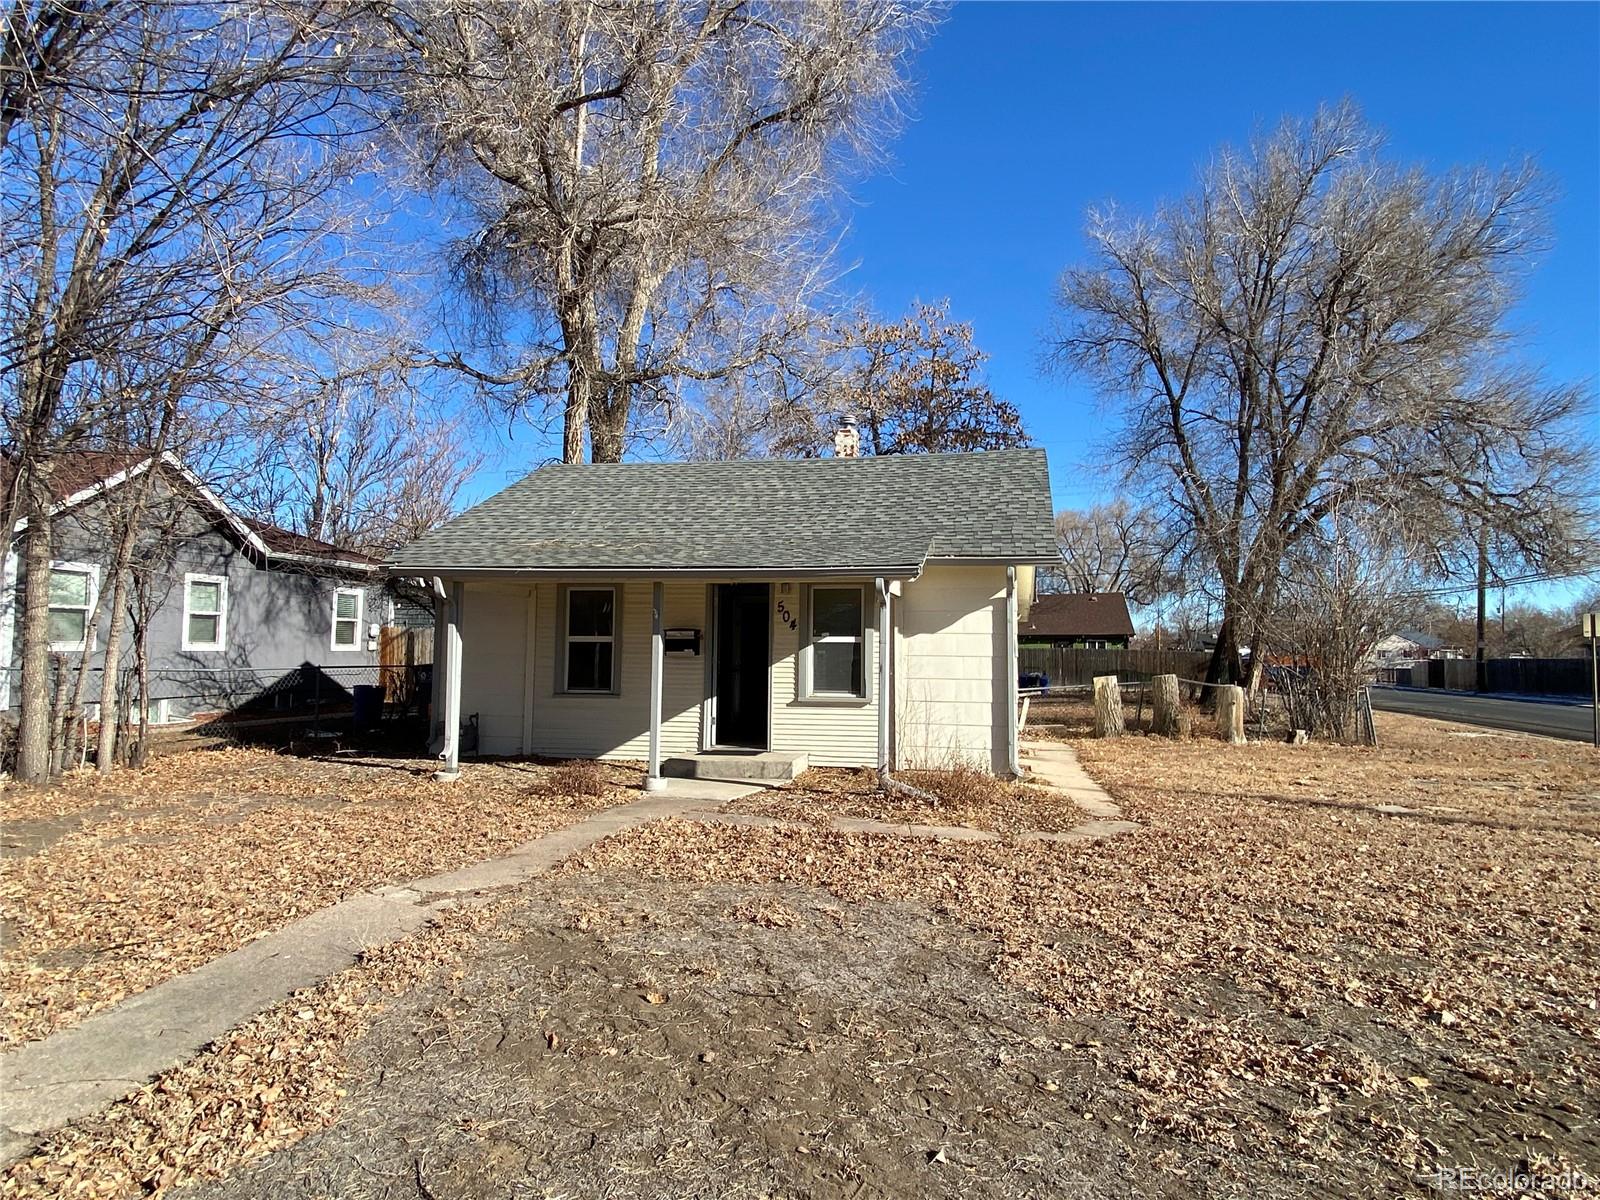
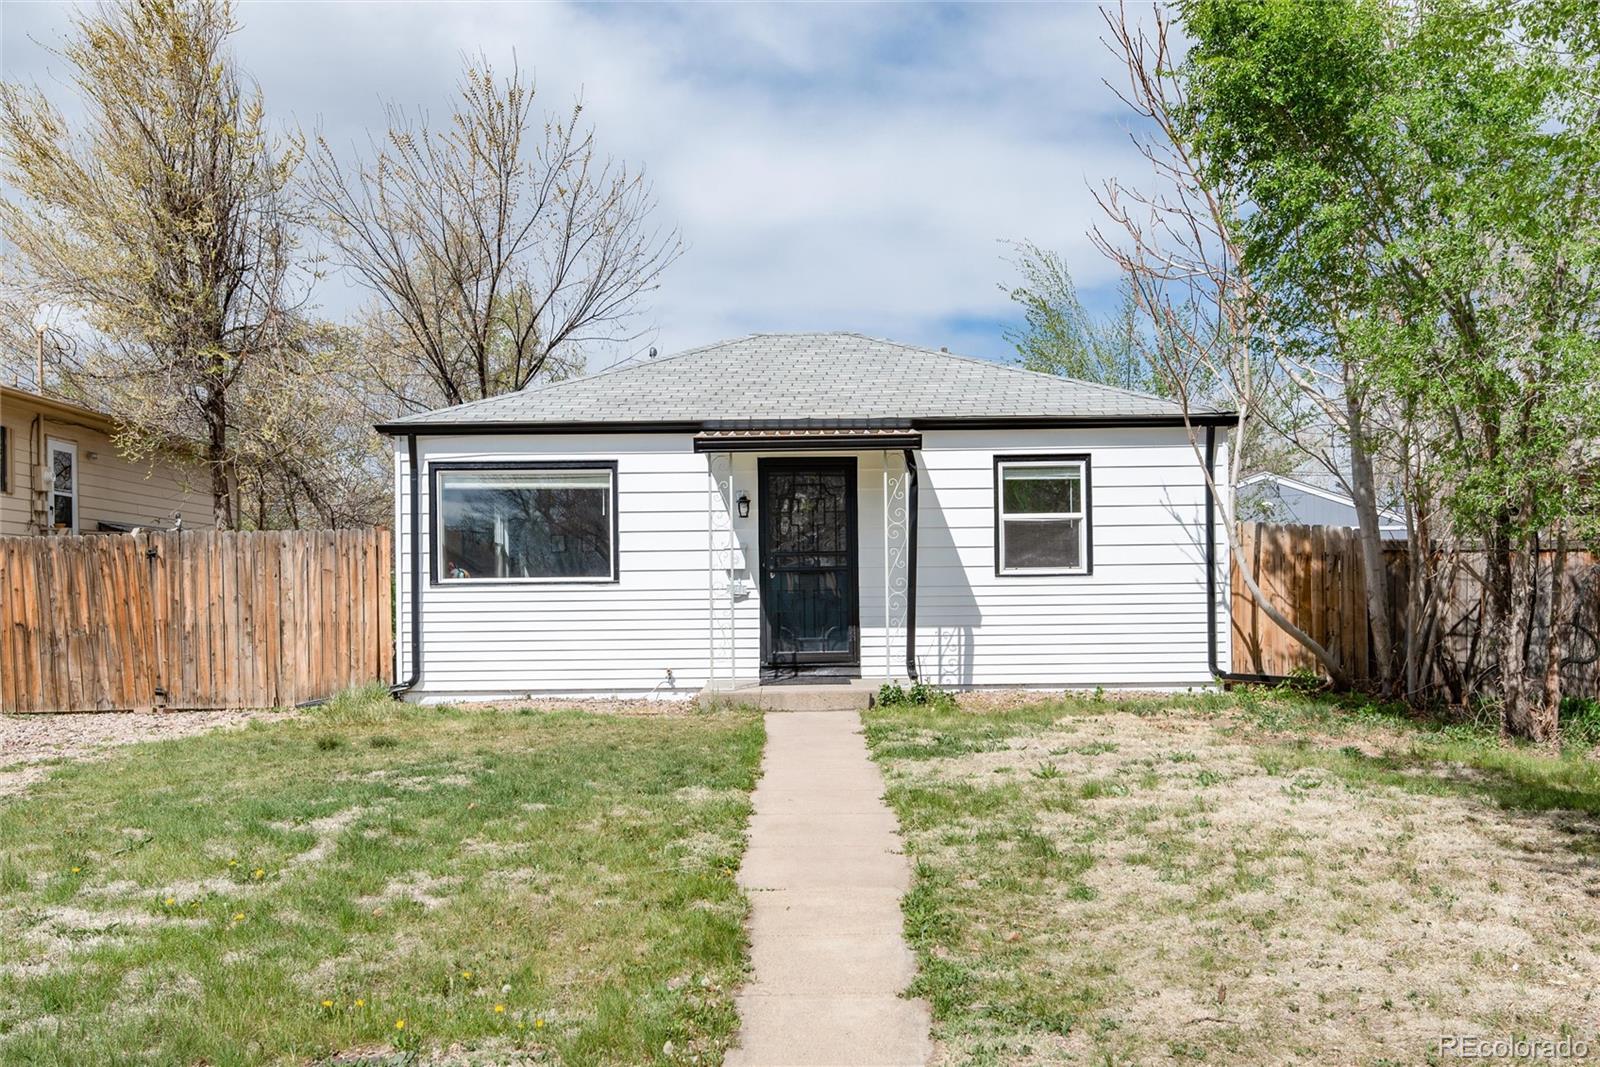
Active
$350,000
2
bds
|
1
ba
|
748
sqft
|
built
1924
504 Quitman St, Denver, CO 80204
$-674
Cash flow
-10.0%
Cash-on-Cash Return
4.0%
Cap rate
0.5%
Rent to Value Ratio

Active
$3,950,000
4
bds
|
7
ba
|
6,109
sqft
|
built
2005
445 Madison St, Denver, CO 80206
$-18,298
Cash flow
-24.2%
Cash-on-Cash Return
0.7%
Cap rate
0.2%
Rent to Value Ratio
Active
$880,000
3
bds
|
3
ba
|
2,289
sqft
|
built
1930
4625 W 50th Ave, Denver, CO 80212
$-2,669
Cash flow
-15.8%
Cash-on-Cash Return
2.6%
Cap rate
0.6%
Rent to Value Ratio
Active
$865,000
4
bds
|
4
ba
|
2,473
sqft
|
built
1998
7860 E Ellsworth Ave, Denver, CO 80230
$-2,896
Cash flow
-17.5%
Cash-on-Cash Return
2.3%
Cap rate
0.4%
Rent to Value Ratio
Active
$745,000
4
bds
|
3
ba
|
3,002
sqft
|
built
1996
1011 S Valentia St, Denver, CO 80247
$-2,149
Cash flow
-15.0%
Cash-on-Cash Return
2.8%
Cap rate
0.5%
Rent to Value Ratio
Active
$257,000
1
bds
|
1
ba
|
545
sqft
|
built
1965
799 Dahlia St, Denver, CO 80220
$-655
Cash flow
-13.3%
Cash-on-Cash Return
3.2%
Cap rate
0.6%
Rent to Value Ratio
Active
$1,975,000
2
bds
|
3
ba
|
2,384
sqft
|
built
2010
1133 14th St, Denver, CO 80202
$-9,440
Cash flow
-24.9%
Cash-on-Cash Return
0.5%
Cap rate
0.4%
Rent to Value Ratio
Active
$590,000
3
bds
|
2
ba
|
1,415
sqft
|
built
1940
1455 Dexter St, Denver, CO 80220
$-1,116
Cash flow
-9.9%
Cash-on-Cash Return
4.0%
Cap rate
0.5%
Rent to Value Ratio
Active
$299,999
2
bds
|
2
ba
|
1,173
sqft
|
built
1968
3855 S Monaco Pkwy, Denver, CO 80237
$-787
Cash flow
-13.7%
Cash-on-Cash Return
3.1%
Cap rate
0.7%
Rent to Value Ratio
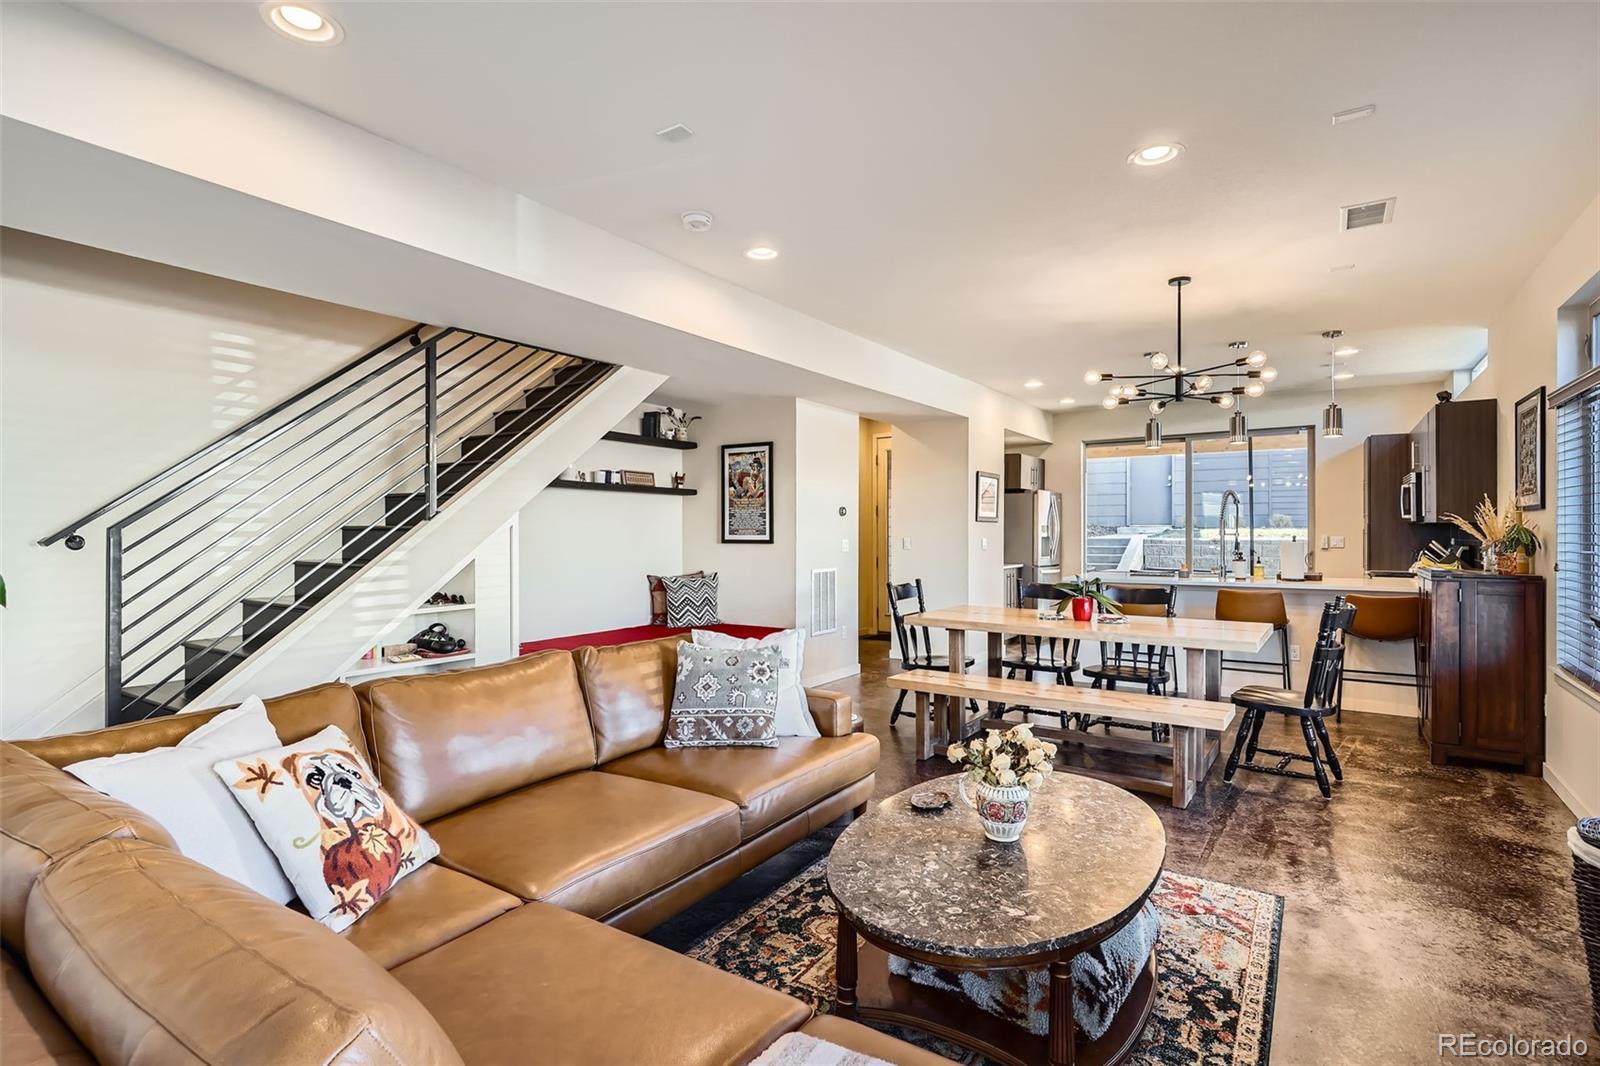
Active
$835,000
5
bds
|
4
ba
|
2,684
sqft
|
built
2019
2004 S Galapago St, Denver, CO 80223
$-1,250
Cash flow
-7.8%
Cash-on-Cash Return
4.5%
Cap rate
0.6%
Rent to Value Ratio
Active
$510,000
2
bds
|
2
ba
|
1,783
sqft
|
built
1983
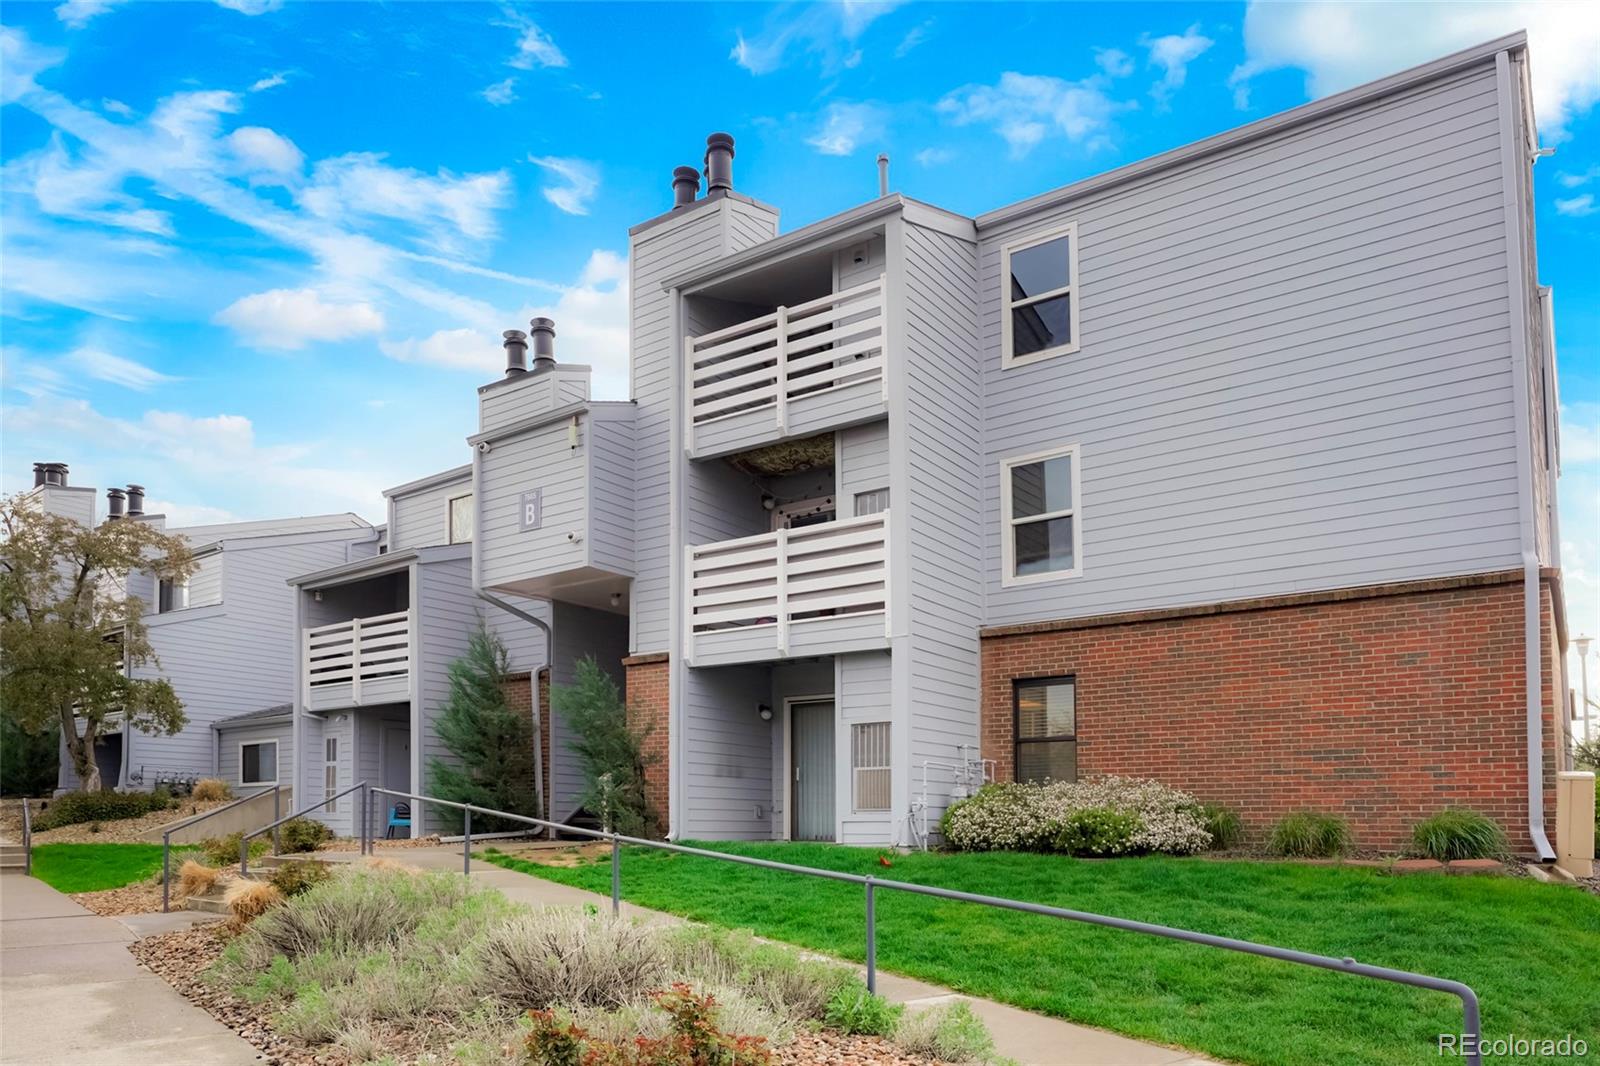
1578 S Syracuse St, Denver, CO 80231
$-1,037
Cash flow
-10.6%
Cash-on-Cash Return
3.8%
Cap rate
0.5%
Rent to Value Ratio
Active
$374,000
2
bds
|
2
ba
|
1,551
sqft
|
built
1982
2685 S Dayton Way, Denver, CO 80231
$-1,121
Cash flow
-15.6%
Cash-on-Cash Return
2.7%
Cap rate
0.5%
Rent to Value Ratio
Active
$599,000
1
bds
|
2
ba
|
1,123
sqft
|
built
2015
3198 Blake St, Denver, CO 80205
$-1,795
Cash flow
-15.6%
Cash-on-Cash Return
2.7%
Cap rate
0.5%
Rent to Value Ratio
Active
$290,000
2
bds
|
2
ba
|
1,024
sqft
|
built
1969
6495 E Happy Canyon Rd, Denver, CO 80237
$-635
Cash flow
-11.4%
Cash-on-Cash Return
3.7%
Cap rate
0.7%
Rent to Value Ratio
Active
$240,000
1
bds
|
1
ba
|
692
sqft
|
built
1978
4400 S Quebec St, Denver, CO 80237
$-667
Cash flow
-14.5%
Cash-on-Cash Return
2.9%
Cap rate
0.6%
Rent to Value Ratio
Active
$305,000
2
bds
|
2
ba
|
1,080
sqft
|
built
1974
1060 S Parker Rd, Denver, CO 80231
$-542
Cash flow
-9.3%
Cash-on-Cash Return
4.2%
Cap rate
0.7%
Rent to Value Ratio
Active
$235,000
bds
|
1
ba
|
462
sqft
|
built
1958
969 S Pearl St, Denver, CO 80209
$-604
Cash flow
-13.4%
Cash-on-Cash Return
3.2%
Cap rate
0.7%
Rent to Value Ratio
Active
$449,000
2
bds
|
2
ba
|
921
sqft
|
built
1938
3930 W Kentucky Ave, Denver, CO 80219
$-682
Cash flow
-7.9%
Cash-on-Cash Return
4.5%
Cap rate
0.6%
Rent to Value Ratio
Active
$165,000
1
bds
|
1
ba
|
405
sqft
|
built
1908
215 E 11th Ave, Denver, CO 80203
$-501
Cash flow
-15.8%
Cash-on-Cash Return
2.6%
Cap rate
0.8%
Rent to Value Ratio
Active
$325,000
2
bds
|
1
ba
|
852
sqft
|
built
1945
2872 Jasmine St, Denver, CO 80207
$-668
Cash flow
-10.7%
Cash-on-Cash Return
3.8%
Cap rate
0.7%
Rent to Value Ratio
Active
$179,900
1
bds
|
1
ba
|
654
sqft
|
built
1980
10150 E Virginia Ave, Denver, CO 80247
$-402
Cash flow
-11.7%
Cash-on-Cash Return
3.6%
Cap rate
0.8%
Rent to Value Ratio
Active
$448,400
4
bds
|
2
ba
|
1,661
sqft
|
built
1980
14425 Albrook Dr, Denver, CO 80239
$-776
Cash flow
-9.0%
Cash-on-Cash Return
4.2%
Cap rate
0.6%
Rent to Value Ratio
Active
$443,900
4
bds
|
2
ba
|
1,638
sqft
|
built
1970
13192 Maxwell Pl, Denver, CO 80239
$-756
Cash flow
-8.9%
Cash-on-Cash Return
4.2%
Cap rate
0.6%
Rent to Value Ratio
Active
$249,800
2
bds
|
2
ba
|
914
sqft
|
built
1978
7665 E Eastman Ave, Denver, CO 80231
$-608
Cash flow
-12.7%
Cash-on-Cash Return
3.4%
Cap rate
0.7%
Rent to Value Ratio
Active
$425,000
2
bds
|
1
ba
|
1,060
sqft
|
built
1946
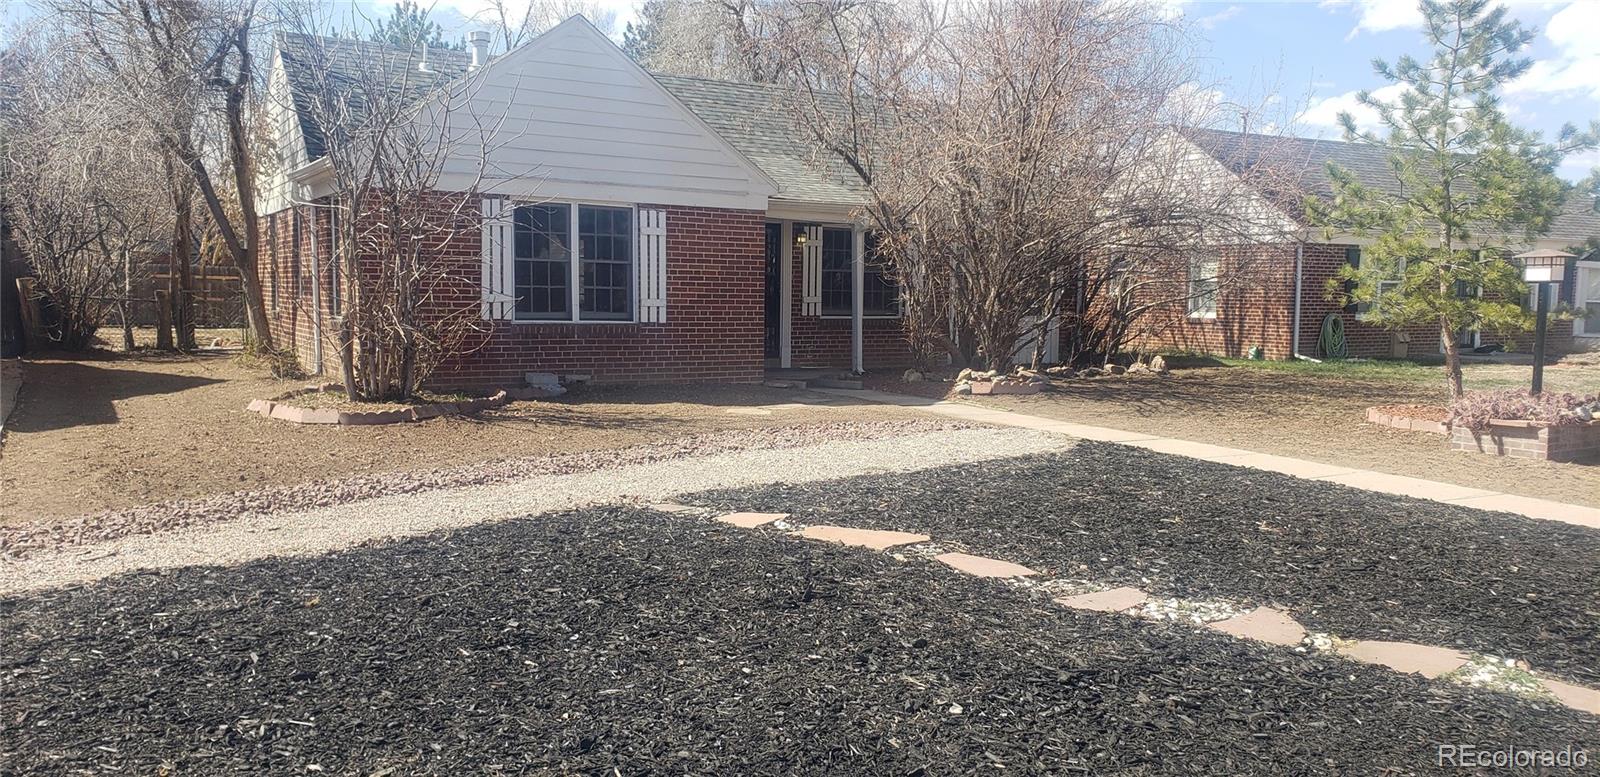
1971 Roslyn St, Denver, CO 80220
$-490
Cash flow
-6.0%
Cash-on-Cash Return
4.9%
Cap rate
0.7%
Rent to Value Ratio
Active
$439,900
3
bds
|
3
ba
|
1,758
sqft
|
built
2002
20000 Mitchell Pl, Denver, CO 80249
$-764
Cash flow
-9.1%
Cash-on-Cash Return
4.2%
Cap rate
0.6%
Rent to Value Ratio
Active
$480,000
3
bds
|
3
ba
|
1,708
sqft
|
built
2001
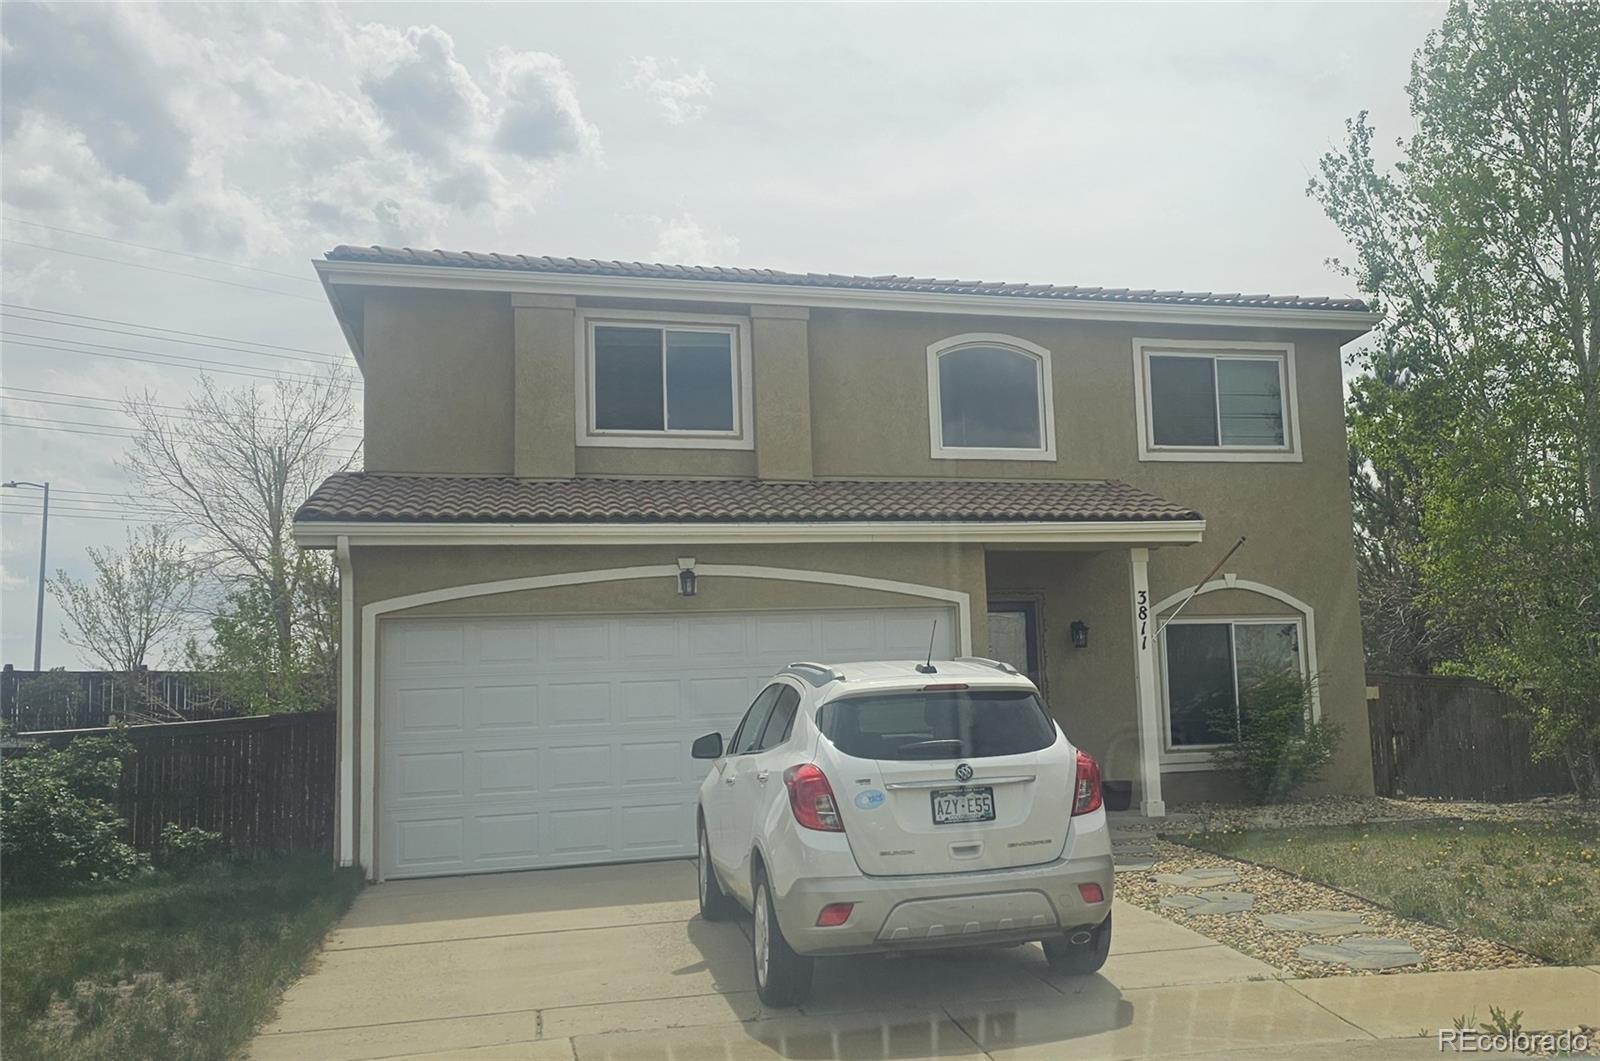
3811 Lisbon Ct, Denver, CO 80249
$-827
Cash flow
-9.0%
Cash-on-Cash Return
4.2%
Cap rate
0.6%
Rent to Value Ratio
Active
$200,000
2
bds
|
2
ba
|
980
sqft
|
built
1969
9240 E Girard Ave, Denver, CO 80231
$-215
Cash flow
-5.6%
Cash-on-Cash Return
5.0%
Cap rate
0.9%
Rent to Value Ratio
Active
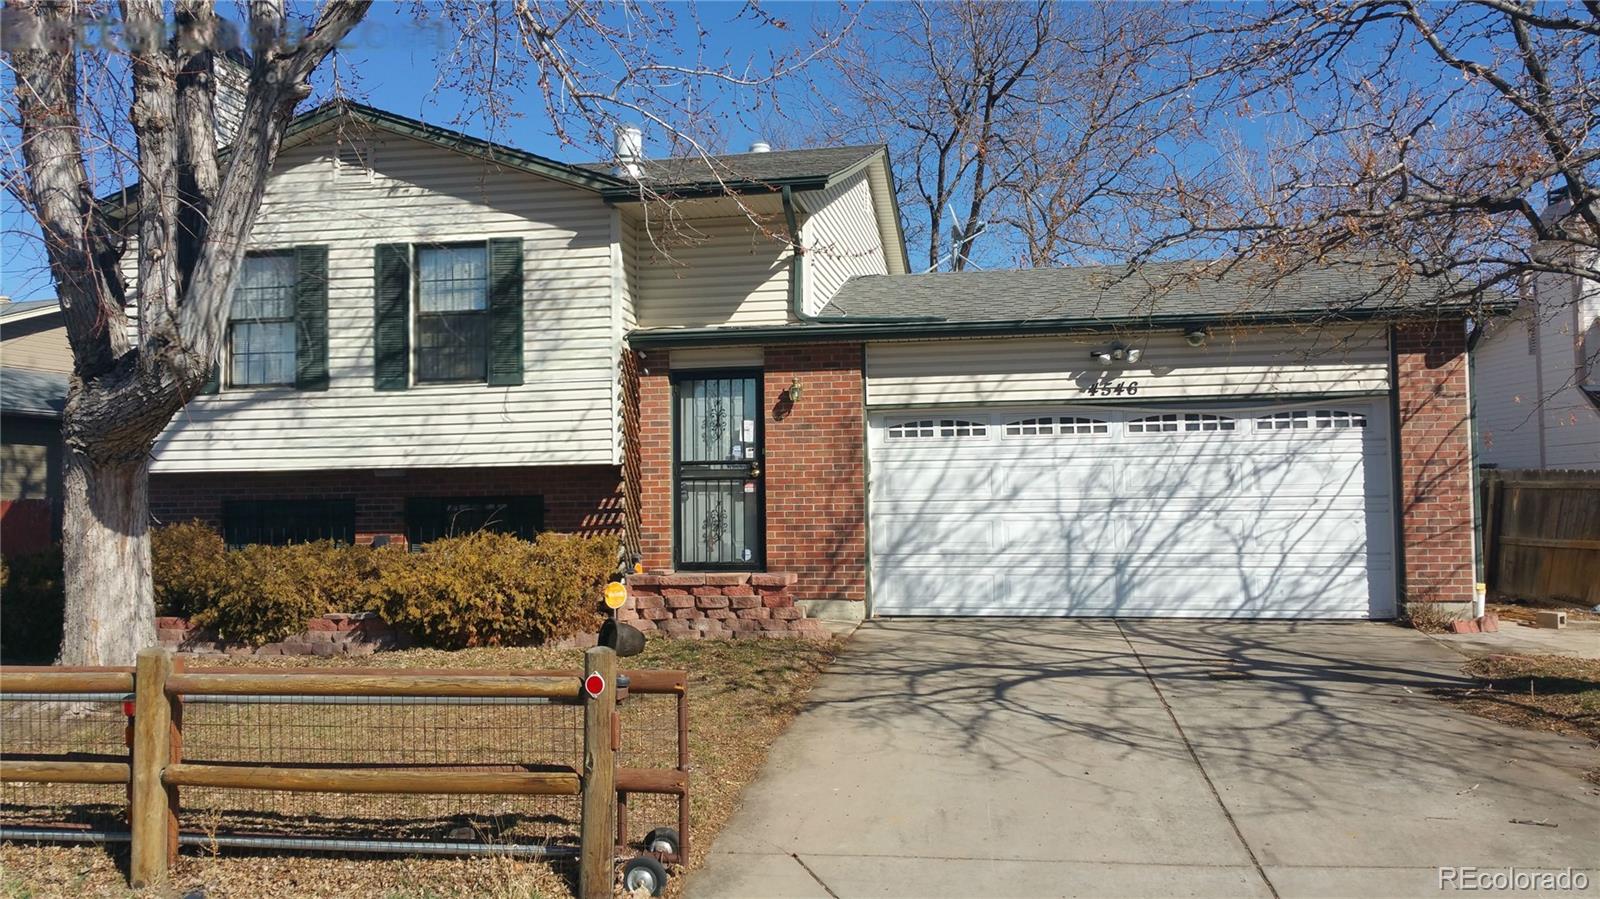
$398,900
2
bds
|
1
ba
|
1,703
sqft
|
built
1982
4546 Durham Ct, Denver, CO 80239
$-540
Cash flow
-7.1%
Cash-on-Cash Return
4.7%
Cap rate
0.6%
Rent to Value Ratio
Active
$205,000
2
bds
|
1
ba
|
952
sqft
|
built
1971
7455 E Quincy Ave, Denver, CO 80237
$-603
Cash flow
-15.3%
Cash-on-Cash Return
2.8%
Cap rate
0.8%
Rent to Value Ratio
Active
$599,000
3
bds
|
2
ba
|
1,536
sqft
|
built
1953
424 S Leyden St, Denver, CO 80224
$-1,170
Cash flow
-10.2%
Cash-on-Cash Return
3.9%
Cap rate
0.5%
Rent to Value Ratio