Denver County Investment Properties for Sale
Browse homes for sale and investment properties in Denver County. Refine your search by price, property type, or more.
Best cash flowing properties in Denver County
Active
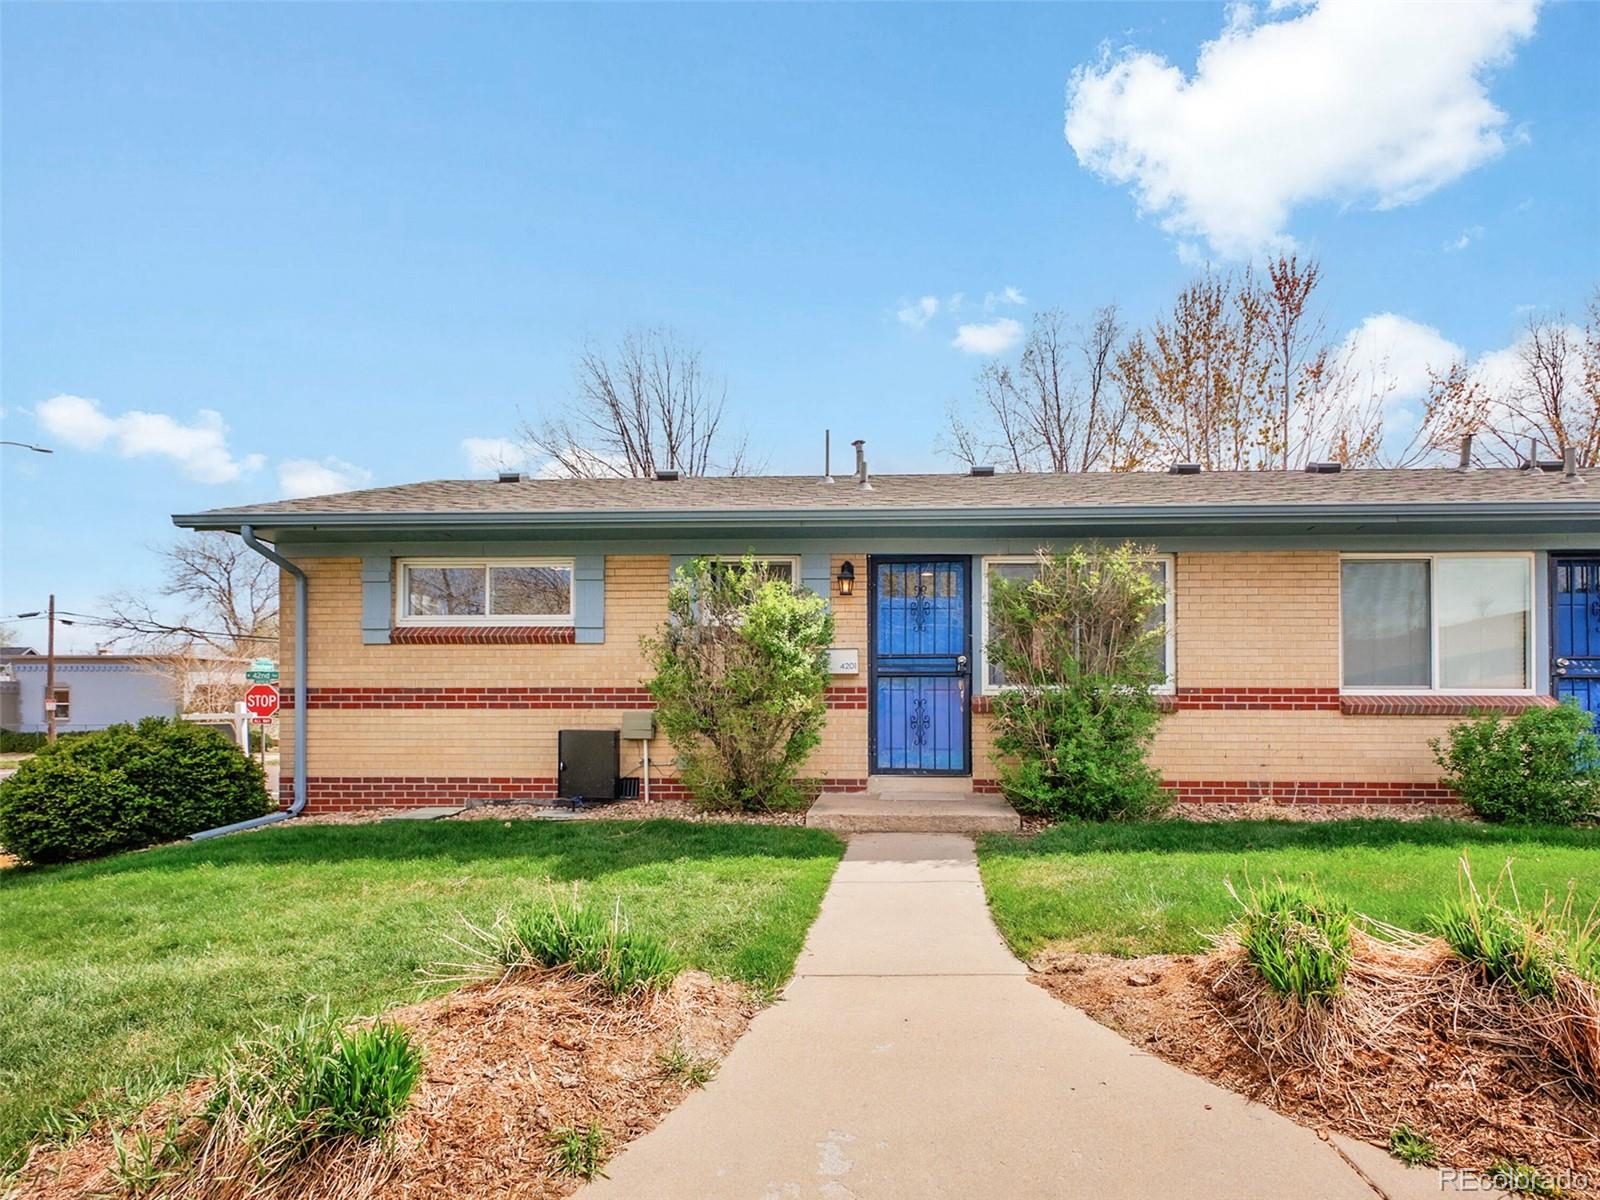
$419,000
2
bds
|
1
ba
|
675
sqft
|
built
1959
4201 Shoshone St, Denver, CO 80211
$-189
Cash flow
-2.4%
Cash-on-Cash Return
5.1%
Cap rate
0.6%
Rent to Value Ratio
Active under contract
$310,000
2
bds
|
2
ba
|
1,249
sqft
|
built
2005
5800 Tower Rd, Denver, CO 80249
$-463
Cash flow
-7.8%
Cash-on-Cash Return
3.9%
Cap rate
0.7%
Rent to Value Ratio
3,095 out of 3,205 properties for sale in Denver County
Limited Results Shown
Create a free account, or log in to reveal all property listings and enjoy the complete experience.
Active
$488,000
3
bds
|
1
ba
|
986
sqft
|
built
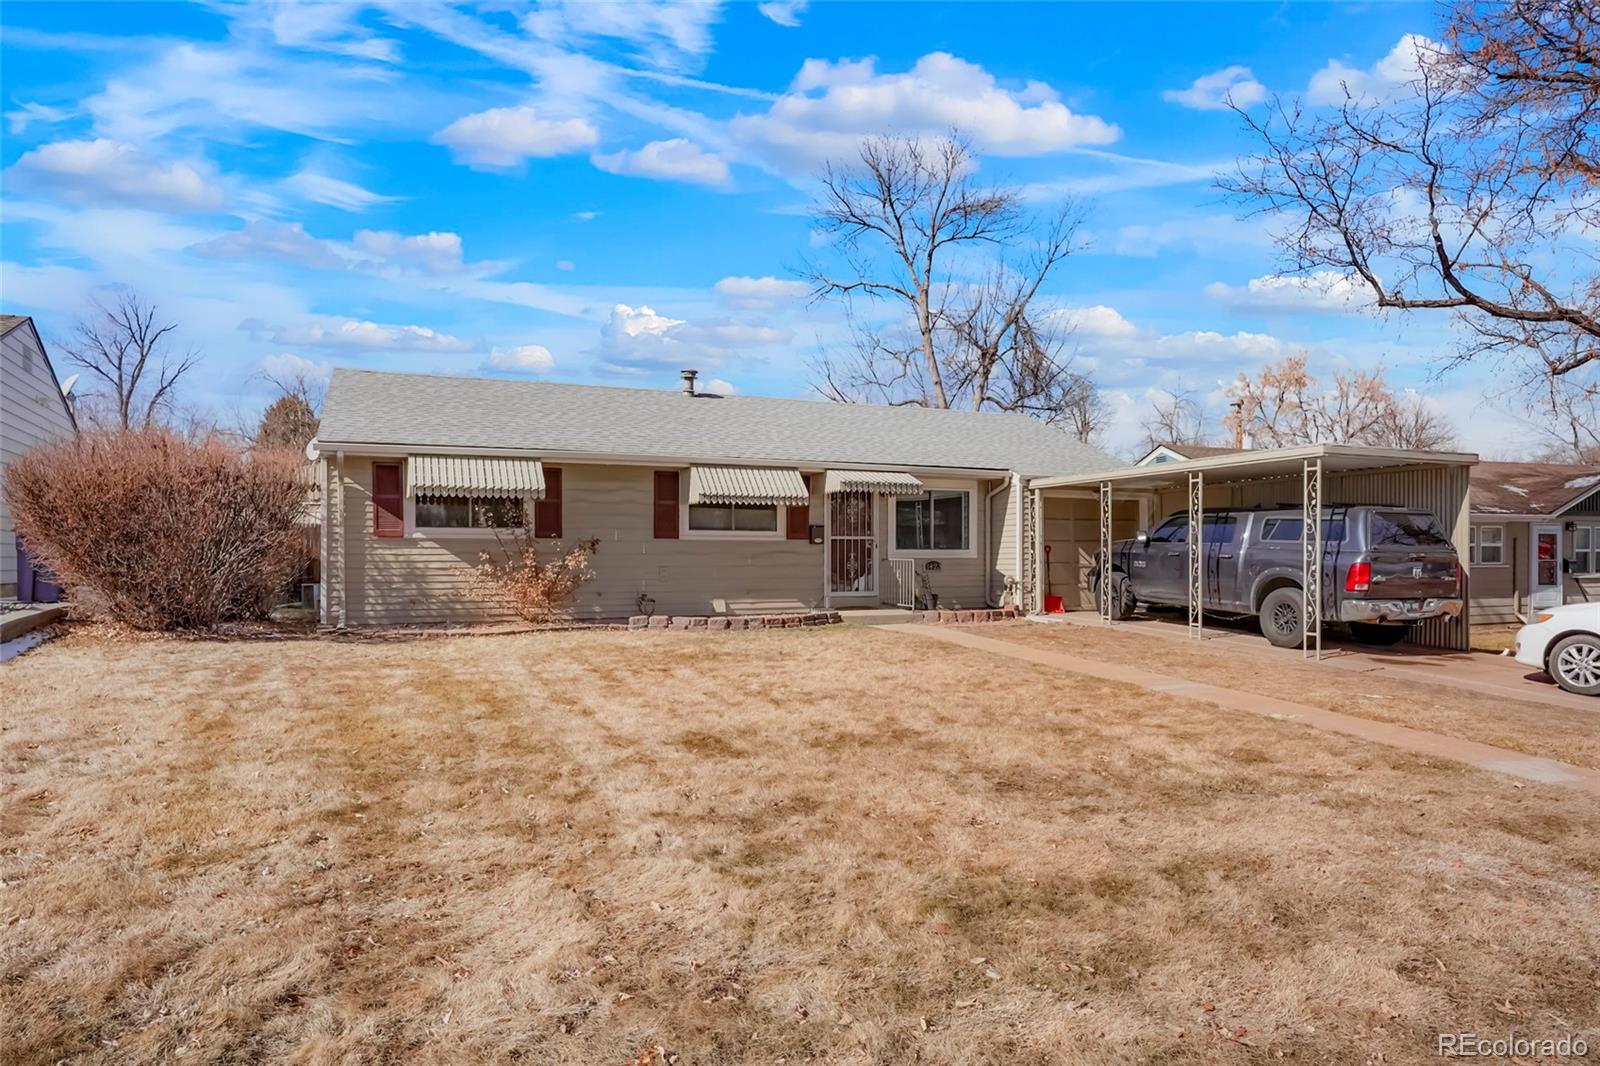
1953
3423 S Glencoe St, Denver, CO 80222
$-775
Cash flow
-8.3%
Cash-on-Cash Return
3.8%
Cap rate
0.5%
Rent to Value Ratio
Active
$545,000
3
bds
|
3
ba
|
1,528
sqft
|
built
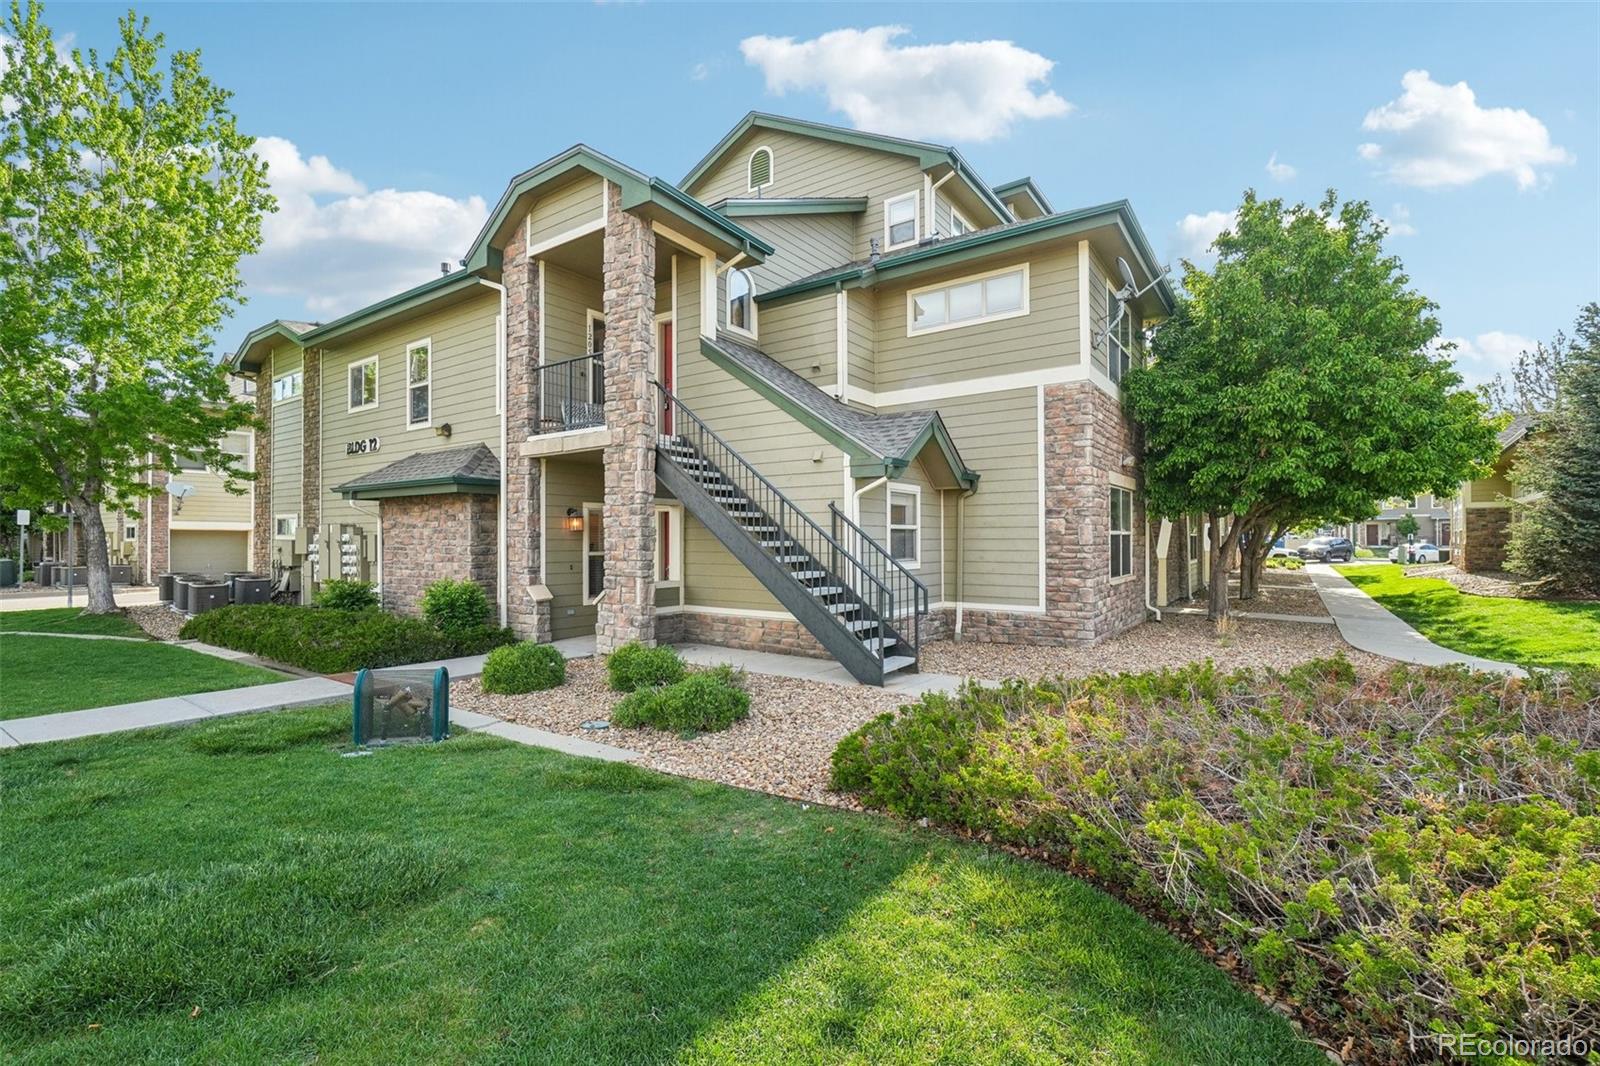
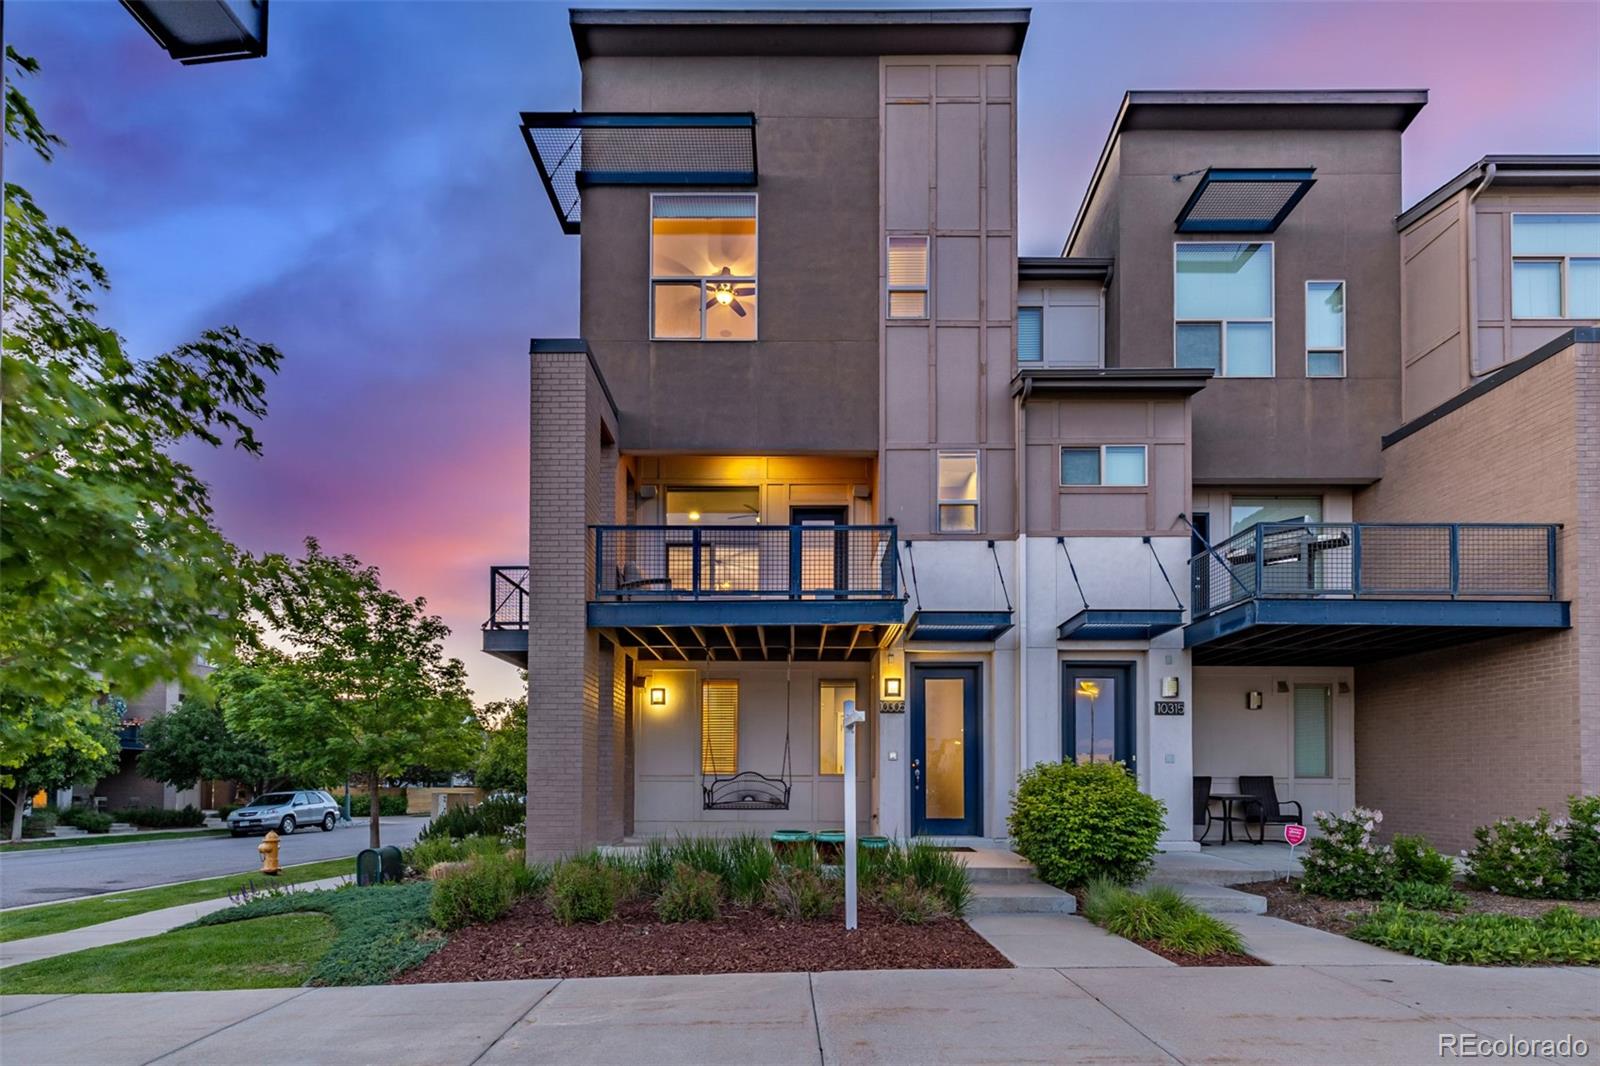
2013
10305 Martin Luther King Blvd, Denver, CO 80238
$-1,237
Cash flow
-11.8%
Cash-on-Cash Return
3.0%
Cap rate
0.6%
Rent to Value Ratio
Active
$339,900
1
bds
|
1
ba
|
717
sqft
|
built
1905
720 16th St, Denver, CO 80202
$-908
Cash flow
-13.9%
Cash-on-Cash Return
2.5%
Cap rate
0.6%
Rent to Value Ratio
Active
$341,158
2
bds
|
1
ba
|
737
sqft
|
built
2017
1750 Wewatta St, Denver, CO 80202
$-1,070
Cash flow
-16.4%
Cash-on-Cash Return
1.9%
Cap rate
0.6%
Rent to Value Ratio
Active
$2,200,000
5
bds
|
5
ba
|
5,131
sqft
|
built
2008
1143 S Saint Paul St, Denver, CO 80210
$-5,898
Cash flow
-14.0%
Cash-on-Cash Return
2.5%
Cap rate
0.4%
Rent to Value Ratio
Active
$515,000
1
bds
|
1
ba
|
893
sqft
|
built
2009
891 14th St, Denver, CO 80202
$-220,448
Cash flow
-2233.3%
Cash-on-Cash Return
-508.0%
Cap rate
0.5%
Rent to Value Ratio
Active
$345,000
2
bds
|
2
ba
|
1,428
sqft
|
built
1974
7865 E Mississippi Ave, Denver, CO 80247
$-916
Cash flow
-13.9%
Cash-on-Cash Return
2.5%
Cap rate
0.7%
Rent to Value Ratio
Active
$339,900
2
bds
|
1
ba
|
710
sqft
|
built
1969
120 S Pennsylvania St, Denver, CO 80209
$-811
Cash flow
-12.4%
Cash-on-Cash Return
2.8%
Cap rate
0.6%
Rent to Value Ratio
Active
$400,000
1
bds
|
1
ba
|
1,008
sqft
|
built
2003
2100 N Humboldt St, Denver, CO 80205
$-803
Cash flow
-10.5%
Cash-on-Cash Return
3.3%
Cap rate
0.6%
Rent to Value Ratio
Active
$245,000
3
bds
|
2
ba
|
1,138
sqft
|
built
1972
9995 E Harvard Ave, Denver, CO 80231
$-637
Cash flow
-13.6%
Cash-on-Cash Return
2.6%
Cap rate
0.7%
Rent to Value Ratio
Active
$780,000
4
bds
|
2
ba
|
1,492
sqft
|
built
1951
1901 S Adams St, Denver, CO 80210
$-1,838
Cash flow
-12.3%
Cash-on-Cash Return
2.9%
Cap rate
0.4%
Rent to Value Ratio
Active
$365,000
3
bds
|
2
ba
|
1,297
sqft
|
built
2003
8481 W Union Ave, Littleton, CO 80123
$-667
Cash flow
-9.5%
Cash-on-Cash Return
3.5%
Cap rate
0.6%
Rent to Value Ratio
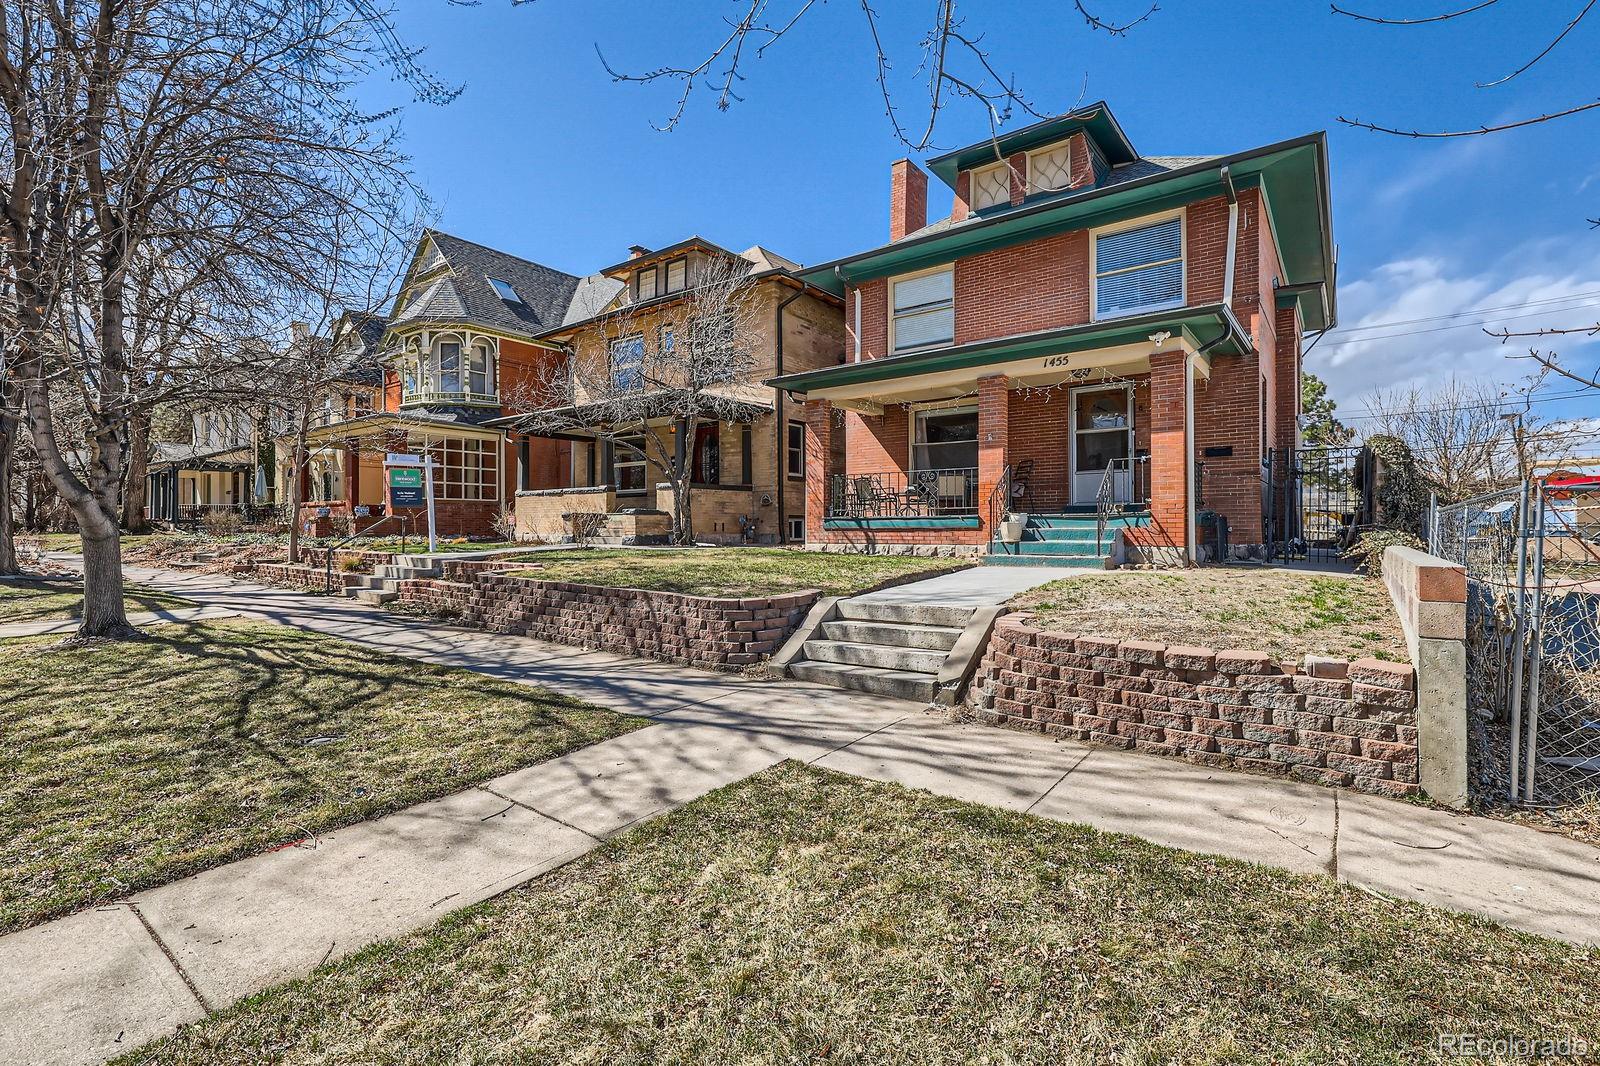
Active
$899,000
6
bds
|
3
ba
|
2,199
sqft
|
built
1904
1455 N Gilpin St, Denver, CO 80218
$-1,878
Cash flow
-10.9%
Cash-on-Cash Return
3.2%
Cap rate
0.4%
Rent to Value Ratio
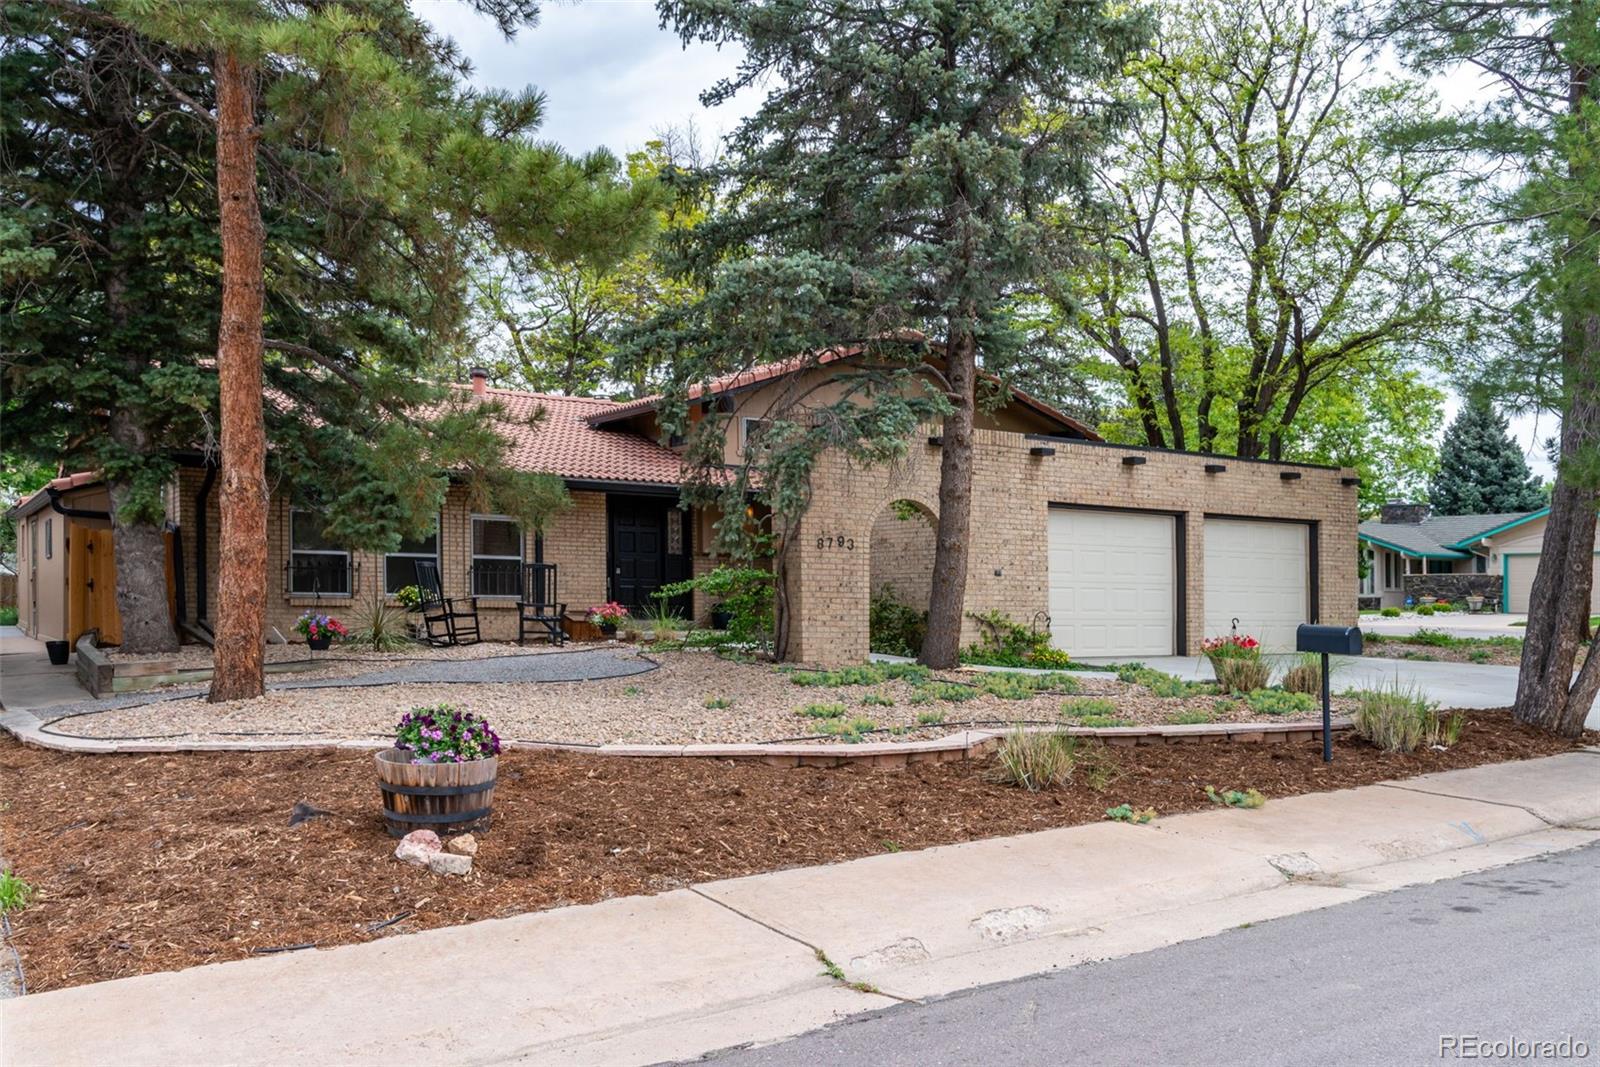
Active
$820,000
5
bds
|
4
ba
|
2,774
sqft
|
built
1970
8793 E Monmouth Pl, Denver, CO 80237
$-1,941
Cash flow
-12.3%
Cash-on-Cash Return
2.8%
Cap rate
0.4%
Rent to Value Ratio
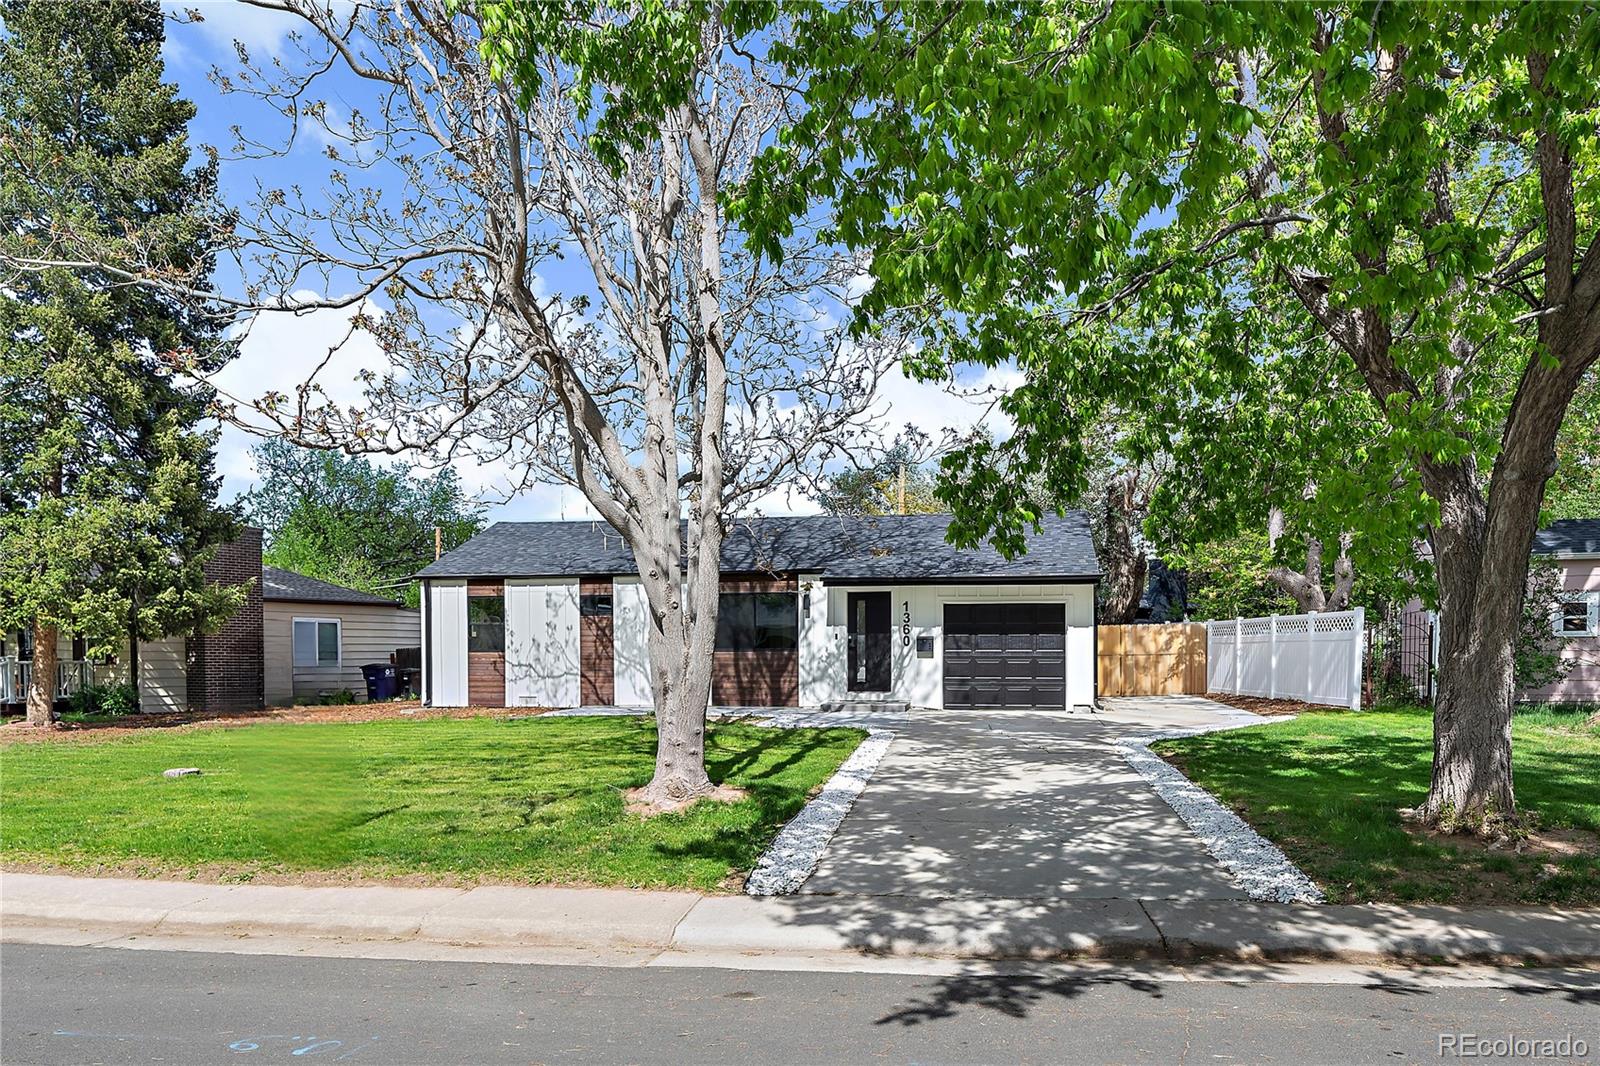
Active under contract
$595,000
3
bds
|
2
ba
|
853
sqft
|
built
1951
1360 S Forest Way, Denver, CO 80222
$-1,027
Cash flow
-9.0%
Cash-on-Cash Return
3.6%
Cap rate
0.5%
Rent to Value Ratio
Active
$554,400
5
bds
|
3
ba
|
3,396
sqft
|
built
2005
21476 E 53rd Pl, Denver, CO 80249
$-943
Cash flow
-8.9%
Cash-on-Cash Return
3.6%
Cap rate
0.5%
Rent to Value Ratio
Active
$1,099,000
3
bds
|
3
ba
|
1,935
sqft
|
built
1924
1835 S Lincoln St, Denver, CO 80210
$-3,044
Cash flow
-14.5%
Cash-on-Cash Return
2.4%
Cap rate
0.3%
Rent to Value Ratio
Active
$324,000
1
bds
|
1
ba
|
786
sqft
|
built
1961
200 N Pearl St, Denver, CO 80203
$-839
Cash flow
-13.5%
Cash-on-Cash Return
2.6%
Cap rate
0.6%
Rent to Value Ratio
Active
$320,000
2
bds
|
1
ba
|
825
sqft
|
built
1966
1350 Josephine St, Denver, CO 80206
$-797
Cash flow
-13.0%
Cash-on-Cash Return
2.7%
Cap rate
0.6%
Rent to Value Ratio
Active
$419,000
2
bds
|
1
ba
|
675
sqft
|
built
1959
4201 Shoshone St, Denver, CO 80211
$-189
Cash flow
-2.4%
Cash-on-Cash Return
5.1%
Cap rate
0.6%
Rent to Value Ratio
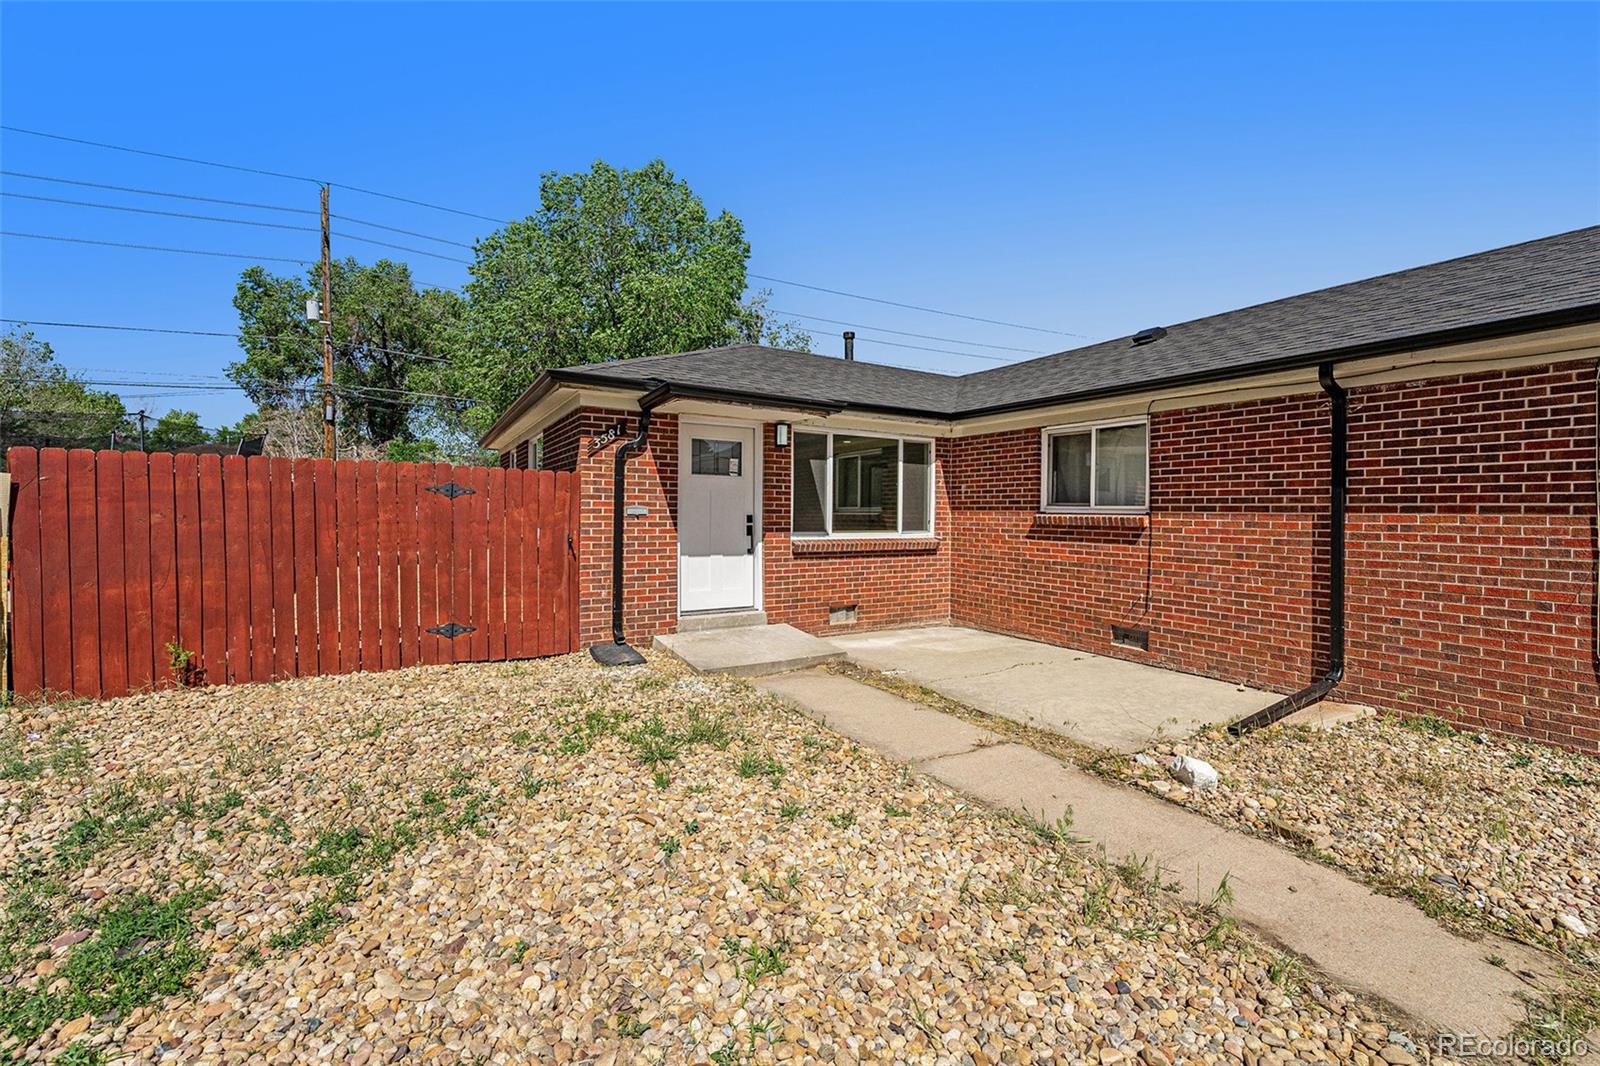
Active
$429,500
2
bds
|
1
ba
|
816
sqft
|
built
1953
3581 Olive St, Denver, CO 80207
$-797
Cash flow
-9.7%
Cash-on-Cash Return
3.5%
Cap rate
0.5%
Rent to Value Ratio
Active
$594,900
4
bds
|
2
ba
|
1,804
sqft
|
built
1963
3841 W Quinn Pl, Denver, CO 80236
$-831
Cash flow
-7.3%
Cash-on-Cash Return
4.0%
Cap rate
0.5%
Rent to Value Ratio
Active
$647,500
4
bds
|
4
ba
|
2,971
sqft
|
built
1988
10000 E Yale Ave, Denver, CO 80231
$-1,216
Cash flow
-9.8%
Cash-on-Cash Return
3.4%
Cap rate
0.6%
Rent to Value Ratio

Active
$1,600,000
2
bds
|
2
ba
|
2,129
sqft
|
built
1905
1792 Wynkoop St, Denver, CO 80202
$-5,716
Cash flow
-18.6%
Cash-on-Cash Return
1.4%
Cap rate
0.3%
Rent to Value Ratio
Active
$1,150,000
3
bds
|
3
ba
|
2,082
sqft
|
built
1903
432 N Ogden St, Denver, CO 80218
$-2,747
Cash flow
-12.5%
Cash-on-Cash Return
2.8%
Cap rate
0.4%
Rent to Value Ratio
Active
$1,200,000
5
bds
|
5
ba
|
4,171
sqft
|
built
2003
8053 E Maple Ave, Denver, CO 80230
$-3,174
Cash flow
-13.8%
Cash-on-Cash Return
2.5%
Cap rate
0.4%
Rent to Value Ratio
Active
$865,000
2
bds
|
3
ba
|
1,462
sqft
|
built
2019
1750 Wewatta St, Denver, CO 80202
$-2,972
Cash flow
-17.9%
Cash-on-Cash Return
1.6%
Cap rate
0.5%
Rent to Value Ratio
Active
$405,000
1
bds
|
1
ba
|
826
sqft
|
built
2003
1440 Little Raven St, Denver, CO 80202
$-1,009
Cash flow
-13.0%
Cash-on-Cash Return
2.7%
Cap rate
0.5%
Rent to Value Ratio
Active
$540,000
3
bds
|
1
ba
|
960
sqft
|
built
1953
1801 S Eudora St, Denver, CO 80222
$-845
Cash flow
-8.2%
Cash-on-Cash Return
3.8%
Cap rate
0.5%
Rent to Value Ratio
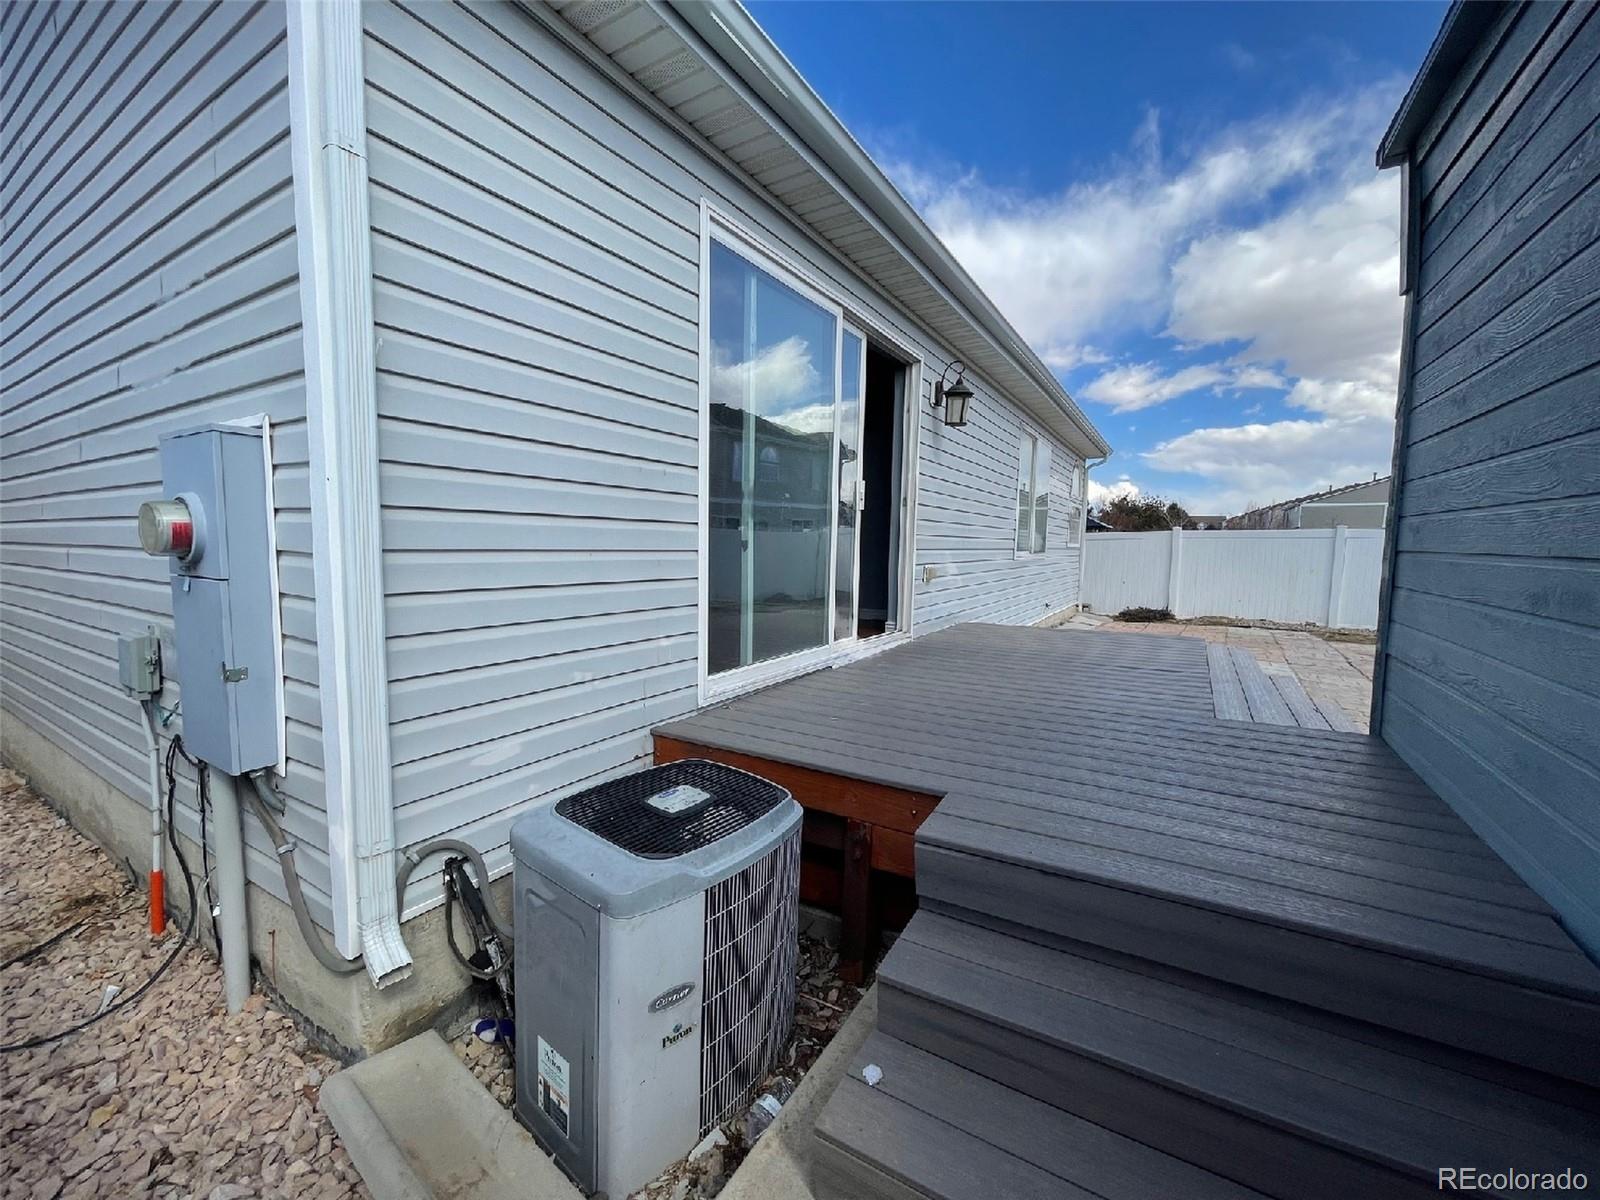
Active under contract
$310,000
2
bds
|
2
ba
|
1,249
sqft
|
built
2005
5800 Tower Rd, Denver, CO 80249
$-463
Cash flow
-7.8%
Cash-on-Cash Return
3.9%
Cap rate
0.7%
Rent to Value Ratio
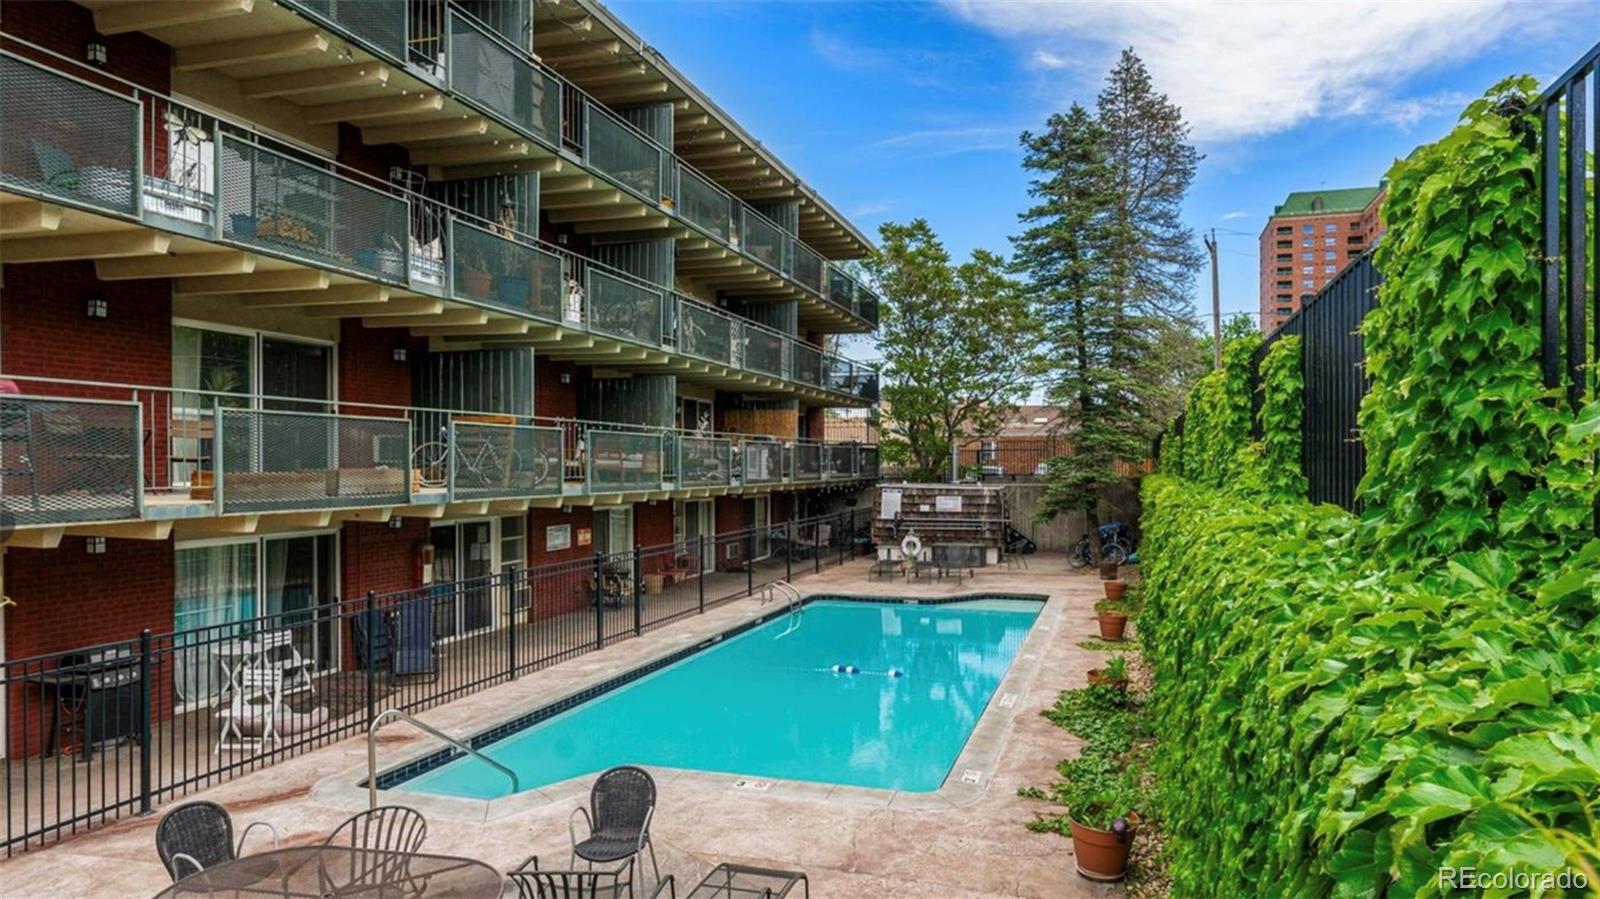
Active
$188,000
1
bds
|
1
ba
|
700
sqft
|
built
1973
2835 S Monaco Pkwy, Denver, CO 80222
$-358,240
Cash flow
-9941.9%
Cash-on-Cash Return
-2281.0%
Cap rate
0.8%
Rent to Value Ratio
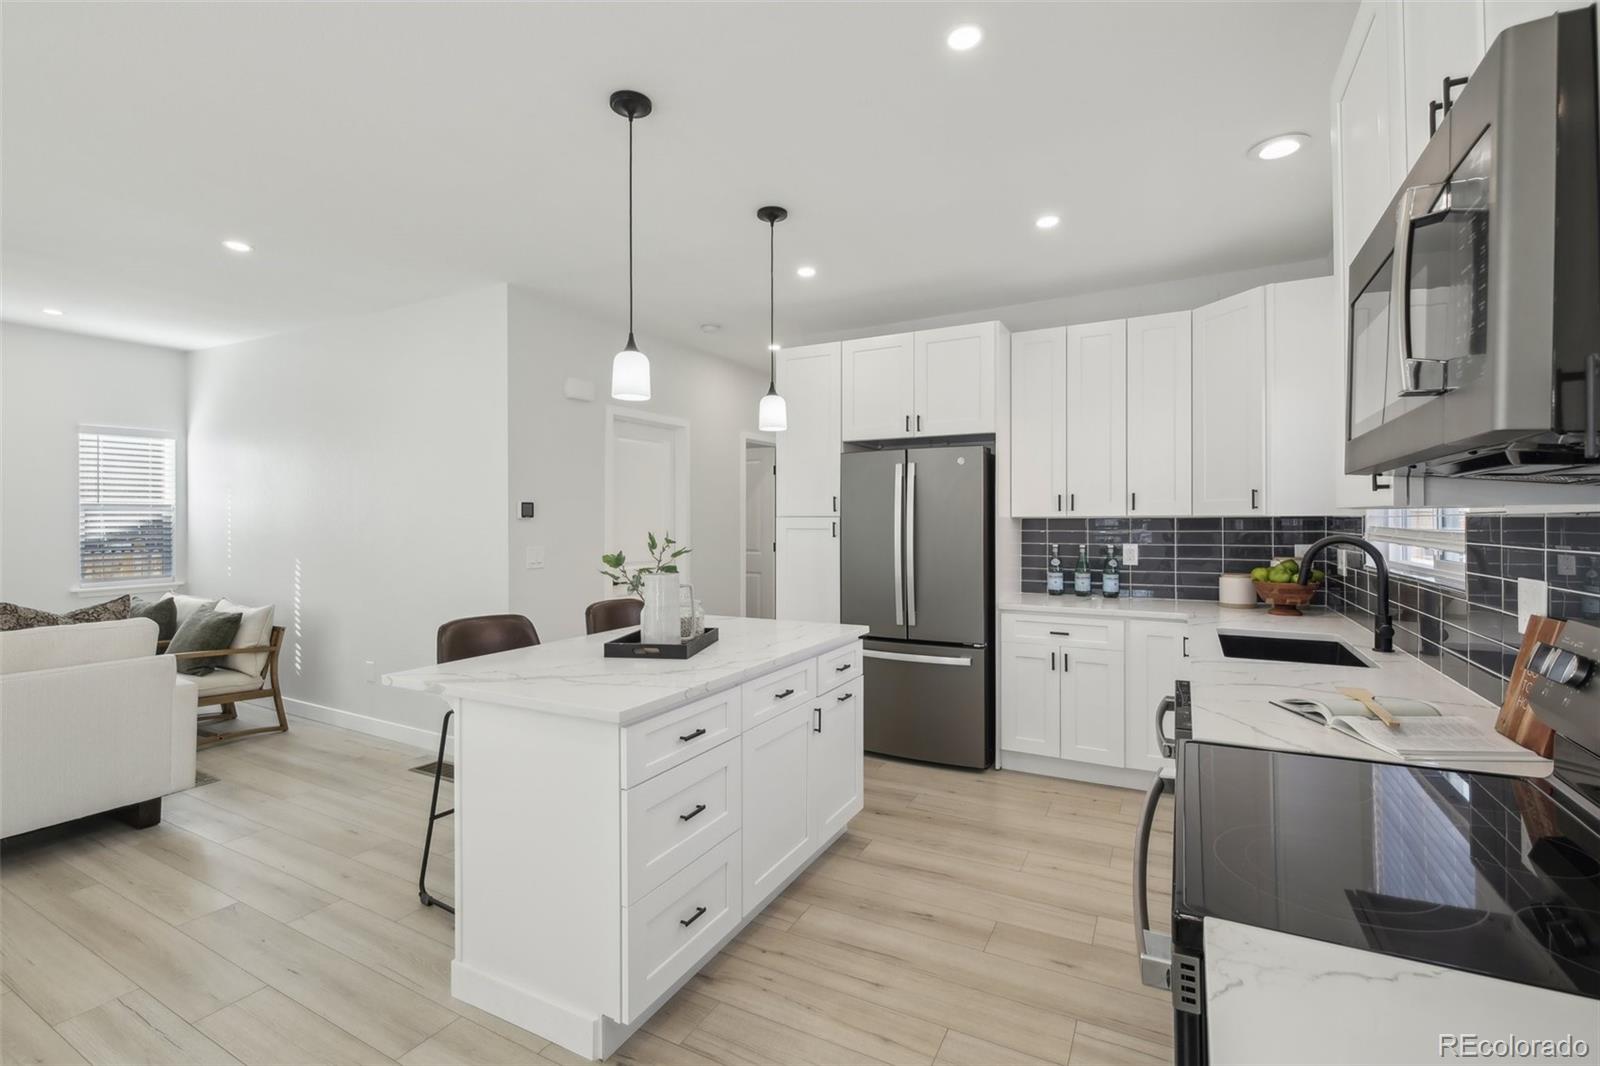
Active
$399,000
3
bds
|
3
ba
|
1,538
sqft
|
built
2019
4755 Memphis St, Denver, CO 80239
$-554
Cash flow
-7.2%
Cash-on-Cash Return
4.0%
Cap rate
0.7%
Rent to Value Ratio
Active
$490,000
3
bds
|
1
ba
|
1,042
sqft
|
built
1954
1632 Ulster St, Denver, CO 80220
$-732
Cash flow
-7.8%
Cash-on-Cash Return
3.9%
Cap rate
0.5%
Rent to Value Ratio
Active
$340,000
2
bds
|
2
ba
|
1,036
sqft
|
built
2001
4385 S Balsam St, Denver, CO 80123
$-660
Cash flow
-10.1%
Cash-on-Cash Return
3.3%
Cap rate
0.6%
Rent to Value Ratio
Active under contract
$420,000
2
bds
|
1
ba
|
848
sqft
|
built
1945
1235 Leyden St, Denver, CO 80220
$-811
Cash flow
-10.1%
Cash-on-Cash Return
3.4%
Cap rate
0.6%
Rent to Value Ratio
Active
$1,099,000
4
bds
|
4
ba
|
3,021
sqft
|
built
2016
4535 W 50th Ave, Denver, CO 80212
$-2,575
Cash flow
-12.2%
Cash-on-Cash Return
2.9%
Cap rate
0.4%
Rent to Value Ratio
Active
$4,400,000
5
bds
|
6
ba
|
6,783
sqft
|
built
2001
19 S Eudora St, Denver, CO 80246
$-16,533
Cash flow
-19.6%
Cash-on-Cash Return
1.2%
Cap rate
0.2%
Rent to Value Ratio
Active
$618,000
4
bds
|
3
ba
|
2,352
sqft
|
built
1958
1646 S Stuart St, Denver, CO 80219
$-1,028
Cash flow
-8.7%
Cash-on-Cash Return
3.7%
Cap rate
0.5%
Rent to Value Ratio
Active
$475,000
3
bds
|
3
ba
|
1,858
sqft
|
built
2002
20000 Mitchell Pl, Denver, CO 80249
$-721
Cash flow
-7.9%
Cash-on-Cash Return
3.9%
Cap rate
0.6%
Rent to Value Ratio
Active
$1,149,000
4
bds
|
4
ba
|
2,574
sqft
|
built
1905
1557 Fillmore St, Denver, CO 80206
$-2,812
Cash flow
-12.8%
Cash-on-Cash Return
2.7%
Cap rate
0.4%
Rent to Value Ratio