Denver County Investment Properties for Sale
Browse homes for sale and investment properties in Denver County. Refine your search by price, property type, or more.
Best cash flowing properties in Denver County
Active
$175,000
1
bds
|
1
ba
|
621
sqft
|
built
1970
3047 W 47th Ave, Denver, CO 80211
$97
Cash flow
2.9%
Cash-on-Cash Return
6.3%
Cap rate
1.0%
Rent to Value Ratio

Active
$199,000
1
bds
|
1
ba
|
442
sqft
|
built
1968
155 S Pennsylvania St, Denver, CO 80209
$-190
Cash flow
-5.0%
Cash-on-Cash Return
4.5%
Cap rate
0.8%
Rent to Value Ratio
1,704 out of 1,797 properties for sale in Denver County
Limited Results Shown
Create a free account, or log in to reveal all property listings and enjoy the complete experience.
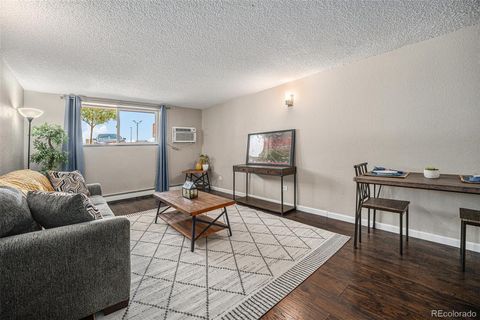
Active
$159,950
1
bds
|
1
ba
|
808
sqft
|
built
1974
8060 E Girard Ave, Denver, CO 80231
$-284
Cash flow
-9.3%
Cash-on-Cash Return
3.5%
Cap rate
1.1%
Rent to Value Ratio
Active
$450,000
1
bds
|
2
ba
|
1,322
sqft
|
built
1997
290 W 12th Ave, Denver, CO 80204
$-1,111
Cash flow
-12.9%
Cash-on-Cash Return
2.7%
Cap rate
0.6%
Rent to Value Ratio
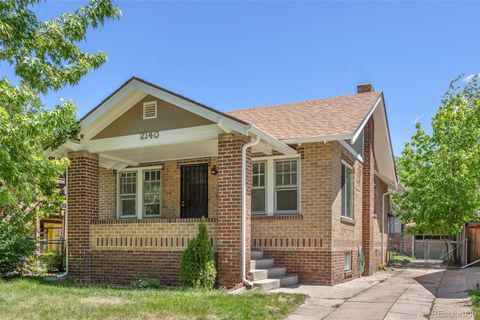
Active
$650,000
3
bds
|
1
ba
|
768
sqft
|
built
1928
2140 S Washington St, Denver, CO 80210
$-1,399
Cash flow
-11.2%
Cash-on-Cash Return
3.1%
Cap rate
0.4%
Rent to Value Ratio
Active
$439,900
4
bds
|
2
ba
|
866
sqft
|
built
1969
5519 Tucson St, Denver, CO 80239
$-324
Cash flow
-3.8%
Cash-on-Cash Return
4.8%
Cap rate
0.6%
Rent to Value Ratio
Active
$875,000
4
bds
|
2
ba
|
1,844
sqft
|
built
1948
1100 S Garfield St, Denver, CO 80210
$-2,019
Cash flow
-12.0%
Cash-on-Cash Return
2.9%
Cap rate
0.4%
Rent to Value Ratio

Active
$169,900
2
bds
|
1
ba
|
852
sqft
|
built
1971
875 S Quebec St, Denver, CO 80247
$-321
Cash flow
-9.9%
Cash-on-Cash Return
3.4%
Cap rate
0.8%
Rent to Value Ratio
Active
$475,000
3
bds
|
3
ba
|
1,866
sqft
|
built
2017
4774 Kittredge St, Denver, CO 80239
$-1,022
Cash flow
-11.2%
Cash-on-Cash Return
3.1%
Cap rate
0.6%
Rent to Value Ratio
Active
$899,900
5
bds
|
2
ba
|
2,896
sqft
|
built
1949
4000 Irving St, Denver, CO 80211
$-2,271
Cash flow
-13.2%
Cash-on-Cash Return
2.7%
Cap rate
0.4%
Rent to Value Ratio
Active
$474,500
1
bds
|
2
ba
|
1,080
sqft
|
built
1983
2020 Arapahoe St, Denver, CO 80205
$-1,173
Cash flow
-12.9%
Cash-on-Cash Return
2.7%
Cap rate
0.5%
Rent to Value Ratio
Active
$245,000
1
bds
|
1
ba
|
650
sqft
|
built
1951
2100 N Franklin St, Denver, CO 80205
$-384
Cash flow
-8.2%
Cash-on-Cash Return
3.8%
Cap rate
0.7%
Rent to Value Ratio
Active
$383,000
3
bds
|
3
ba
|
1,352
sqft
|
built
1969
6340 E Mississippi Ave, Denver, CO 80224
$-711
Cash flow
-9.7%
Cash-on-Cash Return
3.4%
Cap rate
0.7%
Rent to Value Ratio
Active
$4,200,000
4
bds
|
4
ba
|
4,359
sqft
|
built
1926
140 Race St, Denver, CO 80206
$-15,914
Cash flow
-19.8%
Cash-on-Cash Return
1.1%
Cap rate
0.2%
Rent to Value Ratio
Active
$225,000
1
bds
|
1
ba
|
618
sqft
|
built
1983
4899 S Dudley St, Littleton, CO 80123
$-313
Cash flow
-7.3%
Cash-on-Cash Return
4.0%
Cap rate
0.7%
Rent to Value Ratio
Active
$1,099,000
4
bds
|
3
ba
|
1,986
sqft
|
built
1913
458 S Downing St, Denver, CO 80209
$-2,191
Cash flow
-10.4%
Cash-on-Cash Return
3.3%
Cap rate
0.5%
Rent to Value Ratio
Active
$1,995,000
5
bds
|
6
ba
|
5,436
sqft
|
built
2014
3255 S Birch St, Denver, CO 80222
$-7,746
Cash flow
-20.3%
Cash-on-Cash Return
1.0%
Cap rate
0.2%
Rent to Value Ratio
Active
$427,000
1
bds
|
1
ba
|
832
sqft
|
built
1996
1521 Central St, Denver, CO 80211
$-1,008
Cash flow
-12.3%
Cash-on-Cash Return
2.8%
Cap rate
0.5%
Rent to Value Ratio
Active
$699,000
3
bds
|
1
ba
|
1,158
sqft
|
built
1951
1030 Krameria St, Denver, CO 80220
$-1,334
Cash flow
-10.0%
Cash-on-Cash Return
3.4%
Cap rate
0.5%
Rent to Value Ratio
Active
$599,000
4
bds
|
2
ba
|
1,972
sqft
|
built
1951
3080 N Cook St, Denver, CO 80205
$-1,150
Cash flow
-10.0%
Cash-on-Cash Return
3.4%
Cap rate
0.5%
Rent to Value Ratio
Active
$3,950,000
4
bds
|
7
ba
|
6,109
sqft
|
built
2005
445 Madison St, Denver, CO 80206
$-16,306
Cash flow
-21.5%
Cash-on-Cash Return
0.7%
Cap rate
0.2%
Rent to Value Ratio

Active
$845,000
3
bds
|
3
ba
|
2,289
sqft
|
built
1930
4625 W 50th Ave, Denver, CO 80212
$-2,060
Cash flow
-12.7%
Cash-on-Cash Return
2.8%
Cap rate
0.6%
Rent to Value Ratio
Active
$899,000
3
bds
|
2
ba
|
1,855
sqft
|
built
1925
2232 S Ogden St, Denver, CO 80210
$-2,110
Cash flow
-12.2%
Cash-on-Cash Return
2.9%
Cap rate
0.4%
Rent to Value Ratio
Active
$1,210,000
5
bds
|
5
ba
|
3,500
sqft
|
built
2016
2420 S Gilpin St, Denver, CO 80210
$-3,100
Cash flow
-13.4%
Cash-on-Cash Return
2.6%
Cap rate
0.4%
Rent to Value Ratio
Active
$330,000
2
bds
|
2
ba
|
1,100
sqft
|
built
1978
3470 S Poplar St, Denver, CO 80224
$-773
Cash flow
-12.2%
Cash-on-Cash Return
2.9%
Cap rate
0.6%
Rent to Value Ratio
Active
$1,595,000
4
bds
|
4
ba
|
3,680
sqft
|
built
2005
350 Holly St, Denver, CO 80220
$-3,715
Cash flow
-12.2%
Cash-on-Cash Return
2.9%
Cap rate
0.4%
Rent to Value Ratio
Active
$417,000
2
bds
|
1
ba
|
868
sqft
|
built
1931
765 S Krameria St, Denver, CO 80224
$-617
Cash flow
-7.7%
Cash-on-Cash Return
3.9%
Cap rate
0.5%
Rent to Value Ratio
Active
$889,000
4
bds
|
4
ba
|
3,272
sqft
|
built
2014
5511 Wabash St, Denver, CO 80238
$-2,207
Cash flow
-13.0%
Cash-on-Cash Return
2.7%
Cap rate
0.5%
Rent to Value Ratio
Active
$650,000
2
bds
|
2
ba
|
1,218
sqft
|
built
1891
3547 Osage St, Denver, CO 80211
$-716
Cash flow
-5.7%
Cash-on-Cash Return
4.4%
Cap rate
0.6%
Rent to Value Ratio

Active
$1,149,000
4
bds
|
4
ba
|
2,574
sqft
|
built
1905
1557 Fillmore St, Denver, CO 80206
$-2,812
Cash flow
-12.8%
Cash-on-Cash Return
2.7%
Cap rate
0.4%
Rent to Value Ratio
Active
$1,600,000
2
bds
|
2
ba
|
2,129
sqft
|
built
1905
1792 Wynkoop St, Denver, CO 80202
$-5,716
Cash flow
-18.6%
Cash-on-Cash Return
1.4%
Cap rate
0.3%
Rent to Value Ratio

Active
$799,900
4
bds
|
3
ba
|
2,400
sqft
|
built
1954
4891 Depew St, Denver, CO 80212
$-1,859
Cash flow
-12.1%
Cash-on-Cash Return
2.9%
Cap rate
0.4%
Rent to Value Ratio

Active
$300,000
1
bds
|
1
ba
|
702
sqft
|
built
1968
1365 Columbine St, Denver, CO 80206
$-931
Cash flow
-16.2%
Cash-on-Cash Return
2.0%
Cap rate
0.5%
Rent to Value Ratio
Active
$390,000
3
bds
|
2
ba
|
1,722
sqft
|
built
1995
1885 S Quebec Way, Denver, CO 80231
$-850
Cash flow
-11.4%
Cash-on-Cash Return
3.1%
Cap rate
0.6%
Rent to Value Ratio

Active
$575,000
3
bds
|
3
ba
|
1,734
sqft
|
built
1966
2900 S Golden Way, Denver, CO 80227
$-913
Cash flow
-8.3%
Cash-on-Cash Return
3.8%
Cap rate
0.5%
Rent to Value Ratio
Active
$700,000
2
bds
|
2
ba
|
1,440
sqft
|
built
1905
3445 N Clay St, Denver, CO 80211
$-1,241
Cash flow
-9.2%
Cash-on-Cash Return
3.6%
Cap rate
0.5%
Rent to Value Ratio
Active
$279,622
1
bds
|
1
ba
|
788
sqft
|
built
1953
910 Santa Fe Dr, Denver, CO 80204
$-531
Cash flow
-9.9%
Cash-on-Cash Return
3.4%
Cap rate
0.7%
Rent to Value Ratio
Active
$2,499,900
6
bds
|
7
ba
|
4,617
sqft
|
built
2017
1845 W 33rd Ave, Denver, CO 80211
$-6,695
Cash flow
-14.0%
Cash-on-Cash Return
2.5%
Cap rate
0.4%
Rent to Value Ratio
Active
$475,000
3
bds
|
2
ba
|
1,216
sqft
|
built
1927
1264 Uinta St, Denver, CO 80220
$-521
Cash flow
-5.7%
Cash-on-Cash Return
4.4%
Cap rate
0.6%
Rent to Value Ratio
Active
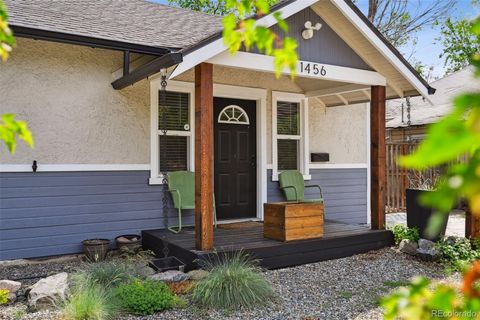
$395,000
2
bds
|
1
ba
|
704
sqft
|
built
1921
1456 Syracuse St, Denver, CO 80220
$-442
Cash flow
-5.8%
Cash-on-Cash Return
4.3%
Cap rate
0.6%
Rent to Value Ratio