Teller County Investment Properties for Sale
Browse homes for sale and investment properties in Teller County. Refine your search by price, property type, or more.
Best cash flowing properties in Teller County
Active
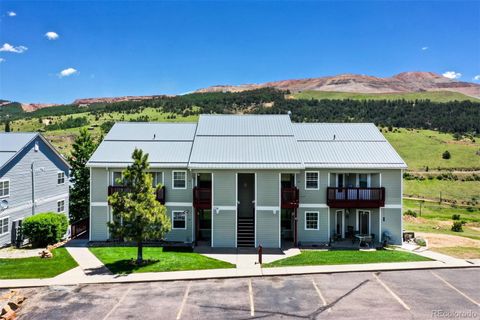
$195,000
2
bds
|
2
ba
|
799
sqft
|
built
1996
124 Whalen Ave, Cripple Creek, CO 80813
$183
Cash flow
4.9%
Cash-on-Cash Return
6.8%
Cap rate
1.0%
Rent to Value Ratio
Active
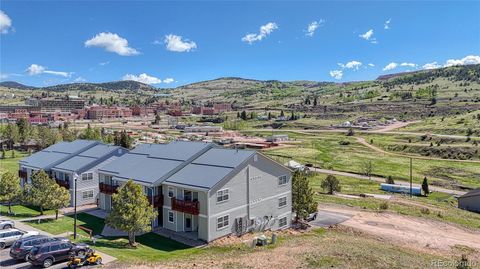
$183,000
2
bds
|
2
ba
|
799
sqft
|
built
1996
443 S 1st St, Cripple Creek, CO 80813
$-38
Cash flow
-1.1%
Cash-on-Cash Return
5.4%
Cap rate
0.9%
Rent to Value Ratio
170 out of 195 properties for sale in Teller County
Limited Results Shown
Create a free account, or log in to reveal all property listings and enjoy the complete experience.
Active
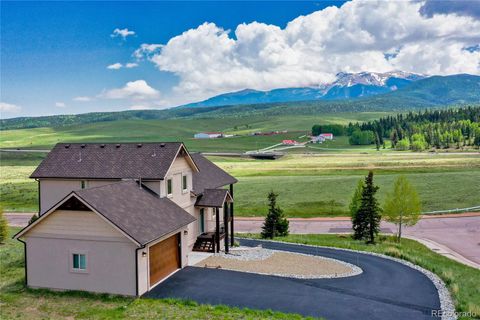
$830,000
5
bds
|
4
ba
|
3,028
sqft
|
built
2020
407 Meadow Park Dr, Divide, CO 80814
$-1,559
Cash flow
-9.8%
Cash-on-Cash Return
3.4%
Cap rate
0.5%
Rent to Value Ratio
Active
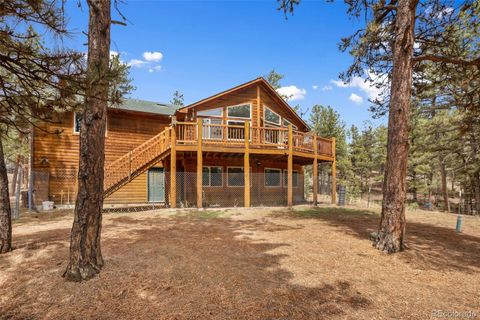
$549,900
3
bds
|
3
ba
|
2,569
sqft
|
built
2001
82 Bradshaw Rd, Florissant, CO 80816
$-829
Cash flow
-7.9%
Cash-on-Cash Return
3.9%
Cap rate
0.5%
Rent to Value Ratio
Active
$195,000
2
bds
|
2
ba
|
799
sqft
|
built
1996
441 S 1st St, Cripple Creek, CO 80813
$-70
Cash flow
-1.9%
Cash-on-Cash Return
5.2%
Cap rate
0.8%
Rent to Value Ratio
Active
$2,199,999
4
bds
|
2
ba
|
4,852
sqft
|
built
1980
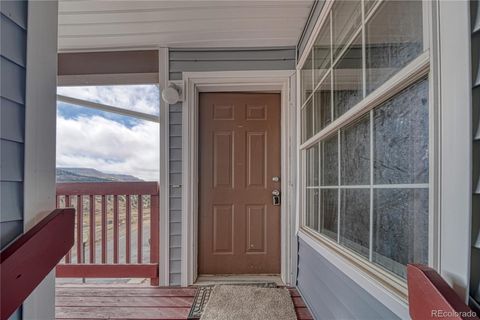
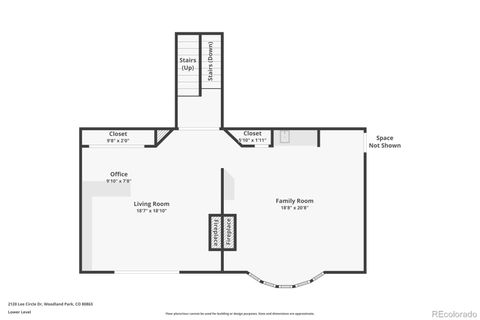
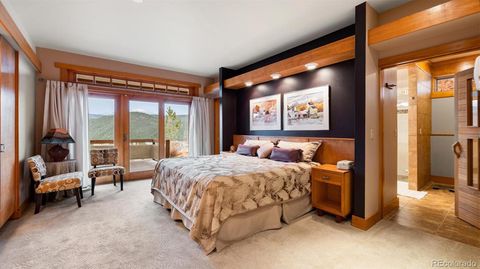
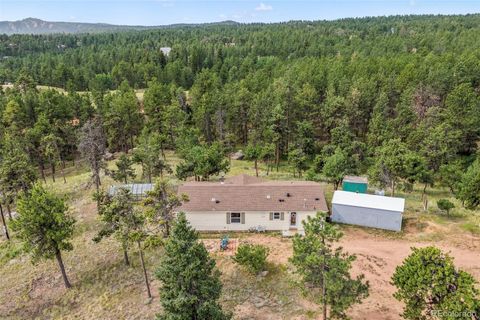
2120 Lee Circle Dr, Woodland Park, CO 80863
$-7,897
Cash flow
-18.7%
Cash-on-Cash Return
1.4%
Cap rate
0.2%
Rent to Value Ratio
Active
$1,225,000
4
bds
|
4
ba
|
3,960
sqft
|
built
2007
700 Sunrise Cir, Woodland Park, CO 80863
$-3,828
Cash flow
-16.3%
Cash-on-Cash Return
1.9%
Cap rate
0.3%
Rent to Value Ratio
Active
$434,900
3
bds
|
2
ba
|
1,384
sqft
|
built
1998
696 Calle De La Nieva, Florissant, CO 80816
$-398
Cash flow
-4.8%
Cash-on-Cash Return
4.6%
Cap rate
0.6%
Rent to Value Ratio
Active
$399,000
4
bds
|
1
ba
|
816
sqft
|
built
2002
429 Gentian Rd, Woodland Park, CO 80863
$-464
Cash flow
-6.1%
Cash-on-Cash Return
4.3%
Cap rate
0.6%
Rent to Value Ratio
Active
$1,900,000
4
bds
|
4
ba
|
2,972
sqft
|
built
2008
2 Golden Eagle Hts, Florissant, CO 80816
$-5,817
Cash flow
-16.0%
Cash-on-Cash Return
2.0%
Cap rate
0.3%
Rent to Value Ratio
Active
$495,000
3
bds
|
2
ba
|
1,460
sqft
|
built
1988
204 Kutsu Ridge Rd, Florissant, CO 80816
$-812
Cash flow
-8.6%
Cash-on-Cash Return
3.7%
Cap rate
0.5%
Rent to Value Ratio
Active
$550,000
5
bds
|
3
ba
|
3,120
sqft
|
built
1999
958 Cottonwood Lake Dr, Divide, CO 80814
$-637
Cash flow
-6.0%
Cash-on-Cash Return
4.3%
Cap rate
0.6%
Rent to Value Ratio
Active
$550,000
3
bds
|
3
ba
|
2,435
sqft
|
built
2018
277 Aspen Cir, Divide, CO 80814
$-595
Cash flow
-5.6%
Cash-on-Cash Return
4.4%
Cap rate
0.6%
Rent to Value Ratio
Active
$586,000
3
bds
|
3
ba
|
2,052
sqft
|
built
2003
130 Paint Pony Ln, Florissant, CO 80816
$-952
Cash flow
-8.5%
Cash-on-Cash Return
3.7%
Cap rate
0.5%
Rent to Value Ratio

Active
$629,500
4
bds
|
4
ba
|
2,708
sqft
|
built
1997
441 Black Bear Trl, Woodland Park, CO 80863
$-1,307
Cash flow
-10.8%
Cash-on-Cash Return
3.2%
Cap rate
0.4%
Rent to Value Ratio
Active
$425,000
5
bds
|
2
ba
|
1,472
sqft
|
built
1979
1260 Sundance St, Woodland Park, CO 80863
$-678
Cash flow
-8.3%
Cash-on-Cash Return
3.8%
Cap rate
0.5%
Rent to Value Ratio
Active
$675,000
3
bds
|
2
ba
|
1,805
sqft
|
built
2021
510 Crestview Ln, Woodland Park, CO 80863
$-1,421
Cash flow
-11.0%
Cash-on-Cash Return
3.2%
Cap rate
0.5%
Rent to Value Ratio
Active
$485,000
4
bds
|
2
ba
|
2,016
sqft
|
built
1979
50 Holiday Dr, Woodland Park, CO 80863
$-733
Cash flow
-7.9%
Cash-on-Cash Return
3.9%
Cap rate
0.5%
Rent to Value Ratio
Active
$550,000
1
bds
|
3
ba
|
1,806
sqft
|
built
1987
131 Kestrel Ct, Divide, CO 80814
$-1,212
Cash flow
-11.5%
Cash-on-Cash Return
3.0%
Cap rate
0.4%
Rent to Value Ratio
Active
$585,000
2
bds
|
2
ba
|
2,652
sqft
|
built
1932
224 W Warren Ave, Cripple Creek, CO 80813
$-1,258
Cash flow
-11.2%
Cash-on-Cash Return
3.1%
Cap rate
0.4%
Rent to Value Ratio
Active
$485,000
4
bds
|
2
ba
|
1,868
sqft
|
built
1974
418 N Baldwin St, Woodland Park, CO 80863
$-1,293
Cash flow
-13.9%
Cash-on-Cash Return
2.5%
Cap rate
0.4%
Rent to Value Ratio
Active
$505,000
2
bds
|
1
ba
|
832
sqft
|
built
1973
201 Lake Dr, Florissant, CO 80816
$-953
Cash flow
-9.8%
Cash-on-Cash Return
3.4%
Cap rate
0.4%
Rent to Value Ratio
Active
$420,000
1
bds
|
1
ba
|
1,020
sqft
|
built
1981
44 El Paso Ct, Cripple Creek, CO 80813
$-825
Cash flow
-10.2%
Cash-on-Cash Return
3.3%
Cap rate
0.4%
Rent to Value Ratio
Active
$599,900
3
bds
|
2
ba
|
1,092
sqft
|
built
1971
500 W Kelly Rd, Woodland Park, CO 80863
$-1,229
Cash flow
-10.7%
Cash-on-Cash Return
3.2%
Cap rate
0.4%
Rent to Value Ratio
Active
$989,900
5
bds
|
4
ba
|
3,524
sqft
|
built
2000
556 Crystola Ct, Woodland Park, CO 80863
$-1,987
Cash flow
-10.5%
Cash-on-Cash Return
3.3%
Cap rate
0.4%
Rent to Value Ratio
Active
$1,199,000
3
bds
|
3
ba
|
3,282
sqft
|
built
1997
361 Crystal Peak Rd, Florissant, CO 80816
$-3,064
Cash flow
-13.3%
Cash-on-Cash Return
2.6%
Cap rate
0.3%
Rent to Value Ratio
Active
$825,000
3
bds
|
4
ba
|
3,784
sqft
|
built
2003
931 Heather Ct, Woodland Park, CO 80863
$-1,073
Cash flow
-6.8%
Cash-on-Cash Return
4.1%
Cap rate
0.5%
Rent to Value Ratio
Active
$725,000
3
bds
|
2
ba
|
1,722
sqft
|
built
1977
3674 Trail Creek Rd, Florissant, CO 80816
$-1,976
Cash flow
-14.2%
Cash-on-Cash Return
2.4%
Cap rate
0.3%
Rent to Value Ratio
Active
$299,999
2
bds
|
2
ba
|
960
sqft
|
built
2015
716 Badger Trl, Florissant, CO 80816
$-114
Cash flow
-2.0%
Cash-on-Cash Return
5.2%
Cap rate
0.7%
Rent to Value Ratio
Active
$625,000
3
bds
|
3
ba
|
2,156
sqft
|
built
1910
135 Daniwood Grv, Florissant, CO 80816
$-1,422
Cash flow
-11.9%
Cash-on-Cash Return
2.9%
Cap rate
0.4%
Rent to Value Ratio
Active
$2,395,000
6
bds
|
5
ba
|
6,615
sqft
|
built
1990
580 Sunny Glen Ct, Woodland Park, CO 80863
$-8,426
Cash flow
-18.4%
Cash-on-Cash Return
1.5%
Cap rate
0.2%
Rent to Value Ratio
Active
$799,000
4
bds
|
2
ba
|
2,688
sqft
|
built
1980
56 Blue Jay Ln, Divide, CO 80814
$-2,223
Cash flow
-14.5%
Cash-on-Cash Return
2.3%
Cap rate
0.3%
Rent to Value Ratio
Active
$609,000
1
bds
|
3
ba
|
2,743
sqft
|
built
1982
1251 Woodland Valley Ranch Dr, Woodland Park, CO 80863
$-1,277
Cash flow
-10.9%
Cash-on-Cash Return
3.2%
Cap rate
0.4%
Rent to Value Ratio
Active
$429,900
3
bds
|
2
ba
|
1,232
sqft
|
built
1979
1003 Mountain View Rd, Woodland Park, CO 80863
$-616
Cash flow
-7.5%
Cash-on-Cash Return
4.0%
Cap rate
0.5%
Rent to Value Ratio
Active
$675,000
4
bds
|
4
ba
|
3,312
sqft
|
built
1987
2020 Valley View Dr, Woodland Park, CO 80863
$-1,244
Cash flow
-9.6%
Cash-on-Cash Return
3.5%
Cap rate
0.5%
Rent to Value Ratio
Active
$430,000
3
bds
|
2
ba
|
1,486
sqft
|
built
1994
181 Valley Ln, Woodland Park, CO 80863
$-475
Cash flow
-5.8%
Cash-on-Cash Return
4.4%
Cap rate
0.6%
Rent to Value Ratio
Active
$399,900
3
bds
|
3
ba
|
2,008
sqft
|
built
1962
300 Ute Trl, Woodland Park, CO 80863
$-305
Cash flow
-4.0%
Cash-on-Cash Return
4.8%
Cap rate
0.6%
Rent to Value Ratio
Active
$485,000
5
bds
|
2
ba
|
1,900
sqft
|
built
1979
1005 Mountain View Rd, Woodland Park, CO 80863
$-961
Cash flow
-10.3%
Cash-on-Cash Return
3.3%
Cap rate
0.5%
Rent to Value Ratio
Active
$389,000
2
bds
|
2
ba
|
1,316
sqft
|
built
2018
501 Wakanda Trl, Woodland Park, CO 80863
$-403
Cash flow
-5.4%
Cash-on-Cash Return
4.4%
Cap rate
0.6%
Rent to Value Ratio
Active
$430,000
3
bds
|
2
ba
|
1,232
sqft
|
built
2005
406 High Pasture Rd, Florissant, CO 80816
$-528
Cash flow
-6.4%
Cash-on-Cash Return
4.2%
Cap rate
0.5%
Rent to Value Ratio