Compton, CA Investment Properties for Sale
Browse homes for sale and investment properties in Compton, CA. Refine your search by price, property type, or more.
Best cash flowing properties in Compton, CA
Active
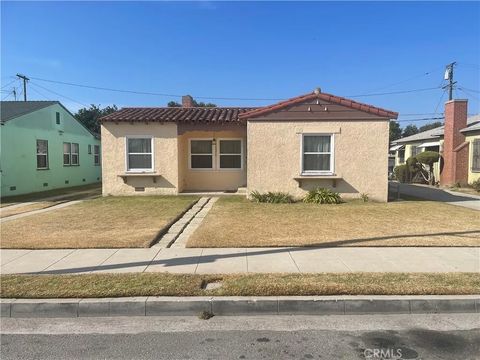
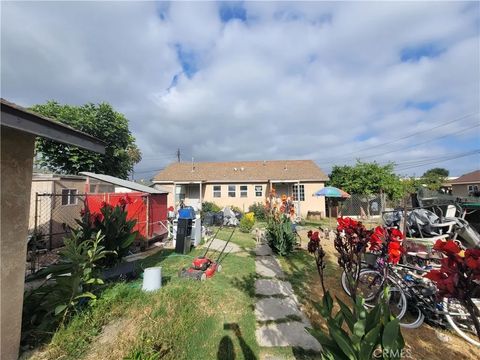
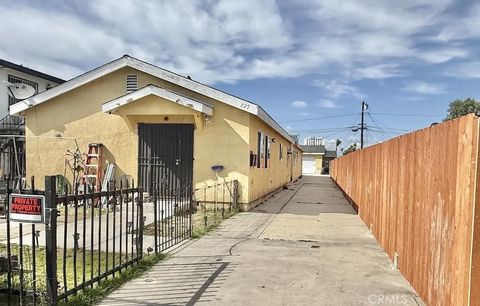
$450,000
2
bds
|
1
ba
|
1,056
sqft
|
built
1936
1215 N Chester Ave, Compton, CA 90221
$-136
Cash flow
-1.6%
Cash-on-Cash Return
5.7%
Cap rate
0.7%
Rent to Value Ratio
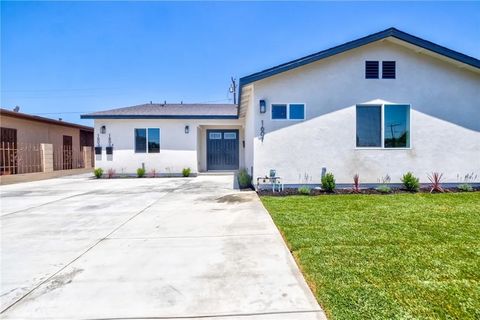
Active
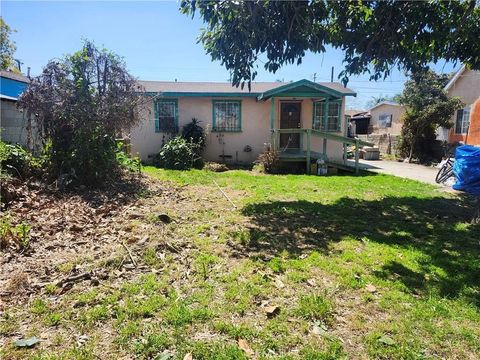
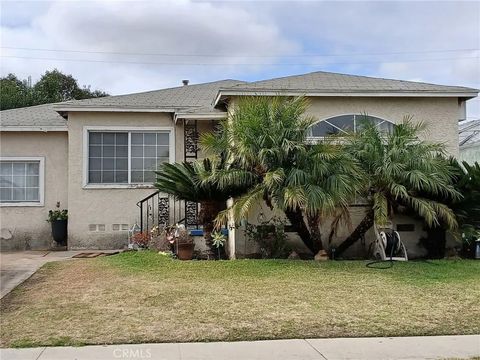
$440,000
2
bds
|
1
ba
|
679
sqft
|
built
1922
2036 E Shauer St, Compton, CA 90222
$-500
Cash flow
-5.9%
Cash-on-Cash Return
4.7%
Cap rate
0.6%
Rent to Value Ratio
15 out of 67 properties for sale in Compton, CA
Limited Results Shown
Create a free account, or log in to reveal all property listings and enjoy the complete experience.
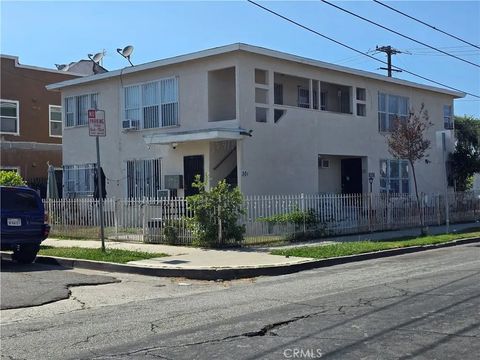
Active
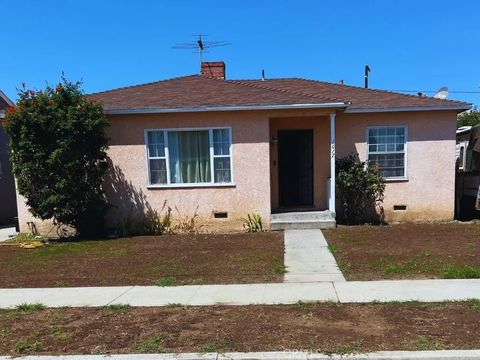
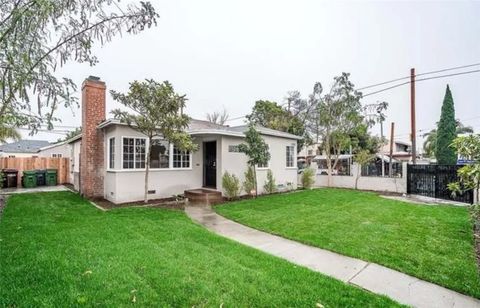
$710,000
2
bds
|
2
ba
|
1,120
sqft
|
built
1947
1017 S Chester Ave, Compton, CA 90221
$-1,175
Cash flow
-8.6%
Cash-on-Cash Return
4.1%
Cap rate
0.5%
Rent to Value Ratio
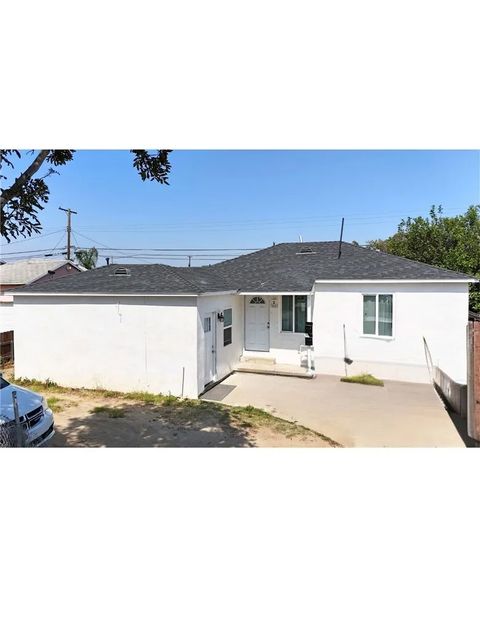
Active
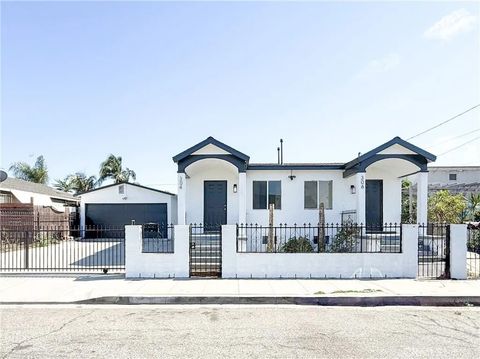
$749,900
5
bds
|
3
ba
|
0
sqft
|
built
1923
304 W Cedar St, Compton, CA 90220
$-2,067
Cash flow
-14.4%
Cash-on-Cash Return
2.8%
Cap rate
0.3%
Rent to Value Ratio
Active
$765,000
2
bds
|
2
ba
|
1,296
sqft
|
built
1948
12907 S Willowbrook Ave, Compton, CA 90222
$-1,936
Cash flow
-13.2%
Cash-on-Cash Return
3.0%
Cap rate
0.4%
Rent to Value Ratio
Active
$1,179,000
7
bds
|
6
ba
|
0
sqft
|
built
1954
1601 W 165th St, Compton, CA 90220
$-4,030
Cash flow
-17.8%
Cash-on-Cash Return
2.0%
Cap rate
0.2%
Rent to Value Ratio
Active
$899,999
6
bds
|
4
ba
|
0
sqft
|
built
1952
301 W Magnolia St, Compton, CA 90220
$-2,412
Cash flow
-14.0%
Cash-on-Cash Return
2.9%
Cap rate
0.3%
Rent to Value Ratio
Active
$1,100,000
bds
|
0
ba
|
0
sqft
|
built
1950
316 N Maie Ave, Compton, CA 90220
$-2,457
Cash flow
-11.7%
Cash-on-Cash Return
3.4%
Cap rate
0.4%
Rent to Value Ratio
Active
$585,000
2
bds
|
1
ba
|
749
sqft
|
built
1940
14403 S White Ave, Compton, CA 90221
$-1,026
Cash flow
-9.2%
Cash-on-Cash Return
4.0%
Cap rate
0.5%
Rent to Value Ratio
Active
$749,000
4
bds
|
2
ba
|
1,632
sqft
|
built
1964
348 W Peach St, Compton, CA 90222
$-1,924
Cash flow
-13.4%
Cash-on-Cash Return
3.0%
Cap rate
0.4%
Rent to Value Ratio
Active
$1,150,000
3
bds
|
2
ba
|
0
sqft
|
built
1954
124 W Rosecrans Ave, Compton, CA 90222
$-3,676
Cash flow
-16.7%
Cash-on-Cash Return
2.2%
Cap rate
0.3%
Rent to Value Ratio
Active
$660,000
3
bds
|
2
ba
|
1,462
sqft
|
built
1954
1601 W 163rd St, Compton, CA 90220
$-922
Cash flow
-7.3%
Cash-on-Cash Return
4.4%
Cap rate
0.5%
Rent to Value Ratio
Active
$812,000
6
bds
|
2
ba
|
0
sqft
|
built
2007
125 W Tichenor St, Compton, CA 90220
$-1,967
Cash flow
-12.6%
Cash-on-Cash Return
3.2%
Cap rate
0.4%
Rent to Value Ratio
Active
$650,000
3
bds
|
3
ba
|
1,722
sqft
|
built
1947
2207 N Anzac Ave, Compton, CA 90222
$-872
Cash flow
-7.0%
Cash-on-Cash Return
4.5%
Cap rate
0.5%
Rent to Value Ratio
Active
$730,000
4
bds
|
3
ba
|
0
sqft
|
built
1940
15922 S Bullis Rd, Compton, CA 90221
$-1,759
Cash flow
-12.6%
Cash-on-Cash Return
3.2%
Cap rate
0.4%
Rent to Value Ratio