Coral Springs, FL Investment Properties for Sale
Browse homes for sale and investment properties in Coral Springs, FL. Refine your search by price, property type, or more.
Best cash flowing properties in Coral Springs, FL
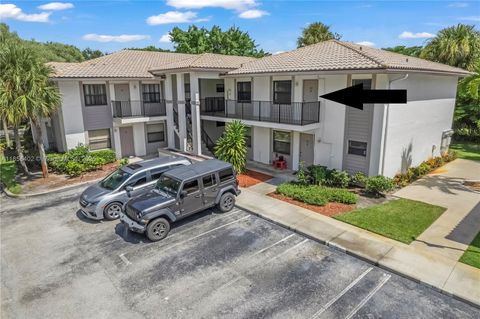
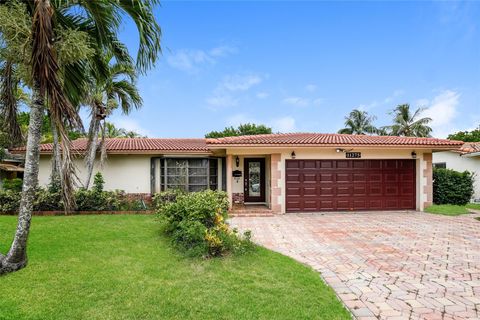
Active
$165,000
2
bds
|
2
ba
|
1,085
sqft
|
built
1975
4133 NW 88th Ave, Coral Springs, FL 33065
$-95
Cash flow
-3.0%
Cash-on-Cash Return
5.5%
Cap rate
1.2%
Rent to Value Ratio
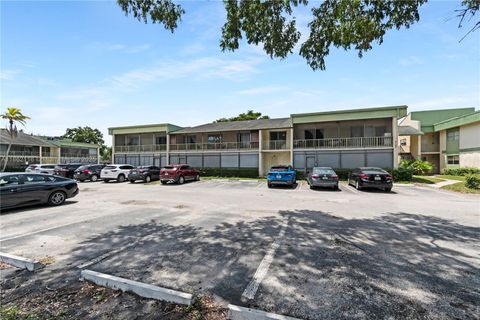
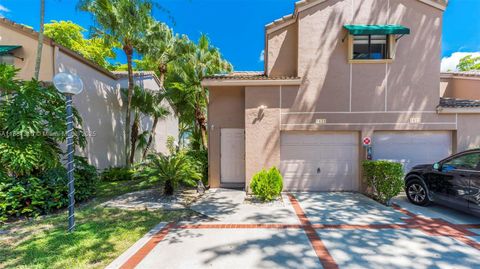
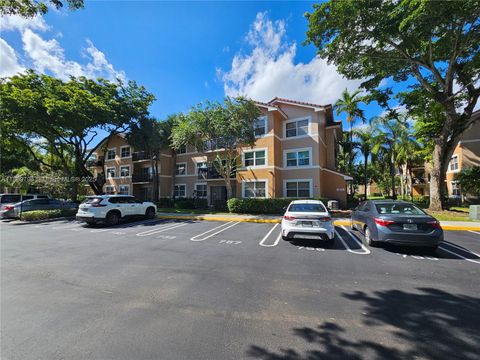
Active
$199,999
1
bds
|
1
ba
|
816
sqft
|
built
1998
913 Coral Club Dr, Coral Springs, FL 33071
$-406
Cash flow
-10.6%
Cash-on-Cash Return
3.7%
Cap rate
0.8%
Rent to Value Ratio
502 out of 601 properties for sale in Coral Springs, FL
Limited Results Shown
Create a free account, or log in to reveal all property listings and enjoy the complete experience.
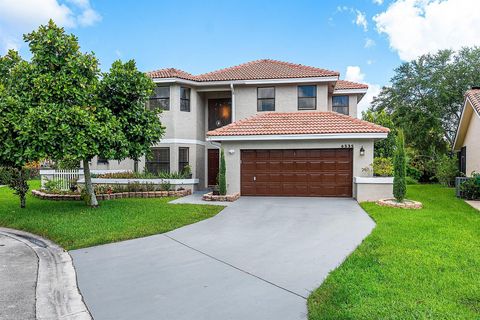
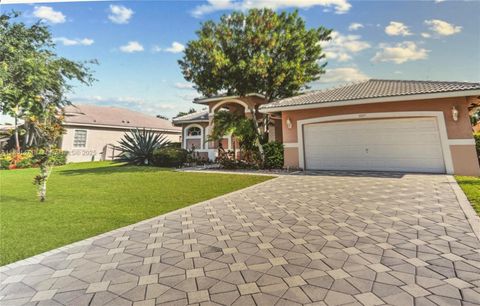
Active
$799,000
4
bds
|
4
ba
|
2,762
sqft
|
built
1988
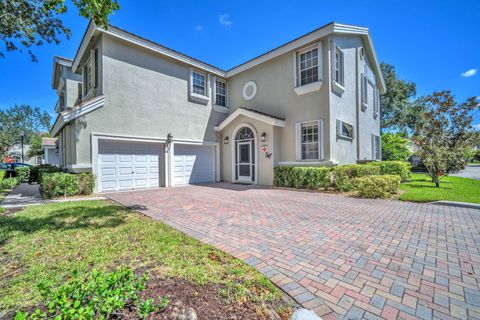
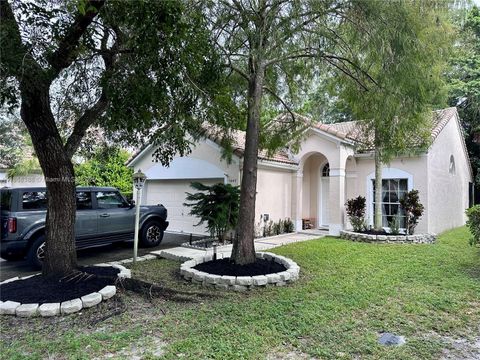
5449 NW 86th Ter, Coral Springs, FL 33067
$-921
Cash flow
-6.0%
Cash-on-Cash Return
4.8%
Cap rate
0.7%
Rent to Value Ratio
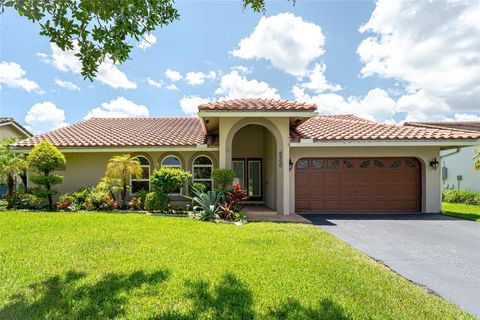
Active
$345,000
3
bds
|
3
ba
|
1,720
sqft
|
built
1982
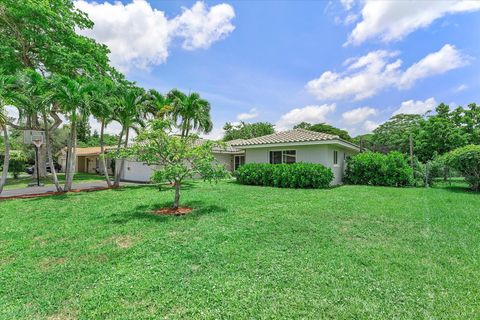
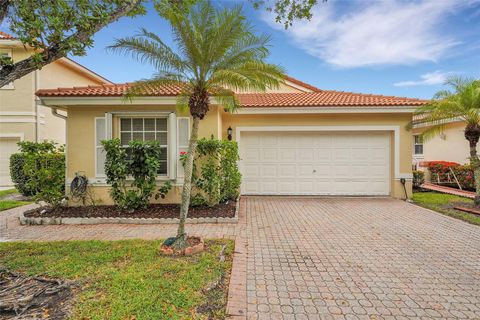
4299 Coral Springs Dr, Coral Springs, FL 33065
$-661
Cash flow
-10.0%
Cash-on-Cash Return
3.8%
Cap rate
0.8%
Rent to Value Ratio
Active
$849,900
4
bds
|
3
ba
|
2,687
sqft
|
built
1988
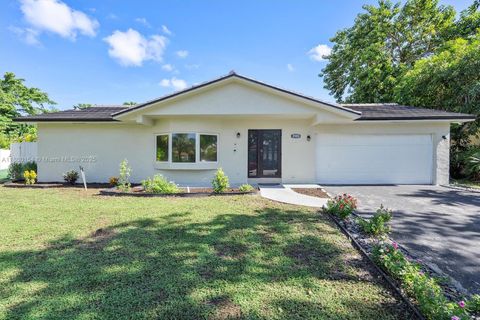
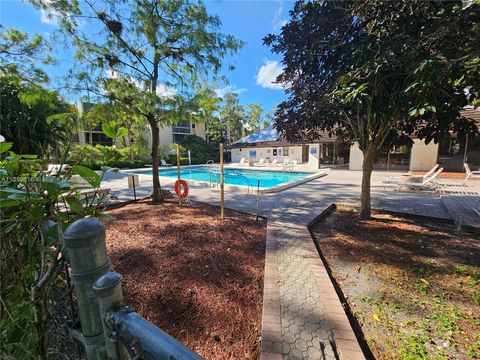
6335 NW 52nd St, Coral Springs, FL 33067
$-1,596
Cash flow
-9.8%
Cash-on-Cash Return
3.9%
Cap rate
0.6%
Rent to Value Ratio
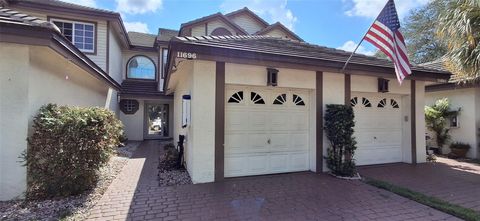
Active
$409,990
3
bds
|
3
ba
|
1,610
sqft
|
built
1991
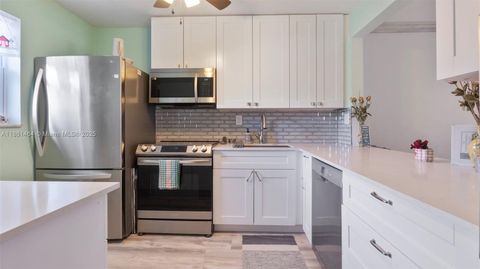
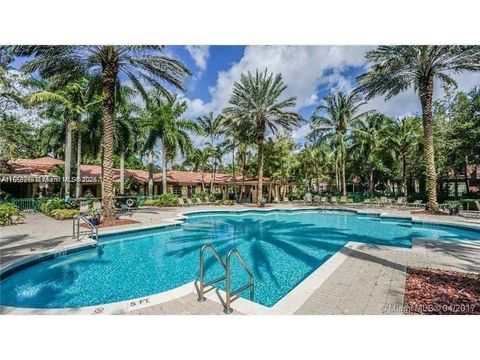
11696 NW 19th Dr, Coral Springs, FL 33071
$-1,050
Cash flow
-13.4%
Cash-on-Cash Return
3.1%
Cap rate
0.7%
Rent to Value Ratio
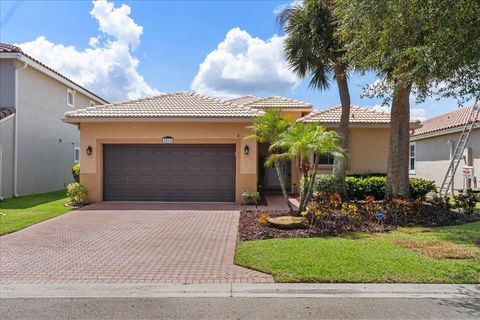
Active
$600,000
3
bds
|
2
ba
|
1,495
sqft
|
built
1998
5065 NW 121st Dr, Coral Springs, FL 33076
$-1,285
Cash flow
-11.2%
Cash-on-Cash Return
3.6%
Cap rate
0.6%
Rent to Value Ratio
Active
$295,000
2
bds
|
2
ba
|
984
sqft
|
built
1992
8721 Wiles Rd, Coral Springs, FL 33067
$-1,253
Cash flow
-22.2%
Cash-on-Cash Return
1.0%
Cap rate
0.6%
Rent to Value Ratio
Active
$749,000
4
bds
|
2
ba
|
2,201
sqft
|
built
1986
8626 NW 50th Dr, Coral Springs, FL 33067
$-1,623
Cash flow
-11.3%
Cash-on-Cash Return
3.5%
Cap rate
0.6%
Rent to Value Ratio
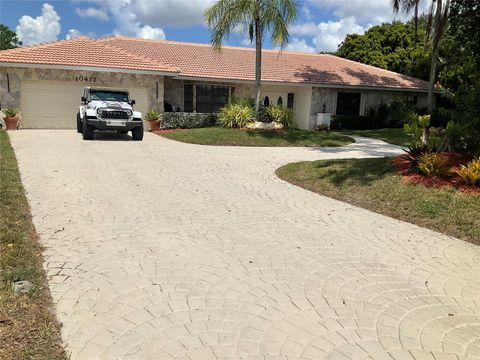
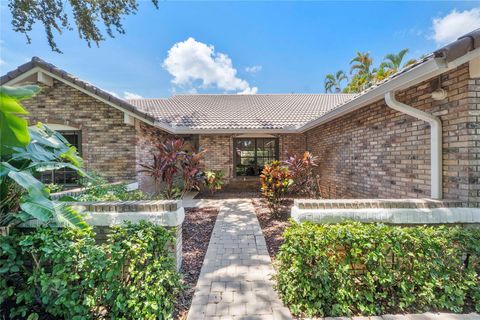
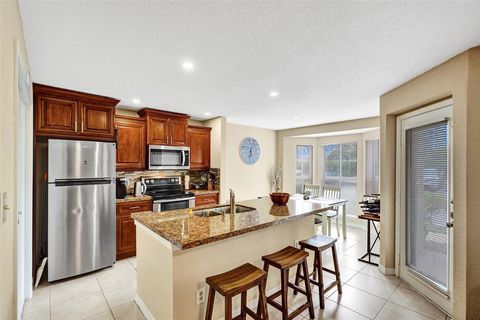
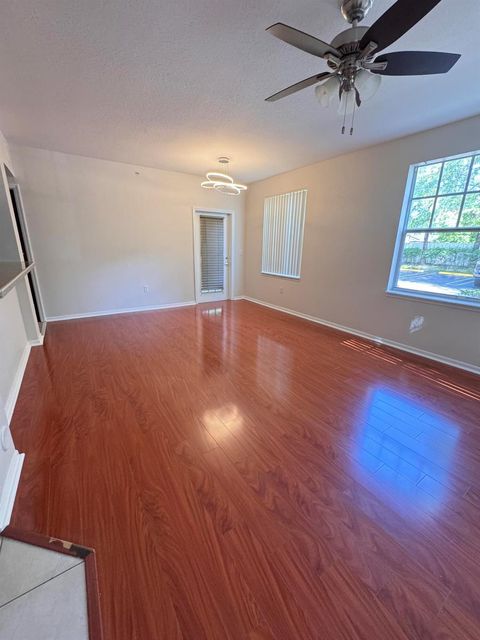
Active
$1,079,000
4
bds
|
4
ba
|
3,852
sqft
|
built
1980
10477 NW 4th St, Coral Springs, FL 33071
$-2,453
Cash flow
-11.9%
Cash-on-Cash Return
3.4%
Cap rate
0.5%
Rent to Value Ratio
Active
$225,000
1
bds
|
1
ba
|
950
sqft
|
built
1987
777 Riverside Dr, Coral Springs, FL 33071
$-771
Cash flow
-17.9%
Cash-on-Cash Return
2.0%
Cap rate
0.8%
Rent to Value Ratio

Active
$729,900
4
bds
|
2
ba
|
2,164
sqft
|
built
1981
11020 NW 8th Ct, Coral Springs, FL 33071
$-985
Cash flow
-7.0%
Cash-on-Cash Return
4.5%
Cap rate
0.7%
Rent to Value Ratio

Active
$785,000
5
bds
|
3
ba
|
2,822
sqft
|
built
1973
4320 NW 107th Ave, Coral Springs, FL 33065
$-2,705
Cash flow
-18.0%
Cash-on-Cash Return
2.0%
Cap rate
0.4%
Rent to Value Ratio
Active
$260,000
1
bds
|
1
ba
|
716
sqft
|
built
2003
6906 W Sample Rd, Coral Springs, FL 33067
$-767
Cash flow
-15.4%
Cash-on-Cash Return
2.6%
Cap rate
0.7%
Rent to Value Ratio
Active
$349,900
2
bds
|
2
ba
|
1,406
sqft
|
built
1994
12441 NW 10th Ct, Coral Springs, FL 33071
$-1,158
Cash flow
-17.3%
Cash-on-Cash Return
2.2%
Cap rate
0.7%
Rent to Value Ratio
Active
$617,900
3
bds
|
2
ba
|
2,024
sqft
|
built
1972
2757 NW 83rd Ter, Coral Springs, FL 33065
$-1,551
Cash flow
-13.1%
Cash-on-Cash Return
3.1%
Cap rate
0.6%
Rent to Value Ratio
Active
$675,000
3
bds
|
2
ba
|
1,856
sqft
|
built
1973
8555 NW 25th Pl, Coral Springs, FL 33065
$-1,104
Cash flow
-8.5%
Cash-on-Cash Return
4.2%
Cap rate
0.7%
Rent to Value Ratio
Active
$179,000
2
bds
|
2
ba
|
1,000
sqft
|
built
1975
8605 W Sample Rd, Coral Springs, FL 33065
$-575
Cash flow
-16.8%
Cash-on-Cash Return
2.3%
Cap rate
1.1%
Rent to Value Ratio
Active
$379,700
3
bds
|
2
ba
|
1,600
sqft
|
built
1988
1621 Cypress Pointe Dr, Coral Springs, FL 33071
$-1,107
Cash flow
-15.2%
Cash-on-Cash Return
2.6%
Cap rate
0.8%
Rent to Value Ratio
Active
$625,000
3
bds
|
2
ba
|
1,884
sqft
|
built
1994
8950 NW 45th Ct, Coral Springs, FL 33065
$-623
Cash flow
-5.2%
Cash-on-Cash Return
5.0%
Cap rate
0.7%
Rent to Value Ratio
Active
$789,000
4
bds
|
2
ba
|
2,278
sqft
|
built
1998
11257 NW 51st St, Coral Springs, FL 33076
$-1,265
Cash flow
-8.4%
Cash-on-Cash Return
4.2%
Cap rate
0.6%
Rent to Value Ratio
Active
$260,000
3
bds
|
2
ba
|
1,080
sqft
|
built
1988
11160 W Sample Rd, Coral Springs, FL 33065
$-979
Cash flow
-19.6%
Cash-on-Cash Return
1.6%
Cap rate
0.7%
Rent to Value Ratio
Active
$522,500
3
bds
|
2
ba
|
1,318
sqft
|
built
1993
3947 Jasmine Ln, Coral Springs, FL 33065
$-1,157
Cash flow
-11.6%
Cash-on-Cash Return
3.5%
Cap rate
0.6%
Rent to Value Ratio
Active
$525,000
3
bds
|
2
ba
|
1,627
sqft
|
built
1996
11034 NW 46th Dr, Coral Springs, FL 33076
$-1,184
Cash flow
-11.8%
Cash-on-Cash Return
3.4%
Cap rate
0.7%
Rent to Value Ratio
Active
$878,900
4
bds
|
2
ba
|
2,855
sqft
|
built
1992
10665 NW 49th Pl, Coral Springs, FL 33076
$-1,976
Cash flow
-11.7%
Cash-on-Cash Return
3.4%
Cap rate
0.6%
Rent to Value Ratio

Active
$715,000
4
bds
|
3
ba
|
2,609
sqft
|
built
1987
5172 NW 84th Rd, Coral Springs, FL 33067
$-2,123
Cash flow
-15.5%
Cash-on-Cash Return
2.6%
Cap rate
0.7%
Rent to Value Ratio

Active
$614,000
4
bds
|
3
ba
|
1,692
sqft
|
built
2023
12010 NW 47th Mnr, Coral Springs, FL 33076
$-1,813
Cash flow
-15.4%
Cash-on-Cash Return
2.6%
Cap rate
0.6%
Rent to Value Ratio
Active
$209,000
2
bds
|
2
ba
|
1,068
sqft
|
built
1978
8429 Forest Hills Dr, Coral Springs, FL 33065
$-523
Cash flow
-13.1%
Cash-on-Cash Return
3.1%
Cap rate
1.0%
Rent to Value Ratio
Active
$650,000
4
bds
|
3
ba
|
2,109
sqft
|
built
1972
2831 NW 88th Ter, Coral Springs, FL 33065
$-1,278
Cash flow
-10.3%
Cash-on-Cash Return
3.8%
Cap rate
0.6%
Rent to Value Ratio
Active
$240,000
1
bds
|
1
ba
|
716
sqft
|
built
2003
6790 W Sample Rd, Coral Springs, FL 33067
$-831
Cash flow
-18.1%
Cash-on-Cash Return
2.0%
Cap rate
0.8%
Rent to Value Ratio
Active
$250,000
2
bds
|
2
ba
|
984
sqft
|
built
1991
8821 Wiles Rd, Coral Springs, FL 33067
$-990
Cash flow
-20.7%
Cash-on-Cash Return
1.4%
Cap rate
0.8%
Rent to Value Ratio
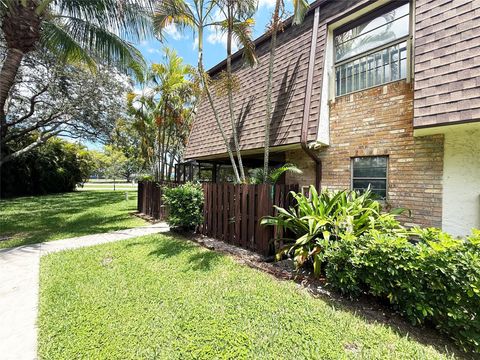
Active
$169,000
2
bds
|
2
ba
|
768
sqft
|
built
1983
10137 Twin Lakes Dr, Coral Springs, FL 33071
$-536
Cash flow
-16.5%
Cash-on-Cash Return
2.3%
Cap rate
1.1%
Rent to Value Ratio
Active
$879,900
4
bds
|
3
ba
|
2,788
sqft
|
built
1985
10180 SW 1st Ct, Coral Springs, FL 33071
$-2,249
Cash flow
-13.3%
Cash-on-Cash Return
3.1%
Cap rate
0.5%
Rent to Value Ratio
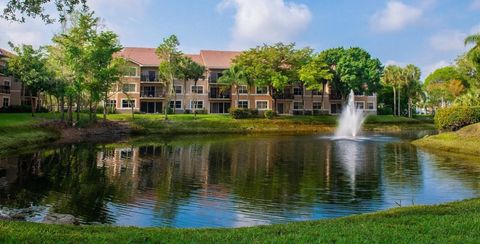
Active
$185,000
1
bds
|
1
ba
|
816
sqft
|
built
1987
1146 Coral Club Dr, Coral Springs, FL 33071
$-439
Cash flow
-12.4%
Cash-on-Cash Return
3.3%
Cap rate
1.0%
Rent to Value Ratio
Active
$244,000
2
bds
|
2
ba
|
984
sqft
|
built
1992
8701 Wiles Rd, Coral Springs, FL 33067
$-801
Cash flow
-17.1%
Cash-on-Cash Return
2.2%
Cap rate
0.9%
Rent to Value Ratio
Active
$365,000
3
bds
|
3
ba
|
1,434
sqft
|
built
1986
2561 NW 99th Ave, Coral Springs, FL 33065
$-736
Cash flow
-10.5%
Cash-on-Cash Return
3.7%
Cap rate
0.7%
Rent to Value Ratio

Active
$369,000
3
bds
|
3
ba
|
1,500
sqft
|
built
1980
9050 NW 28th St, Coral Springs, FL 33065
$-996
Cash flow
-14.1%
Cash-on-Cash Return
2.9%
Cap rate
0.8%
Rent to Value Ratio
Active
$290,000
3
bds
|
2
ba
|
1,166
sqft
|
built
1990
9033 Wiles Rd, Coral Springs, FL 33067
$-1,065
Cash flow
-19.2%
Cash-on-Cash Return
1.7%
Cap rate
0.9%
Rent to Value Ratio
Active
$565,000
4
bds
|
2
ba
|
1,769
sqft
|
built
1972
11275 NW 37th Ct, Coral Springs, FL 33065
$-1,003
Cash flow
-9.3%
Cash-on-Cash Return
4.0%
Cap rate
0.7%
Rent to Value Ratio
Active
$640,000
4
bds
|
2
ba
|
2,528
sqft
|
built
1982
1237 NW 110th Ter, Coral Springs, FL 33071
$-1,164
Cash flow
-9.5%
Cash-on-Cash Return
4.0%
Cap rate
0.6%
Rent to Value Ratio