Coral Springs, FL Investment Properties for Sale
Browse homes for sale and investment properties in Coral Springs, FL. Refine your search by price, property type, or more.
Best cash flowing properties in Coral Springs, FL
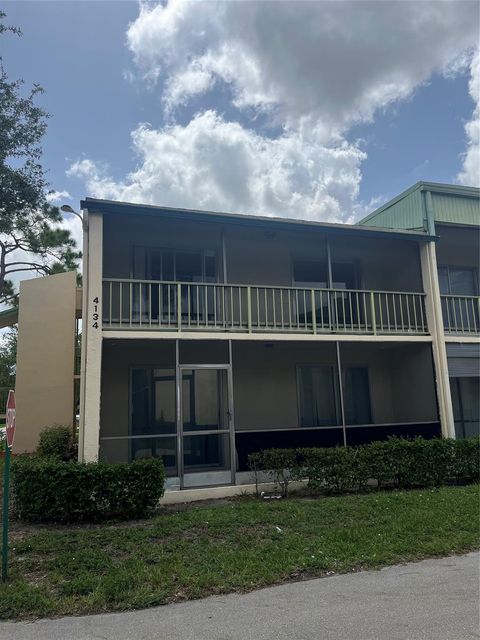
Active
$120,000
1
bds
|
2
ba
|
680
sqft
|
built
1975
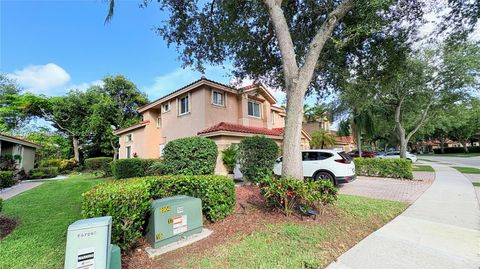
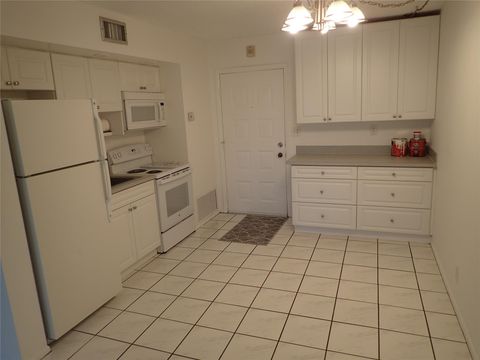
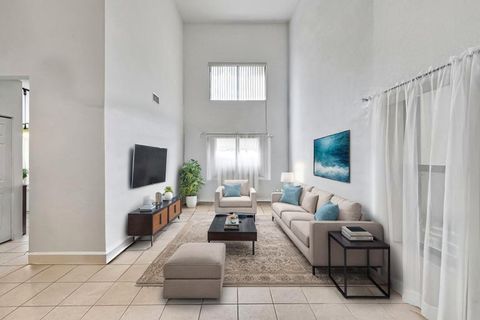
4134 NW 88th Ave, Coral Springs, FL 33065
$242
Cash flow
10.5%
Cash-on-Cash Return
8.6%
Cap rate
1.3%
Rent to Value Ratio

Active
$130,000
1
bds
|
2
ba
|
690
sqft
|
built
1979
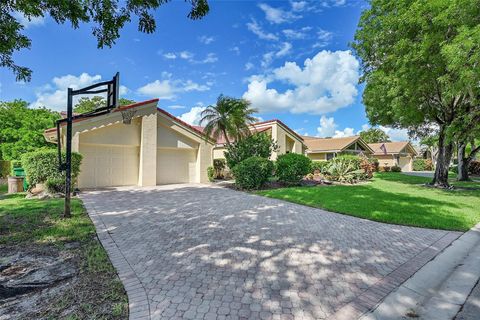
4150 NW 90th Ave, Coral Springs, FL 33065
$-21
Cash flow
-0.8%
Cash-on-Cash Return
6.0%
Cap rate
1.2%
Rent to Value Ratio
592 out of 690 properties for sale in Coral Springs, FL
Limited Results Shown
Create a free account, or log in to reveal all property listings and enjoy the complete experience.

Active
$700,000
4
bds
|
2
ba
|
1,954
sqft
|
built
1969
8301 NW 37th St, Coral Springs, FL 33065
$-1,213
Cash flow
-9.0%
Cash-on-Cash Return
4.1%
Cap rate
0.6%
Rent to Value Ratio
Active
$449,800
3
bds
|
3
ba
|
1,690
sqft
|
built
1990
11664 NW 19th Dr, Coral Springs, FL 33071
$-1,721
Cash flow
-20.0%
Cash-on-Cash Return
1.6%
Cap rate
0.6%
Rent to Value Ratio

Active
$924,999
5
bds
|
4
ba
|
2,869
sqft
|
built
1997
467 NW 120th Dr, Coral Springs, FL 33071
$-2,250
Cash flow
-12.7%
Cash-on-Cash Return
3.2%
Cap rate
0.5%
Rent to Value Ratio
Active
$950,000
5
bds
|
3
ba
|
3,604
sqft
|
built
1998
4862 Kensington Cir, Coral Springs, FL 33076
$-1,886
Cash flow
-10.4%
Cash-on-Cash Return
3.8%
Cap rate
0.6%
Rent to Value Ratio

Active
$225,000
3
bds
|
2
ba
|
1,060
sqft
|
built
1984
8317 Royal Palm Blvd, Coral Springs, FL 33065
$-434
Cash flow
-10.1%
Cash-on-Cash Return
3.8%
Cap rate
1.0%
Rent to Value Ratio

Active
$671,000
4
bds
|
2
ba
|
2,092
sqft
|
built
1974
1708 NW 84th Dr, Coral Springs, FL 33071
$-1,755
Cash flow
-13.6%
Cash-on-Cash Return
3.0%
Cap rate
0.5%
Rent to Value Ratio
Active
$679,000
3
bds
|
2
ba
|
2,172
sqft
|
built
1975
1844 NW 83rd Dr, Coral Springs, FL 33071
$-1,070
Cash flow
-8.2%
Cash-on-Cash Return
4.3%
Cap rate
0.7%
Rent to Value Ratio
Active
$600,000
3
bds
|
3
ba
|
1,623
sqft
|
built
1999
5729 NW 125th Ave, Coral Springs, FL 33076
$-1,428
Cash flow
-12.4%
Cash-on-Cash Return
3.3%
Cap rate
0.6%
Rent to Value Ratio

Active
$220,000
2
bds
|
2
ba
|
835
sqft
|
built
1988
11502 NW 43rd St, Coral Springs, FL 33065
$-609
Cash flow
-14.4%
Cash-on-Cash Return
2.8%
Cap rate
0.8%
Rent to Value Ratio

Active
$169,000
2
bds
|
2
ba
|
800
sqft
|
built
1985
3032 Coral Ridge Dr, Coral Springs, FL 33065
$-363
Cash flow
-11.2%
Cash-on-Cash Return
3.6%
Cap rate
1.1%
Rent to Value Ratio
Active
$109,000
1
bds
|
1
ba
|
580
sqft
|
built
1974
2700 Riverside Dr, Coral Springs, FL 33065
$-381
Cash flow
-18.2%
Cash-on-Cash Return
1.9%
Cap rate
1.4%
Rent to Value Ratio
Active
$574,999
3
bds
|
3
ba
|
1,711
sqft
|
built
1999
3432 NW 112th Ter, Coral Springs, FL 33065
$-1,016
Cash flow
-9.2%
Cash-on-Cash Return
4.0%
Cap rate
0.6%
Rent to Value Ratio
Active
$774,999
5
bds
|
3
ba
|
2,726
sqft
|
built
1984
11008 NW 3rd St, Coral Springs, FL 33071
$-1,447
Cash flow
-9.7%
Cash-on-Cash Return
3.9%
Cap rate
0.6%
Rent to Value Ratio
Active
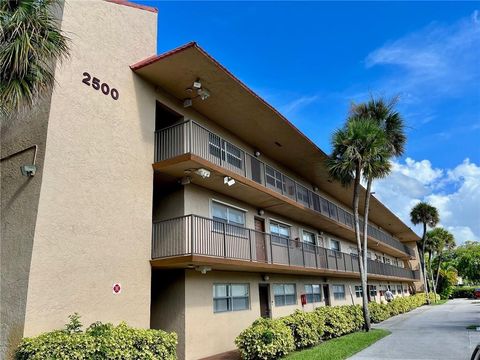
$200,000
2
bds
|
2
ba
|
1,000
sqft
|
built
1975
2500 Coral Springs Dr, Coral Springs, FL 33065
$-589
Cash flow
-15.4%
Cash-on-Cash Return
2.6%
Cap rate
1.0%
Rent to Value Ratio
Active
$340,000
3
bds
|
2
ba
|
1,407
sqft
|
built
2001
11765 W Atlantic Blvd, Coral Springs, FL 33071
$-809
Cash flow
-12.4%
Cash-on-Cash Return
3.3%
Cap rate
0.8%
Rent to Value Ratio

Active
$569,000
3
bds
|
3
ba
|
1,772
sqft
|
built
1994
457 NW 87th Ln, Coral Springs, FL 33071
$-1,066
Cash flow
-9.8%
Cash-on-Cash Return
3.9%
Cap rate
0.6%
Rent to Value Ratio
Active
$549,000
3
bds
|
2
ba
|
1,665
sqft
|
built
1998
12306 NW 55th St, Coral Springs, FL 33076
$-864
Cash flow
-8.2%
Cash-on-Cash Return
4.3%
Cap rate
0.7%
Rent to Value Ratio
Active
$289,000
2
bds
|
2
ba
|
1,123
sqft
|
built
2005
5840 W Sample Rd, Coral Springs, FL 33067
$-880
Cash flow
-15.9%
Cash-on-Cash Return
2.5%
Cap rate
0.8%
Rent to Value Ratio
Active
$374,900
2
bds
|
3
ba
|
1,284
sqft
|
built
1985
2571 NW 99th Ave, Coral Springs, FL 33065
$-807
Cash flow
-11.2%
Cash-on-Cash Return
3.7%
Cap rate
0.8%
Rent to Value Ratio
Active
$499,900
4
bds
|
2
ba
|
2,246
sqft
|
built
1982
10925 NW 21st Pl, Coral Springs, FL 33071
$-260
Cash flow
-2.7%
Cash-on-Cash Return
5.5%
Cap rate
0.8%
Rent to Value Ratio
Active
$925,000
4
bds
|
4
ba
|
3,049
sqft
|
built
1974
11140 NW 26th Dr, Coral Springs, FL 33065
$-2,532
Cash flow
-14.3%
Cash-on-Cash Return
2.9%
Cap rate
0.5%
Rent to Value Ratio
Active
$550,000
3
bds
|
2
ba
|
1,740
sqft
|
built
1978
11351 NW 37th St, Coral Springs, FL 33065
$-836
Cash flow
-7.9%
Cash-on-Cash Return
4.3%
Cap rate
0.6%
Rent to Value Ratio
Active
$249,000
2
bds
|
2
ba
|
950
sqft
|
built
1987
5841 Riverside Dr, Coral Springs, FL 33067
$-804
Cash flow
-16.8%
Cash-on-Cash Return
2.3%
Cap rate
0.9%
Rent to Value Ratio

Active
$1,100,000
4
bds
|
4
ba
|
3,366
sqft
|
built
2002
5920 NW 54th Cir, Coral Springs, FL 33067
$-2,329
Cash flow
-11.0%
Cash-on-Cash Return
3.6%
Cap rate
0.7%
Rent to Value Ratio
Active
$1,780,000
2
bds
|
0
ba
|
892
sqft
|
built
1984
10740 Royal Palm Blvd, Coral Springs, FL 33065
$-8,685
Cash flow
-25.5%
Cash-on-Cash Return
0.3%
Cap rate
0.1%
Rent to Value Ratio

Active
$215,000
2
bds
|
2
ba
|
933
sqft
|
built
1984
10001 W Atlantic Blvd, Coral Springs, FL 33071
$-601
Cash flow
-14.6%
Cash-on-Cash Return
2.8%
Cap rate
0.8%
Rent to Value Ratio
Active
$445,000
3
bds
|
3
ba
|
1,876
sqft
|
built
1988
10856 Cypress Glen Dr, Coral Springs, FL 33071
$-1,728
Cash flow
-20.3%
Cash-on-Cash Return
1.5%
Cap rate
0.7%
Rent to Value Ratio

Active
$799,900
4
bds
|
2
ba
|
2,293
sqft
|
built
1981
11044 NW 19th Mnr, Coral Springs, FL 33071
$-1,004
Cash flow
-6.5%
Cash-on-Cash Return
4.6%
Cap rate
0.7%
Rent to Value Ratio
Active
$590,000
4
bds
|
3
ba
|
1,952
sqft
|
built
2000
12056 NW 56th St, Coral Springs, FL 33076
$-1,415
Cash flow
-12.5%
Cash-on-Cash Return
3.3%
Cap rate
0.7%
Rent to Value Ratio
Active
$779,000
4
bds
|
2
ba
|
2,240
sqft
|
built
1990
9751 NW 51st St, Coral Springs, FL 33076
$-1,773
Cash flow
-11.9%
Cash-on-Cash Return
3.5%
Cap rate
0.5%
Rent to Value Ratio
Active
$120,000
1
bds
|
2
ba
|
680
sqft
|
built
1975
4134 NW 88th Ave, Coral Springs, FL 33065
$242
Cash flow
10.5%
Cash-on-Cash Return
8.6%
Cap rate
1.3%
Rent to Value Ratio

Active
$580,000
3
bds
|
2
ba
|
1,518
sqft
|
built
1976
8888 NW 21st Ct, Coral Springs, FL 33071
$-1,187
Cash flow
-10.7%
Cash-on-Cash Return
3.7%
Cap rate
0.6%
Rent to Value Ratio
Active
$684,950
6
bds
|
3
ba
|
2,945
sqft
|
built
1983
1288 NW 112th Way, Coral Springs, FL 33071
$-1,462
Cash flow
-11.1%
Cash-on-Cash Return
3.6%
Cap rate
0.6%
Rent to Value Ratio

Active
$874,900
4
bds
|
3
ba
|
0
sqft
|
built
1983
2019 NW 108th Ln, Coral Springs, FL 33071
$-1,858
Cash flow
-11.1%
Cash-on-Cash Return
3.6%
Cap rate
0.5%
Rent to Value Ratio
Active
$130,000
1
bds
|
2
ba
|
690
sqft
|
built
1979
4150 NW 90th Ave, Coral Springs, FL 33065
$-21
Cash flow
-0.8%
Cash-on-Cash Return
6.0%
Cap rate
1.2%
Rent to Value Ratio

Active
$1,020,000
5
bds
|
4
ba
|
2,900
sqft
|
built
2000
4853 NW 124th Way, Coral Springs, FL 33076
$-2,826
Cash flow
-14.5%
Cash-on-Cash Return
2.8%
Cap rate
0.5%
Rent to Value Ratio
Active
$975,000
4
bds
|
3
ba
|
2,702
sqft
|
built
1999
12358 NW 51st St, Coral Springs, FL 33076
$-2,862
Cash flow
-15.3%
Cash-on-Cash Return
2.6%
Cap rate
0.5%
Rent to Value Ratio
Active
$795,000
4
bds
|
3
ba
|
2,505
sqft
|
built
1987
5655 NW 86th Ave, Coral Springs, FL 33067
$-1,314
Cash flow
-8.6%
Cash-on-Cash Return
4.2%
Cap rate
0.7%
Rent to Value Ratio
Active
$499,900
3
bds
|
2
ba
|
1,642
sqft
|
built
1999
5657 NW 121st Ave, Coral Springs, FL 33076
$-717
Cash flow
-7.5%
Cash-on-Cash Return
4.4%
Cap rate
0.7%
Rent to Value Ratio
Active
$690,000
4
bds
|
2
ba
|
2,172
sqft
|
built
1996
12123 NW 15th Ct, Coral Springs, FL 33071
$-1,996
Cash flow
-15.1%
Cash-on-Cash Return
2.7%
Cap rate
0.6%
Rent to Value Ratio