Coral Springs, FL Investment Properties for Sale
Browse homes for sale and investment properties in Coral Springs, FL. Refine your search by price, property type, or more.
Best cash flowing properties in Coral Springs, FL
Active
$120,000
2
bds
|
1
ba
|
850
sqft
|
built
1981
4269 NW 89th Ave, Coral Springs, FL 33065
$-19
Cash flow
-0.8%
Cash-on-Cash Return
6.0%
Cap rate
1.4%
Rent to Value Ratio
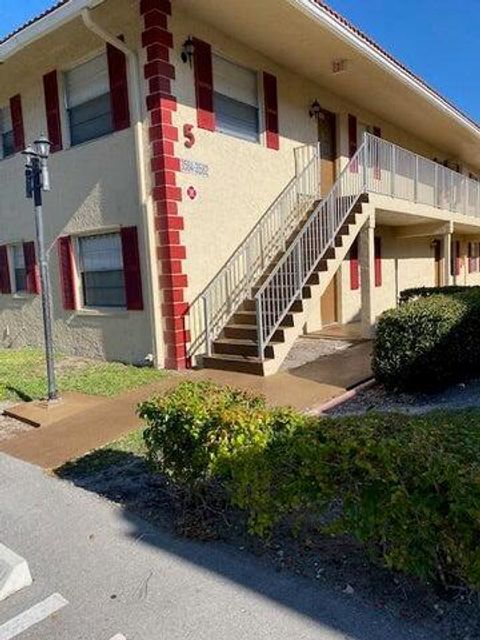
Active
$175,000
2
bds
|
2
ba
|
900
sqft
|
built
1974
9101 W Sample Rd, Coral Springs, FL 33065
$-228
Cash flow
-6.8%
Cash-on-Cash Return
4.6%
Cap rate
1.3%
Rent to Value Ratio
614 out of 718 properties for sale in Coral Springs, FL
Limited Results Shown
Create a free account, or log in to reveal all property listings and enjoy the complete experience.
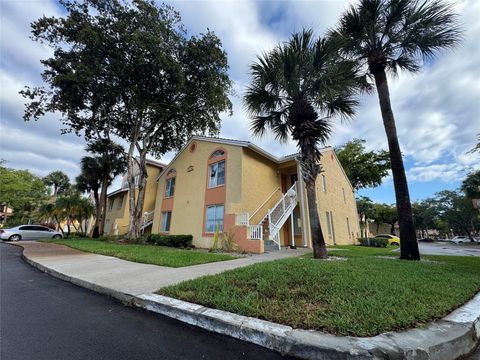
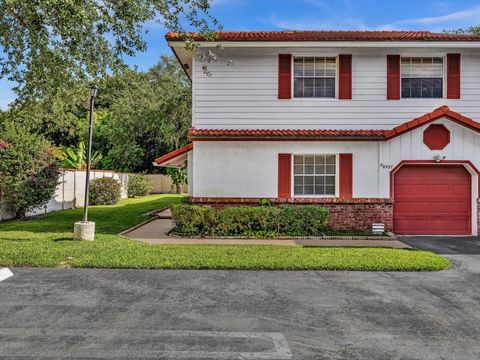
Active
$659,500
4
bds
|
2
ba
|
1,841
sqft
|
built
1982
935 NW 110th Ln, Coral Springs, FL 33071
$-1,413
Cash flow
-11.2%
Cash-on-Cash Return
3.6%
Cap rate
0.6%
Rent to Value Ratio
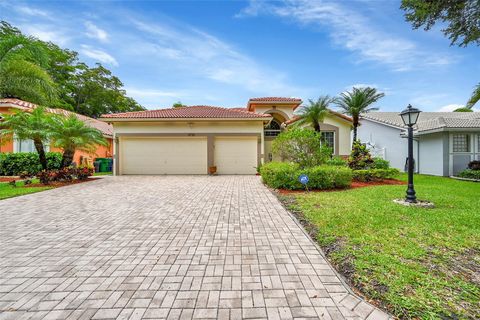
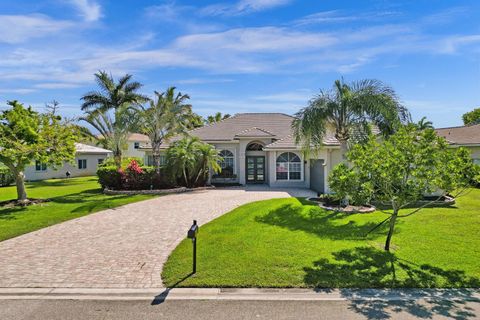
Active
$619,000
4
bds
|
2
ba
|
2,184
sqft
|
built
1972
7503 NW 42nd St, Coral Springs, FL 33065
$-1,182
Cash flow
-10.0%
Cash-on-Cash Return
3.9%
Cap rate
0.6%
Rent to Value Ratio
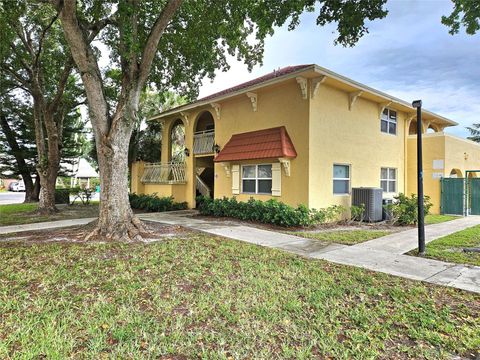
Active
$1,450,000
6
bds
|
5
ba
|
4,052
sqft
|
built
1998
5081 NW 120th Ave, Coral Springs, FL 33076
$-3,775
Cash flow
-13.6%
Cash-on-Cash Return
3.0%
Cap rate
0.6%
Rent to Value Ratio

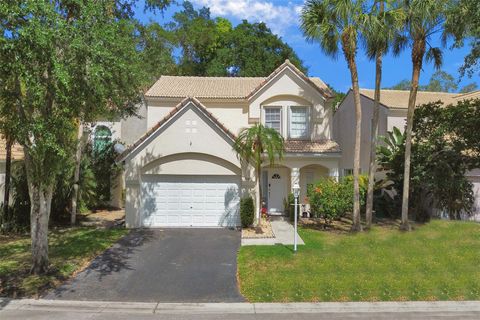
Active
$389,000
3
bds
|
3
ba
|
1,170
sqft
|
built
1997
9955 NW 56th Pl, Coral Springs, FL 33076
$-904
Cash flow
-12.1%
Cash-on-Cash Return
3.4%
Cap rate
0.7%
Rent to Value Ratio
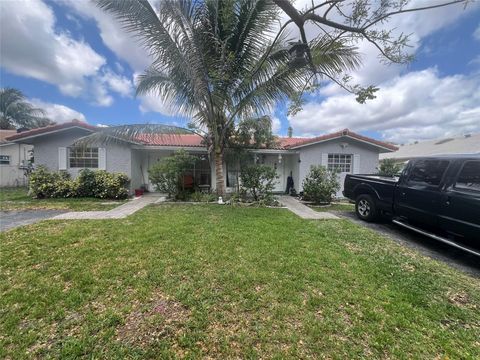
Active
$724,999
4
bds
|
3
ba
|
2,140
sqft
|
built
1987
5618 NW 89th Ave, Coral Springs, FL 33067
$-992
Cash flow
-7.1%
Cash-on-Cash Return
4.5%
Cap rate
0.7%
Rent to Value Ratio
Active
$583,000
3
bds
|
2
ba
|
1,693
sqft
|
built
1972
10950 NW 38th Ct, Coral Springs, FL 33065
$-1,374
Cash flow
-12.3%
Cash-on-Cash Return
3.3%
Cap rate
0.6%
Rent to Value Ratio
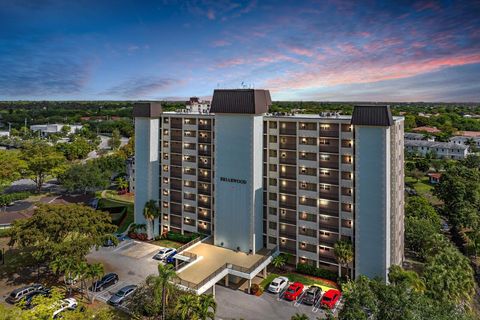
Active
$189,900
1
bds
|
2
ba
|
598
sqft
|
built
1984
10001 W Atlantic Blvd, Coral Springs, FL 33071
$-395
Cash flow
-10.9%
Cash-on-Cash Return
3.7%
Cap rate
1.0%
Rent to Value Ratio

Active
$205,000
2
bds
|
2
ba
|
958
sqft
|
built
1975
3361 NW 85th Ave, Coral Springs, FL 33065
$-475
Cash flow
-12.1%
Cash-on-Cash Return
3.4%
Cap rate
0.9%
Rent to Value Ratio

Active
$799,000
4
bds
|
4
ba
|
2,802
sqft
|
built
1988
5425 NW 86th Ter, Coral Springs, FL 33067
$-1,488
Cash flow
-9.7%
Cash-on-Cash Return
3.9%
Cap rate
0.6%
Rent to Value Ratio
Active
$799,999
4
bds
|
3
ba
|
2,198
sqft
|
built
1988
5426 NW 61st Ave, Coral Springs, FL 33067
$-1,724
Cash flow
-11.2%
Cash-on-Cash Return
3.6%
Cap rate
0.5%
Rent to Value Ratio

Active
$425,000
3
bds
|
3
ba
|
1,536
sqft
|
built
2000
11635 NW 47th Ct, Coral Springs, FL 33076
$-1,151
Cash flow
-14.1%
Cash-on-Cash Return
2.9%
Cap rate
0.8%
Rent to Value Ratio
Active
$635,000
4
bds
|
2
ba
|
2,015
sqft
|
built
1988
9515 NW 25th Ct, Coral Springs, FL 33065
$-499
Cash flow
-4.1%
Cash-on-Cash Return
5.2%
Cap rate
0.9%
Rent to Value Ratio
Active
$550,000
3
bds
|
2
ba
|
1,682
sqft
|
built
1994
11672 NW 13th Mnr, Coral Springs, FL 33071
$-1,069
Cash flow
-10.1%
Cash-on-Cash Return
3.8%
Cap rate
0.6%
Rent to Value Ratio
Active
$839,900
4
bds
|
3
ba
|
2,800
sqft
|
built
1989
9881 NW 49th Pl, Coral Springs, FL 33076
$-1,394
Cash flow
-8.7%
Cash-on-Cash Return
4.2%
Cap rate
0.7%
Rent to Value Ratio
Active
$265,000
2
bds
|
2
ba
|
1,044
sqft
|
built
1987
996 Coral Club Dr, Coral Springs, FL 33071
$-732
Cash flow
-14.4%
Cash-on-Cash Return
2.8%
Cap rate
0.8%
Rent to Value Ratio
Active
$224,900
2
bds
|
2
ba
|
809
sqft
|
built
1982
3566 N University Dr, Coral Springs, FL 33065
$-756
Cash flow
-17.5%
Cash-on-Cash Return
2.1%
Cap rate
0.8%
Rent to Value Ratio
Active
$792,000
4
bds
|
3
ba
|
2,906
sqft
|
built
1994
5791 NW 48th Dr, Coral Springs, FL 33067
$-1,680
Cash flow
-11.1%
Cash-on-Cash Return
3.6%
Cap rate
0.5%
Rent to Value Ratio
Active
$189,000
2
bds
|
2
ba
|
1,030
sqft
|
built
1974
10762 La Placida Dr, Coral Springs, FL 33065
$-539
Cash flow
-14.9%
Cash-on-Cash Return
2.7%
Cap rate
1.0%
Rent to Value Ratio

Active
$690,000
4
bds
|
3
ba
|
2,169
sqft
|
built
2001
5832 NW 120th Ave, Coral Springs, FL 33076
$-1,722
Cash flow
-13.0%
Cash-on-Cash Return
3.2%
Cap rate
0.7%
Rent to Value Ratio

Active
$899,000
5
bds
|
4
ba
|
2,980
sqft
|
built
1997
4985 NW 120th Ave, Coral Springs, FL 33076
$-1,191
Cash flow
-6.9%
Cash-on-Cash Return
4.6%
Cap rate
0.7%
Rent to Value Ratio

Active
$545,000
4
bds
|
3
ba
|
0
sqft
|
built
1981
2426 NW 91st Ave, Coral Springs, FL 33065
$-1,444
Cash flow
-13.8%
Cash-on-Cash Return
3.0%
Cap rate
0.6%
Rent to Value Ratio
Active
$175,000
2
bds
|
2
ba
|
900
sqft
|
built
1974
9101 W Sample Rd, Coral Springs, FL 33065
$-228
Cash flow
-6.8%
Cash-on-Cash Return
4.6%
Cap rate
1.3%
Rent to Value Ratio
Active
$869,000
5
bds
|
3
ba
|
2,506
sqft
|
built
1991
1708 NW 126th Dr, Coral Springs, FL 33071
$-2,498
Cash flow
-15.0%
Cash-on-Cash Return
2.7%
Cap rate
0.7%
Rent to Value Ratio
Active
$599,900
3
bds
|
2
ba
|
1,606
sqft
|
built
1974
1922 NW 85th Dr, Coral Springs, FL 33071
$-1,168
Cash flow
-10.2%
Cash-on-Cash Return
3.8%
Cap rate
0.5%
Rent to Value Ratio
Active
$550,000
3
bds
|
3
ba
|
2,048
sqft
|
built
2000
12618 NW 56th Dr, Coral Springs, FL 33076
$-1,158
Cash flow
-11.0%
Cash-on-Cash Return
3.6%
Cap rate
0.7%
Rent to Value Ratio

Active
$1,045,000
5
bds
|
4
ba
|
3,281
sqft
|
built
2013
8264 NW 118th Way, Coral Springs, FL 33076
$-2,359
Cash flow
-11.8%
Cash-on-Cash Return
3.4%
Cap rate
0.6%
Rent to Value Ratio
Active
$120,000
2
bds
|
1
ba
|
850
sqft
|
built
1981
4269 NW 89th Ave, Coral Springs, FL 33065
$-19
Cash flow
-0.8%
Cash-on-Cash Return
6.0%
Cap rate
1.4%
Rent to Value Ratio
Active
$794,900
4
bds
|
3
ba
|
2,642
sqft
|
built
1988
2041 Oakmont Ter, Coral Springs, FL 33071
$-1,659
Cash flow
-10.9%
Cash-on-Cash Return
3.6%
Cap rate
0.6%
Rent to Value Ratio
Active
$350,000
4
bds
|
3
ba
|
1,831
sqft
|
built
1985
8957 NW 23rd St, Coral Springs, FL 33065
$-932
Cash flow
-13.9%
Cash-on-Cash Return
3.0%
Cap rate
0.9%
Rent to Value Ratio
Active
$899,000
4
bds
|
3
ba
|
2,535
sqft
|
built
1995
4952 NW 110th Ter, Coral Springs, FL 33076
$-1,407
Cash flow
-8.2%
Cash-on-Cash Return
4.3%
Cap rate
0.6%
Rent to Value Ratio

Active
$230,000
2
bds
|
2
ba
|
958
sqft
|
built
1975
3361 NW 85th Ave, Coral Springs, FL 33065
$-787
Cash flow
-17.9%
Cash-on-Cash Return
2.0%
Cap rate
0.9%
Rent to Value Ratio

Active
$425,000
3
bds
|
3
ba
|
1,460
sqft
|
built
1999
10531 NW 57th St, Coral Springs, FL 33076
$-776
Cash flow
-9.5%
Cash-on-Cash Return
4.0%
Cap rate
0.8%
Rent to Value Ratio
Active
$550,000
3
bds
|
3
ba
|
1,570
sqft
|
built
1993
3769 Wilderness Way, Coral Springs, FL 33065
$-1,066
Cash flow
-10.1%
Cash-on-Cash Return
3.8%
Cap rate
0.6%
Rent to Value Ratio
Active
$650,000
bds
|
0
ba
|
2,330
sqft
|
built
1973
4380 NW 79th Ter, Coral Springs, FL 33065
$-2,397
Cash flow
-19.2%
Cash-on-Cash Return
1.7%
Cap rate
0.4%
Rent to Value Ratio
Active
$674,999
4
bds
|
2
ba
|
1,965
sqft
|
built
1984
4414 NW 113th Ln, Coral Springs, FL 33065
$-1,068
Cash flow
-8.3%
Cash-on-Cash Return
4.2%
Cap rate
0.6%
Rent to Value Ratio

Active
$325,000
3
bds
|
2
ba
|
1,321
sqft
|
built
2002
11643 W Atlantic Blvd, Coral Springs, FL 33071
$-873
Cash flow
-14.0%
Cash-on-Cash Return
2.9%
Cap rate
0.8%
Rent to Value Ratio
Active
$739,247
4
bds
|
2
ba
|
2,377
sqft
|
built
1985
9124 NW 50th Ct, Coral Springs, FL 33067
$-1,287
Cash flow
-9.1%
Cash-on-Cash Return
4.1%
Cap rate
0.6%
Rent to Value Ratio
Active
$609,000
4
bds
|
2
ba
|
2,177
sqft
|
built
1971
10840 NW 40th St, Coral Springs, FL 33065
$-1,523
Cash flow
-13.0%
Cash-on-Cash Return
3.1%
Cap rate
0.6%
Rent to Value Ratio
Active
$879,900
5
bds
|
3
ba
|
2,955
sqft
|
built
2002
6616 NW 56th Dr, Coral Springs, FL 33067
$-2,053
Cash flow
-12.2%
Cash-on-Cash Return
3.3%
Cap rate
0.6%
Rent to Value Ratio

Active
$829,990
5
bds
|
3
ba
|
2,848
sqft
|
built
1997
5354 NW 119th Ter, Coral Springs, FL 33076
$-1,442
Cash flow
-9.1%
Cash-on-Cash Return
4.1%
Cap rate
0.7%
Rent to Value Ratio