Coral Springs, FL Investment Properties for Sale
Browse homes for sale and investment properties in Coral Springs, FL. Refine your search by price, property type, or more.
Best cash flowing properties in Coral Springs, FL
Active
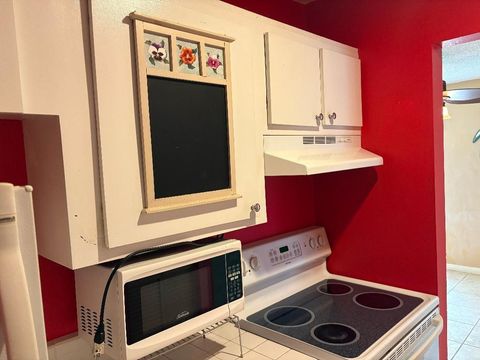
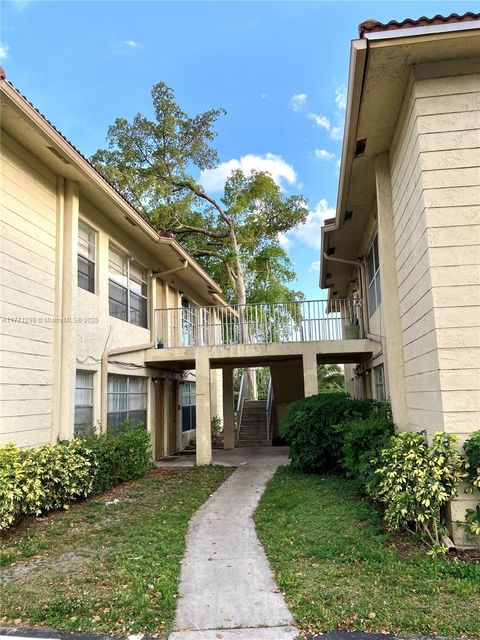
$113,900
1
bds
|
1
ba
|
610
sqft
|
built
1974
4117 NW 88th Ave, Coral Springs, FL 33065
$75
Cash flow
3.4%
Cash-on-Cash Return
6.9%
Cap rate
1.3%
Rent to Value Ratio

Active
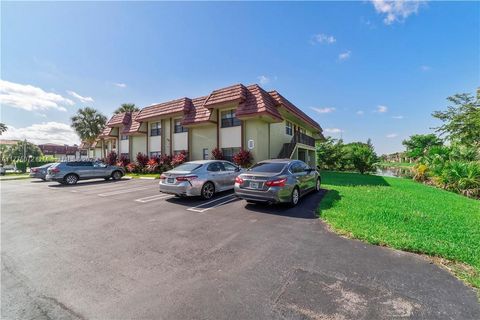
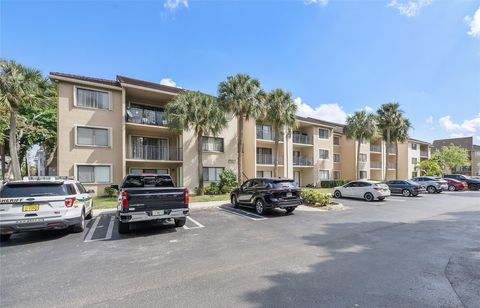
$325,000
2
bds
|
3
ba
|
1,190
sqft
|
built
1988
10821 Cypress Glen Dr, Coral Springs, FL 33071
$0
Cash flow
n/a
Cash-on-Cash Return
n/a
Cap rate
n/a
Rent to Value Ratio
614 out of 718 properties for sale in Coral Springs, FL
Limited Results Shown
Create a free account, or log in to reveal all property listings and enjoy the complete experience.
Active
$248,000
2
bds
|
2
ba
|
870
sqft
|
built
1981
3266 NW 104th Ave, Coral Springs, FL 33065
$-738
Cash flow
-15.5%
Cash-on-Cash Return
2.6%
Cap rate
0.8%
Rent to Value Ratio
Active
$528,900
3
bds
|
2
ba
|
1,694
sqft
|
built
1985
2866 NW 91st Ave, Coral Springs, FL 33065
$-1,083
Cash flow
-10.7%
Cash-on-Cash Return
3.7%
Cap rate
0.7%
Rent to Value Ratio
Active
$549,995
3
bds
|
2
ba
|
2,008
sqft
|
built
1988
5372 Pine Cir, Coral Springs, FL 33067
$-1,092
Cash flow
-10.4%
Cash-on-Cash Return
3.8%
Cap rate
0.7%
Rent to Value Ratio
Active
$1,074,000
5
bds
|
4
ba
|
3,156
sqft
|
built
1990
4300 NW 63rd Ave, Coral Springs, FL 33067
$-1,769
Cash flow
-8.6%
Cash-on-Cash Return
4.2%
Cap rate
0.7%
Rent to Value Ratio

Active
$730,000
5
bds
|
3
ba
|
2,472
sqft
|
built
1974
1980 NW 81st Ave, Coral Springs, FL 33071
$-1,758
Cash flow
-12.6%
Cash-on-Cash Return
3.3%
Cap rate
0.5%
Rent to Value Ratio
Active
$659,000
4
bds
|
2
ba
|
1,999
sqft
|
built
1973
11390 NW 37th St, Coral Springs, FL 33065
$-1,867
Cash flow
-14.8%
Cash-on-Cash Return
2.7%
Cap rate
0.5%
Rent to Value Ratio
Active
$759,000
4
bds
|
3
ba
|
2,389
sqft
|
built
1984
10866 NW 14th St, Coral Springs, FL 33071
$-1,393
Cash flow
-9.6%
Cash-on-Cash Return
3.9%
Cap rate
0.6%
Rent to Value Ratio
Active
$210,000
2
bds
|
2
ba
|
1,290
sqft
|
built
1974
3307 NW 108th Dr, Coral Springs, FL 33065
$-424
Cash flow
-10.5%
Cash-on-Cash Return
3.7%
Cap rate
1.0%
Rent to Value Ratio
Active
$325,000
3
bds
|
2
ba
|
1,166
sqft
|
built
1991
8801 Wiles Rd, Coral Springs, FL 33067
$-773
Cash flow
-12.4%
Cash-on-Cash Return
3.3%
Cap rate
0.9%
Rent to Value Ratio
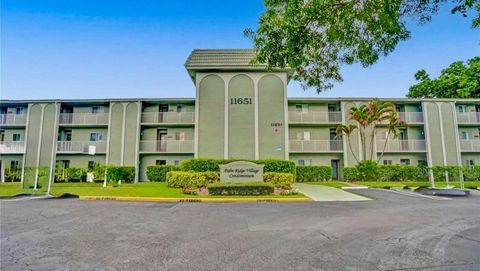
Active
$189,999
2
bds
|
2
ba
|
937
sqft
|
built
1977
11651 Royal Palm Blvd, Coral Springs, FL 33065
$-520
Cash flow
-14.3%
Cash-on-Cash Return
2.9%
Cap rate
1.1%
Rent to Value Ratio

Active
$799,900
4
bds
|
3
ba
|
2,640
sqft
|
built
1992
12737 NW 18th Pl, Coral Springs, FL 33071
$-1,357
Cash flow
-8.9%
Cash-on-Cash Return
4.1%
Cap rate
0.7%
Rent to Value Ratio

Active
$225,000
2
bds
|
2
ba
|
1,060
sqft
|
built
1987
915 Riverside Dr, Coral Springs, FL 33071
$-949
Cash flow
-22.0%
Cash-on-Cash Return
1.1%
Cap rate
0.8%
Rent to Value Ratio
Active
$1,749,000
5
bds
|
5
ba
|
3,980
sqft
|
built
2002
6207 NW 120th Dr, Coral Springs, FL 33076
$-3,510
Cash flow
-10.5%
Cash-on-Cash Return
3.7%
Cap rate
0.6%
Rent to Value Ratio
Active
$189,999
2
bds
|
2
ba
|
937
sqft
|
built
1974
11651 Royal Palm Blvd, Coral Springs, FL 33065
$-585
Cash flow
-16.1%
Cash-on-Cash Return
2.5%
Cap rate
0.9%
Rent to Value Ratio

Active
$244,000
2
bds
|
2
ba
|
1,150
sqft
|
built
1980
2810 Riverside Dr, Coral Springs, FL 33065
$0
Cash flow
n/a
Cash-on-Cash Return
n/a
Cap rate
n/a
Rent to Value Ratio

Active
$850,000
4
bds
|
3
ba
|
2,283
sqft
|
built
1996
10261 NW 54th Pl, Coral Springs, FL 33076
$-1,571
Cash flow
-9.6%
Cash-on-Cash Return
3.9%
Cap rate
0.7%
Rent to Value Ratio
Active
$209,990
2
bds
|
2
ba
|
740
sqft
|
built
1981
11562 Royal Palm Blvd, Coral Springs, FL 33065
$-435
Cash flow
-10.8%
Cash-on-Cash Return
3.7%
Cap rate
0.9%
Rent to Value Ratio

Active
$899,000
4
bds
|
3
ba
|
2,797
sqft
|
built
1984
10877 NW 6th St, Coral Springs, FL 33071
$-1,176
Cash flow
-6.8%
Cash-on-Cash Return
4.6%
Cap rate
0.8%
Rent to Value Ratio
Active
$265,000
3
bds
|
2
ba
|
1,263
sqft
|
built
1990
9188 W Atlantic Blvd, Coral Springs, FL 33071
$-802
Cash flow
-15.8%
Cash-on-Cash Return
2.5%
Cap rate
0.9%
Rent to Value Ratio
Active
$265,000
3
bds
|
2
ba
|
1,273
sqft
|
built
1991
9188 W Atlantic Blvd, Coral Springs, FL 33071
$-806
Cash flow
-15.9%
Cash-on-Cash Return
2.5%
Cap rate
0.9%
Rent to Value Ratio

Active
$445,000
3
bds
|
3
ba
|
1,737
sqft
|
built
1992
11405 Lakeview Dr, Coral Springs, FL 33071
$-1,433
Cash flow
-16.8%
Cash-on-Cash Return
2.3%
Cap rate
0.7%
Rent to Value Ratio
Active
$456,999
3
bds
|
2
ba
|
1,444
sqft
|
built
1973
10901 NW 41st Dr, Coral Springs, FL 33065
$0
Cash flow
n/a
Cash-on-Cash Return
n/a
Cap rate
n/a
Rent to Value Ratio

Active
$144,900
1
bds
|
1
ba
|
860
sqft
|
built
1977
11640 NW 39th St, Coral Springs, FL 33065
$-170
Cash flow
-6.1%
Cash-on-Cash Return
4.7%
Cap rate
1.2%
Rent to Value Ratio
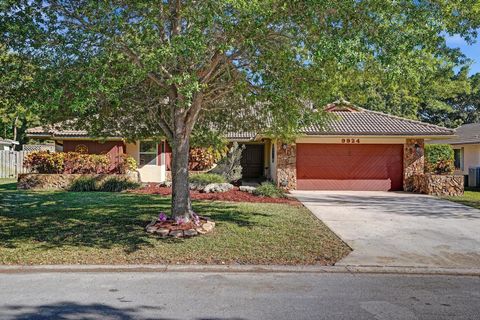
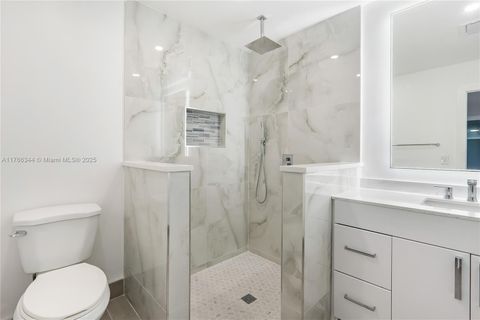
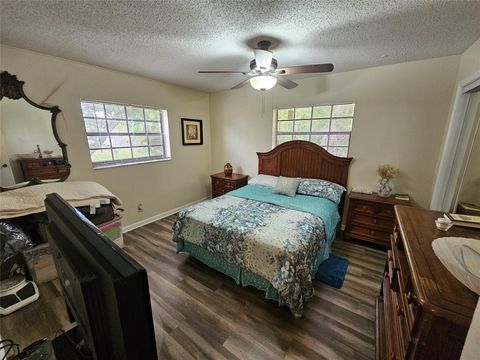
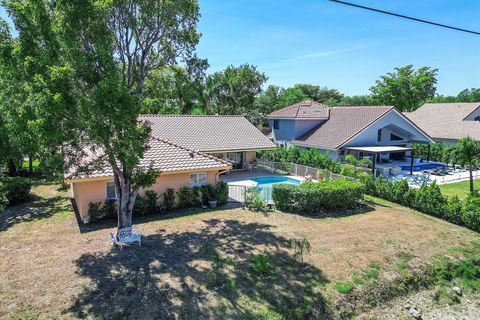
Active
$779,000
4
bds
|
3
ba
|
2,575
sqft
|
built
1979
9924 NW 3rd Pl, Coral Springs, FL 33071
$-1,136
Cash flow
-7.6%
Cash-on-Cash Return
4.4%
Cap rate
0.7%
Rent to Value Ratio

Active
$560,000
3
bds
|
2
ba
|
1,864
sqft
|
built
1976
3740 NW 113th Ave, Coral Springs, FL 33065
$-1,249
Cash flow
-11.6%
Cash-on-Cash Return
3.5%
Cap rate
0.6%
Rent to Value Ratio

Active
$243,000
2
bds
|
2
ba
|
986
sqft
|
built
1990
9244 W Atlantic Blvd, Coral Springs, FL 33071
$-746
Cash flow
-16.0%
Cash-on-Cash Return
2.5%
Cap rate
0.8%
Rent to Value Ratio

Active
$1,099,900
5
bds
|
3
ba
|
2,982
sqft
|
built
2000
12307 NW 49th St, Coral Springs, FL 33076
$-2,282
Cash flow
-10.8%
Cash-on-Cash Return
3.7%
Cap rate
0.6%
Rent to Value Ratio

Active
$738,000
bds
|
0
ba
|
2,801
sqft
|
built
1972
3620 NW 110th Ave, Coral Springs, FL 33065
$-3,017
Cash flow
-21.3%
Cash-on-Cash Return
1.2%
Cap rate
0.4%
Rent to Value Ratio
Active
$739,999
4
bds
|
2
ba
|
2,566
sqft
|
built
1974
4321 NW 110th Ct, Coral Springs, FL 33065
$-3,000
Cash flow
-21.2%
Cash-on-Cash Return
1.3%
Cap rate
0.4%
Rent to Value Ratio
Active
$325,000
2
bds
|
3
ba
|
1,190
sqft
|
built
1988
10821 Cypress Glen Dr, Coral Springs, FL 33071
$0
Cash flow
n/a
Cash-on-Cash Return
n/a
Cap rate
n/a
Rent to Value Ratio

Active
$200,000
2
bds
|
2
ba
|
809
sqft
|
built
1982
3738 N University Dr, Coral Springs, FL 33065
$-557
Cash flow
-14.5%
Cash-on-Cash Return
2.8%
Cap rate
1.0%
Rent to Value Ratio

Active
$799,900
4
bds
|
4
ba
|
2,747
sqft
|
built
1972
2720 NW 107th Ave, Coral Springs, FL 33065
$-1,563
Cash flow
-10.2%
Cash-on-Cash Return
3.8%
Cap rate
0.6%
Rent to Value Ratio
Active
$620,000
3
bds
|
2
ba
|
2,055
sqft
|
built
1974
4460 NW 105th Ter, Coral Springs, FL 33065
$-1,049
Cash flow
-8.8%
Cash-on-Cash Return
4.1%
Cap rate
0.6%
Rent to Value Ratio
Active
$769,000
4
bds
|
2
ba
|
2,366
sqft
|
built
1993
4636 Rothschild Dr, Coral Springs, FL 33067
$-1,661
Cash flow
-11.3%
Cash-on-Cash Return
3.6%
Cap rate
0.7%
Rent to Value Ratio
Active
$330,000
3
bds
|
2
ba
|
1,260
sqft
|
built
1982
9545 NW 2nd Pl, Coral Springs, FL 33071
$-1,133
Cash flow
-17.9%
Cash-on-Cash Return
2.0%
Cap rate
0.7%
Rent to Value Ratio
Active
$170,000
2
bds
|
2
ba
|
768
sqft
|
built
1982
836 Twin Lakes Dr, Coral Springs, FL 33071
$-526
Cash flow
-16.1%
Cash-on-Cash Return
2.4%
Cap rate
1.1%
Rent to Value Ratio
Active
$113,900
1
bds
|
1
ba
|
610
sqft
|
built
1974
4117 NW 88th Ave, Coral Springs, FL 33065
$75
Cash flow
3.4%
Cash-on-Cash Return
6.9%
Cap rate
1.3%
Rent to Value Ratio

Active
$649,000
4
bds
|
2
ba
|
1,853
sqft
|
built
1971
3971 NW 109th Ave, Coral Springs, FL 33065
$-1,517
Cash flow
-12.2%
Cash-on-Cash Return
3.3%
Cap rate
0.6%
Rent to Value Ratio
Active
$225,000
2
bds
|
2
ba
|
1,220
sqft
|
built
1981
3158 Coral Springs Dr, Coral Springs, FL 33065
$-504
Cash flow
-11.7%
Cash-on-Cash Return
3.5%
Cap rate
1.0%
Rent to Value Ratio
Active
$599,999
4
bds
|
2
ba
|
1,961
sqft
|
built
1976
2428 NW 98th Ln, Coral Springs, FL 33065
$-1,192
Cash flow
-10.4%
Cash-on-Cash Return
3.8%
Cap rate
0.7%
Rent to Value Ratio