Coral Springs, FL Investment Properties for Sale
Browse homes for sale and investment properties in Coral Springs, FL. Refine your search by price, property type, or more.
Best cash flowing properties in Coral Springs, FL
Active
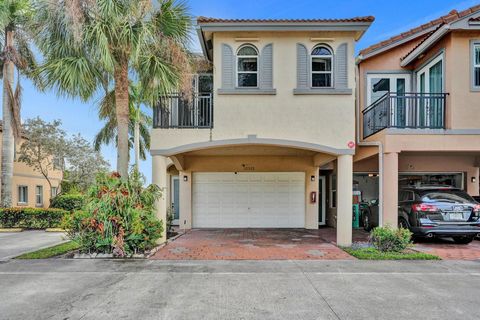
$220,000
2
bds
|
2
ba
|
767
sqft
|
built
1985
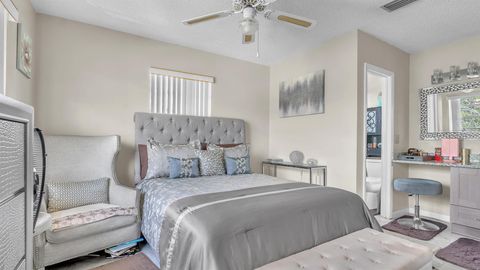
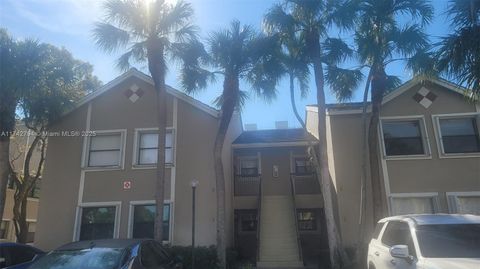
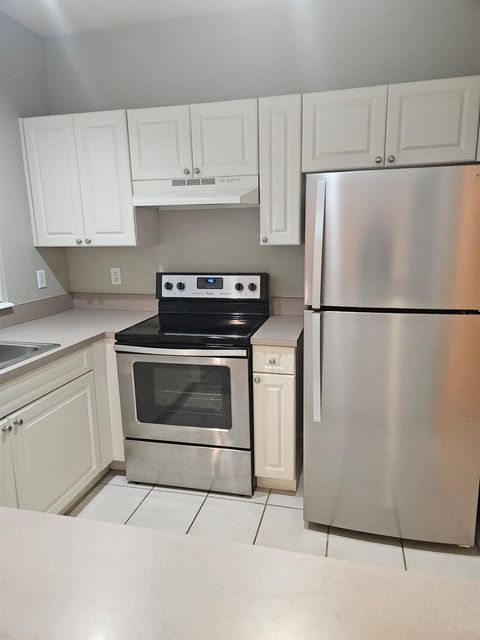
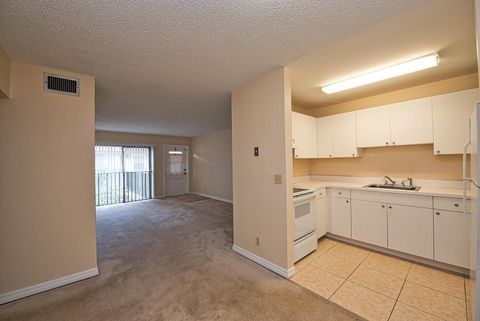
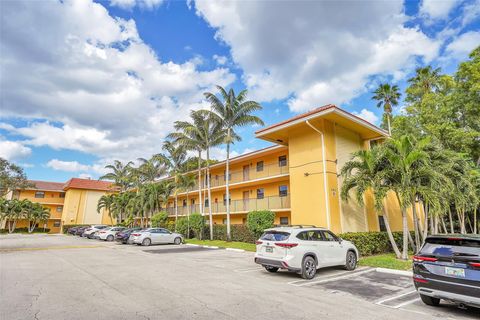
3246 NW 102nd Ter, Coral Springs, FL 33065
$-209
Cash flow
-5.0%
Cash-on-Cash Return
5.0%
Cap rate
1.0%
Rent to Value Ratio
Active
$234,899
2
bds
|
3
ba
|
1,000
sqft
|
built
1986
9124 NW 40th St, Coral Springs, FL 33065
$-363
Cash flow
-8.1%
Cash-on-Cash Return
4.3%
Cap rate
0.9%
Rent to Value Ratio
614 out of 718 properties for sale in Coral Springs, FL
Limited Results Shown
Create a free account, or log in to reveal all property listings and enjoy the complete experience.
Active
$290,000
2
bds
|
2
ba
|
850
sqft
|
built
1990
9755 Westview Dr, Coral Springs, FL 33076
$-923
Cash flow
-16.6%
Cash-on-Cash Return
2.3%
Cap rate
0.7%
Rent to Value Ratio
Active
$230,000
2
bds
|
2
ba
|
990
sqft
|
built
1980
8735 Ramblewood Dr, Coral Springs, FL 33071
$-634
Cash flow
-14.4%
Cash-on-Cash Return
2.8%
Cap rate
0.9%
Rent to Value Ratio
Active
$209,000
2
bds
|
1
ba
|
980
sqft
|
built
1987
833 Riverside Dr, Coral Springs, FL 33071
$-650
Cash flow
-16.2%
Cash-on-Cash Return
2.4%
Cap rate
1.0%
Rent to Value Ratio

Active
$195,000
2
bds
|
2
ba
|
629
sqft
|
built
1993
12272 Royal Palm Blvd, Coral Springs, FL 33065
$-566
Cash flow
-15.1%
Cash-on-Cash Return
2.7%
Cap rate
1.0%
Rent to Value Ratio

Active
$549,650
3
bds
|
2
ba
|
1,542
sqft
|
built
1985
1666 NW 106th Ter, Coral Springs, FL 33071
$-1,296
Cash flow
-12.3%
Cash-on-Cash Return
3.3%
Cap rate
0.7%
Rent to Value Ratio
Active
$550,000
3
bds
|
2
ba
|
1,734
sqft
|
built
1975
3081 NW 103rd Ln, Coral Springs, FL 33065
$-579
Cash flow
-5.5%
Cash-on-Cash Return
4.9%
Cap rate
0.7%
Rent to Value Ratio
Active
$340,000
3
bds
|
3
ba
|
1,600
sqft
|
built
1980
4240 NW 114th Ter, Coral Springs, FL 33065
$-1,354
Cash flow
-20.8%
Cash-on-Cash Return
1.4%
Cap rate
0.8%
Rent to Value Ratio
Active
$205,000
1
bds
|
2
ba
|
729
sqft
|
built
1972
3200 Coral Springs Dr, Coral Springs, FL 33065
$-599
Cash flow
-15.2%
Cash-on-Cash Return
2.6%
Cap rate
0.9%
Rent to Value Ratio
Active
$299,900
3
bds
|
2
ba
|
1,186
sqft
|
built
1987
9633 Riverside Dr, Coral Springs, FL 33071
$-955
Cash flow
-16.6%
Cash-on-Cash Return
2.3%
Cap rate
0.8%
Rent to Value Ratio
Active
$275,000
3
bds
|
2
ba
|
1,138
sqft
|
built
1993
12244 Royal Palm Blvd, Coral Springs, FL 33065
$-759
Cash flow
-14.4%
Cash-on-Cash Return
2.8%
Cap rate
0.9%
Rent to Value Ratio
Active
$223,000
2
bds
|
2
ba
|
1,068
sqft
|
built
1978
8429 Forest Hills Dr, Coral Springs, FL 33065
$-602
Cash flow
-14.1%
Cash-on-Cash Return
2.9%
Cap rate
0.9%
Rent to Value Ratio

Active
$2,150,000
7
bds
|
8
ba
|
7,479
sqft
|
built
1990
7772 NW 55th Pl, Coral Springs, FL 33067
$-6,347
Cash flow
-15.4%
Cash-on-Cash Return
2.6%
Cap rate
0.5%
Rent to Value Ratio
Active
$172,500
2
bds
|
2
ba
|
825
sqft
|
built
1985
3218 Coral Ridge Dr, Coral Springs, FL 33065
$-389
Cash flow
-11.8%
Cash-on-Cash Return
3.4%
Cap rate
1.0%
Rent to Value Ratio
Active
$230,000
1
bds
|
1
ba
|
716
sqft
|
built
2003
6662 W Sample Rd, Coral Springs, FL 33067
$-531
Cash flow
-12.0%
Cash-on-Cash Return
3.4%
Cap rate
0.8%
Rent to Value Ratio
Active
$220,000
2
bds
|
2
ba
|
767
sqft
|
built
1985
3246 NW 102nd Ter, Coral Springs, FL 33065
$-209
Cash flow
-5.0%
Cash-on-Cash Return
5.0%
Cap rate
1.0%
Rent to Value Ratio
Active
$275,000
2
bds
|
2
ba
|
850
sqft
|
built
1990
9777 Westview Dr, Coral Springs, FL 33076
$-440
Cash flow
-8.3%
Cash-on-Cash Return
4.2%
Cap rate
0.8%
Rent to Value Ratio
Active
$925,000
5
bds
|
3
ba
|
3,035
sqft
|
built
1999
865 NW 124th Ave, Coral Springs, FL 33071
$-1,885
Cash flow
-10.6%
Cash-on-Cash Return
3.7%
Cap rate
0.7%
Rent to Value Ratio

Active
$219,000
2
bds
|
2
ba
|
768
sqft
|
built
1982
10194 Twin Lakes Dr, Coral Springs, FL 33071
$-753
Cash flow
-17.9%
Cash-on-Cash Return
2.0%
Cap rate
0.9%
Rent to Value Ratio

Active
$635,000
4
bds
|
2
ba
|
1,410
sqft
|
built
1977
2452 NW 98th Ln, Coral Springs, FL 33065
$-828
Cash flow
-6.8%
Cash-on-Cash Return
4.6%
Cap rate
0.6%
Rent to Value Ratio
Active
$849,000
4
bds
|
4
ba
|
2,124
sqft
|
built
1986
9077 NW 49th Pl, Coral Springs, FL 33067
$-1,673
Cash flow
-10.3%
Cash-on-Cash Return
3.8%
Cap rate
0.7%
Rent to Value Ratio

Active
$635,000
3
bds
|
3
ba
|
2,007
sqft
|
built
1999
12205 NW 56th Ct, Coral Springs, FL 33076
$-760
Cash flow
-6.2%
Cash-on-Cash Return
4.7%
Cap rate
0.7%
Rent to Value Ratio
Active
$185,000
2
bds
|
1
ba
|
753
sqft
|
built
1981
11360 Royal Palm Blvd, Coral Springs, FL 33065
$-490
Cash flow
-13.8%
Cash-on-Cash Return
3.0%
Cap rate
1.0%
Rent to Value Ratio
Active
$199,000
2
bds
|
2
ba
|
629
sqft
|
built
1993
12262 Royal Palm Blvd, Coral Springs, FL 33065
$-427
Cash flow
-11.2%
Cash-on-Cash Return
3.6%
Cap rate
0.9%
Rent to Value Ratio
Active
$899,000
4
bds
|
3
ba
|
2,377
sqft
|
built
1974
11035 NW 26th Dr, Coral Springs, FL 33065
$-1,562
Cash flow
-9.1%
Cash-on-Cash Return
4.1%
Cap rate
0.6%
Rent to Value Ratio

Active
$290,000
2
bds
|
3
ba
|
1,190
sqft
|
built
1988
10836 Cypress Glen Dr, Coral Springs, FL 33071
$-1,100
Cash flow
-19.8%
Cash-on-Cash Return
1.6%
Cap rate
0.8%
Rent to Value Ratio
Active
$200,000
2
bds
|
2
ba
|
990
sqft
|
built
1980
1200 NW 87th Ave, Coral Springs, FL 33071
$-445
Cash flow
-11.6%
Cash-on-Cash Return
3.5%
Cap rate
1.0%
Rent to Value Ratio
Active
$199,900
2
bds
|
2
ba
|
840
sqft
|
built
1984
11441 NW 39th Ct, Coral Springs, FL 33065
$-536
Cash flow
-14.0%
Cash-on-Cash Return
2.9%
Cap rate
1.0%
Rent to Value Ratio
Active
$699,000
3
bds
|
2
ba
|
2,105
sqft
|
built
1981
10960 NW 17th Pl, Coral Springs, FL 33071
$-1,536
Cash flow
-11.5%
Cash-on-Cash Return
3.5%
Cap rate
0.6%
Rent to Value Ratio

Active
$1,199,999
3
bds
|
0
ba
|
3,903
sqft
|
built
1979
8406 NW 35th St, Coral Springs, FL 33065
$-5,001
Cash flow
-21.7%
Cash-on-Cash Return
1.1%
Cap rate
0.3%
Rent to Value Ratio

Active
$465,000
3
bds
|
3
ba
|
1,580
sqft
|
built
2002
3464 NW 99th Way, Coral Springs, FL 33065
$-1,455
Cash flow
-16.3%
Cash-on-Cash Return
2.4%
Cap rate
0.6%
Rent to Value Ratio
Active
$189,000
2
bds
|
2
ba
|
1,350
sqft
|
built
1977
10777 W Sample Rd, Coral Springs, FL 33065
$-404
Cash flow
-11.2%
Cash-on-Cash Return
3.6%
Cap rate
1.2%
Rent to Value Ratio

Active
$799,000
4
bds
|
3
ba
|
2,446
sqft
|
built
1990
12043 SW 1st St, Coral Springs, FL 33071
$-1,636
Cash flow
-10.7%
Cash-on-Cash Return
3.7%
Cap rate
0.6%
Rent to Value Ratio
Active
$289,000
3
bds
|
2
ba
|
1,166
sqft
|
built
2006
8761 Wiles Rd, Coral Springs, FL 33067
$-749
Cash flow
-13.5%
Cash-on-Cash Return
3.0%
Cap rate
0.9%
Rent to Value Ratio
Active
$425,000
4
bds
|
3
ba
|
1,950
sqft
|
built
2004
12312 Royal Palm Blvd, Coral Springs, FL 33065
$-758
Cash flow
-9.3%
Cash-on-Cash Return
4.0%
Cap rate
0.8%
Rent to Value Ratio
Active
$628,000
3
bds
|
2
ba
|
1,934
sqft
|
built
1985
4021 NW 72nd Ave, Coral Springs, FL 33065
$-932
Cash flow
-7.7%
Cash-on-Cash Return
4.4%
Cap rate
0.6%
Rent to Value Ratio
Active
$1,550,000
2
bds
|
0
ba
|
4,138
sqft
|
built
1984
11410 NW 39th St, Coral Springs, FL 33065
$-8,200
Cash flow
-27.6%
Cash-on-Cash Return
-0.2%
Cap rate
0.1%
Rent to Value Ratio

Active
$399,990
3
bds
|
3
ba
|
1,800
sqft
|
built
1980
8707 NW 35th St, Coral Springs, FL 33065
$-730
Cash flow
-9.5%
Cash-on-Cash Return
4.0%
Cap rate
0.8%
Rent to Value Ratio

Active
$294,000
2
bds
|
2
ba
|
1,200
sqft
|
built
1987
995 Riverside Dr, Coral Springs, FL 33071
$-1,038
Cash flow
-18.4%
Cash-on-Cash Return
1.9%
Cap rate
0.9%
Rent to Value Ratio
Active
$234,899
2
bds
|
3
ba
|
1,000
sqft
|
built
1986
9124 NW 40th St, Coral Springs, FL 33065
$-363
Cash flow
-8.1%
Cash-on-Cash Return
4.3%
Cap rate
0.9%
Rent to Value Ratio

Active
$265,000
3
bds
|
2
ba
|
1,340
sqft
|
built
2002
10151 W Atlantic Blvd, Coral Springs, FL 33071
$-540
Cash flow
-10.6%
Cash-on-Cash Return
3.7%
Cap rate
0.9%
Rent to Value Ratio