Coral Springs, FL Investment Properties for Sale
Browse homes for sale and investment properties in Coral Springs, FL. Refine your search by price, property type, or more.
Best cash flowing properties in Coral Springs, FL
Active
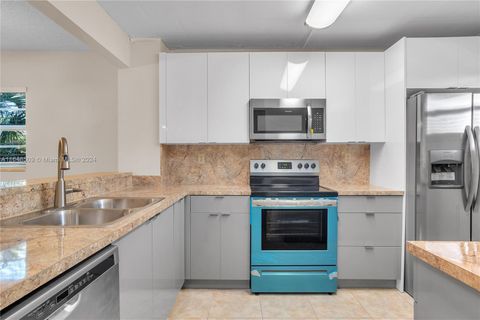
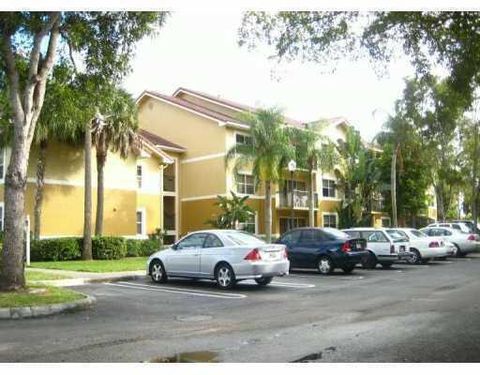
$138,500
1
bds
|
2
ba
|
690
sqft
|
built
1981
4279 NW 89th Ave, Coral Springs, FL 33065
$-84
Cash flow
-3.2%
Cash-on-Cash Return
5.4%
Cap rate
1.2%
Rent to Value Ratio
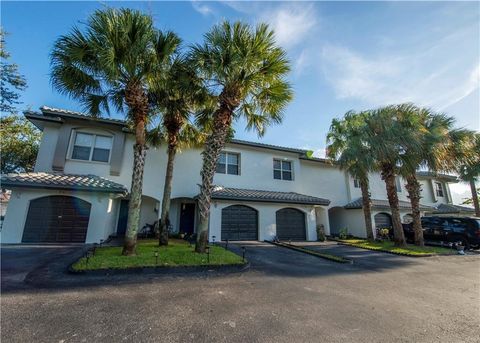
Active
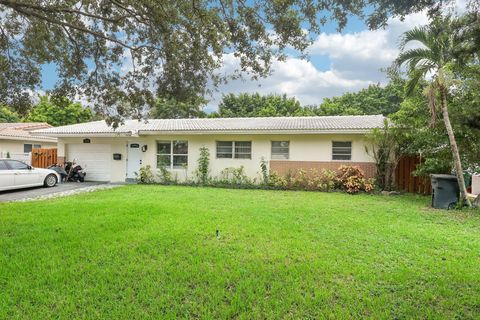
$210,000
2
bds
|
2
ba
|
1,068
sqft
|
built
1979
8441 Forest Hills Dr, Coral Springs, FL 33065
$-208
Cash flow
-5.2%
Cash-on-Cash Return
5.0%
Cap rate
1.0%
Rent to Value Ratio
614 out of 718 properties for sale in Coral Springs, FL
Limited Results Shown
Create a free account, or log in to reveal all property listings and enjoy the complete experience.
Active
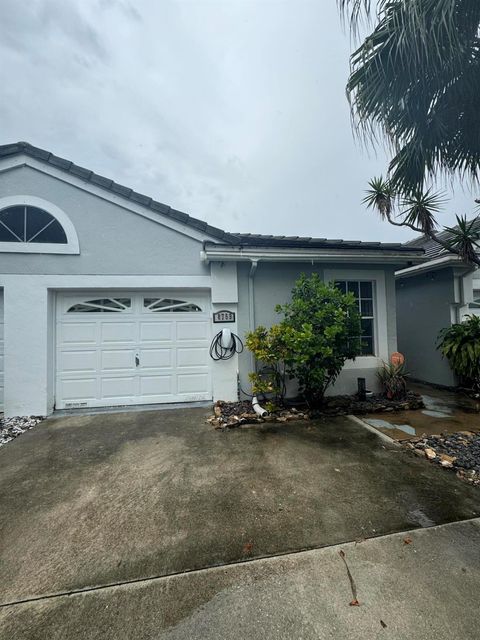
$260,000
2
bds
|
2
ba
|
1,074
sqft
|
built
1987
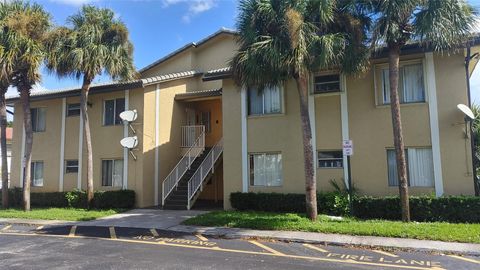
1156 Coral Club Dr, Coral Springs, FL 33071
$-767
Cash flow
-15.4%
Cash-on-Cash Return
2.6%
Cap rate
0.8%
Rent to Value Ratio
Active
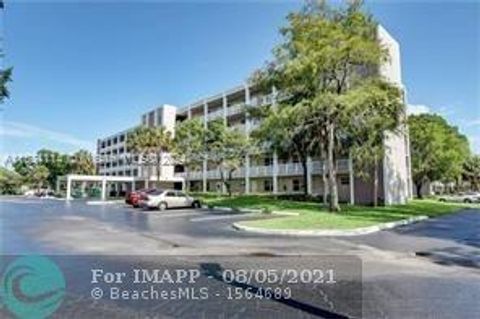
$208,000
2
bds
|
2
ba
|
1,179
sqft
|
built
1975
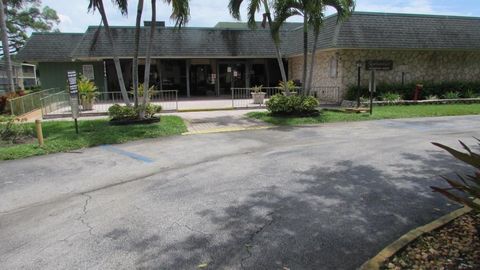
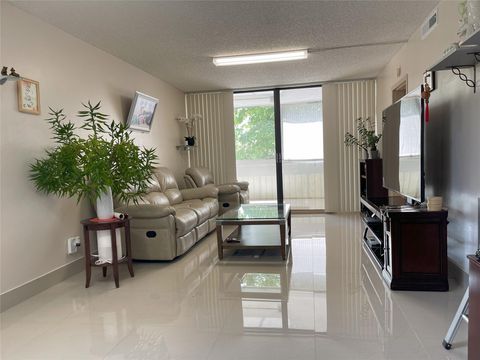
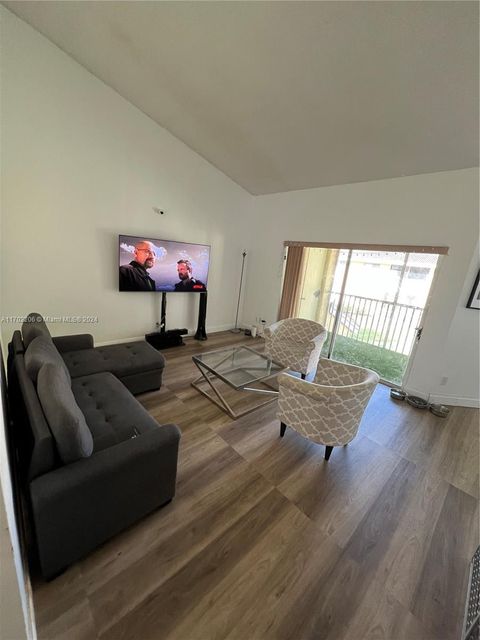
2960 Riverside Dr, Coral Springs, FL 33065
$-512
Cash flow
-12.8%
Cash-on-Cash Return
3.2%
Cap rate
1.0%
Rent to Value Ratio
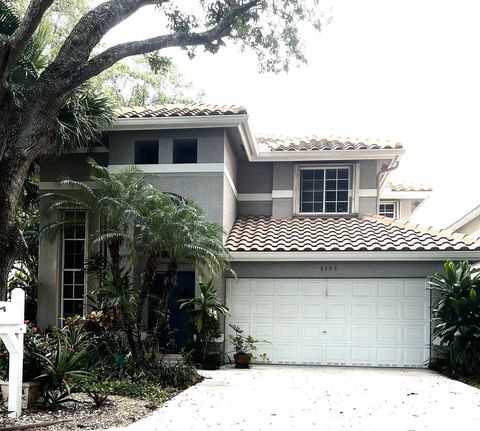
Active
$649,000
3
bds
|
2
ba
|
2,087
sqft
|
built
1978
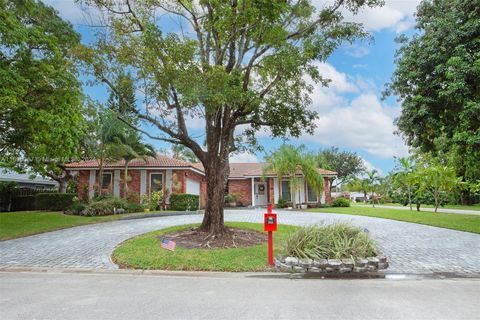
892 NW 83rd Dr, Coral Springs, FL 33071
$-987
Cash flow
-7.9%
Cash-on-Cash Return
4.3%
Cap rate
0.8%
Rent to Value Ratio
Active
$235,000
3
bds
|
2
ba
|
950
sqft
|
built
1991
11585 NW 43rd St, Coral Springs, FL 33065
$-443
Cash flow
-9.8%
Cash-on-Cash Return
3.9%
Cap rate
1.0%
Rent to Value Ratio
Active
$679,999
4
bds
|
2
ba
|
1,984
sqft
|
built
1983
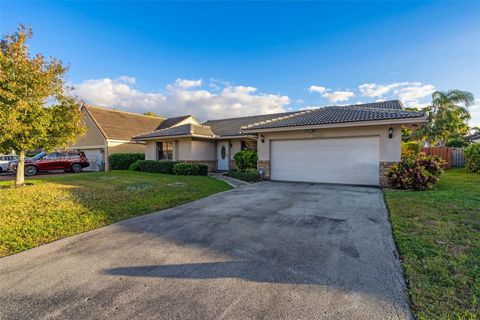
10820 NW 10th Pl, Coral Springs, FL 33071
$-1,450
Cash flow
-11.1%
Cash-on-Cash Return
3.6%
Cap rate
0.6%
Rent to Value Ratio
Active
$399,000
3
bds
|
2
ba
|
1,852
sqft
|
built
1973
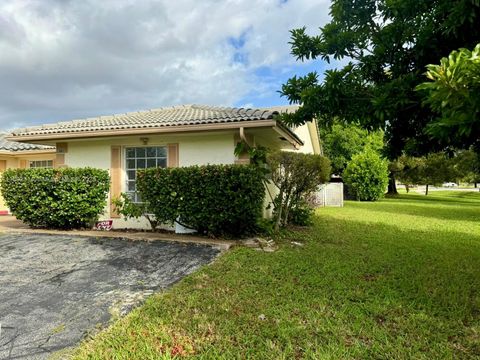
11001 NW 44th St, Coral Springs, FL 33065
$-747
Cash flow
-9.8%
Cash-on-Cash Return
3.9%
Cap rate
0.7%
Rent to Value Ratio
Active
$935,000
4
bds
|
3
ba
|
2,518
sqft
|
built
2001
5840 NW 54th Cir, Coral Springs, FL 33067
$-1,586
Cash flow
-8.9%
Cash-on-Cash Return
4.1%
Cap rate
0.7%
Rent to Value Ratio
Active
$239,999
2
bds
|
2
ba
|
900
sqft
|
built
1984
3181 Riverside Dr, Coral Springs, FL 33065
$-348
Cash flow
-7.6%
Cash-on-Cash Return
4.4%
Cap rate
0.8%
Rent to Value Ratio
Active
$799,000
4
bds
|
3
ba
|
2,414
sqft
|
built
1996
5776 NW 56th Mnr, Coral Springs, FL 33067
$-1,146
Cash flow
-7.5%
Cash-on-Cash Return
4.4%
Cap rate
0.6%
Rent to Value Ratio
Active
$989,999
4
bds
|
5
ba
|
3,208
sqft
|
built
1991
1775 Eagle Trace Blvd W, Coral Springs, FL 33071
$-2,247
Cash flow
-11.8%
Cash-on-Cash Return
3.4%
Cap rate
0.7%
Rent to Value Ratio
Active
$650,000
bds
|
0
ba
|
2,108
sqft
|
built
1980
4371 NW 80th Ave, Coral Springs, FL 33065
$-2,582
Cash flow
-20.7%
Cash-on-Cash Return
1.4%
Cap rate
0.4%
Rent to Value Ratio
Active
$265,000
2
bds
|
2
ba
|
986
sqft
|
built
1990
9200 W Atlantic Blvd, Coral Springs, FL 33071
$-827
Cash flow
-16.3%
Cash-on-Cash Return
2.4%
Cap rate
0.8%
Rent to Value Ratio
Active
$215,000
2
bds
|
1
ba
|
980
sqft
|
built
1987
833 Riverside Dr, Coral Springs, FL 33071
$-698
Cash flow
-16.9%
Cash-on-Cash Return
2.2%
Cap rate
0.8%
Rent to Value Ratio
Active
$190,000
2
bds
|
2
ba
|
1,050
sqft
|
built
1974
8821 NW 38th Dr, Coral Springs, FL 33065
$-414
Cash flow
-11.4%
Cash-on-Cash Return
3.5%
Cap rate
1.1%
Rent to Value Ratio
Active
$235,000
2
bds
|
2
ba
|
870
sqft
|
built
1982
3253 NW 104th Ave, Coral Springs, FL 33065
$-600
Cash flow
-13.3%
Cash-on-Cash Return
3.1%
Cap rate
0.9%
Rent to Value Ratio
Active
$190,000
1
bds
|
1
ba
|
784
sqft
|
built
1988
5761 Riverside Dr, Coral Springs, FL 33067
$-575
Cash flow
-15.8%
Cash-on-Cash Return
2.5%
Cap rate
0.9%
Rent to Value Ratio
Active
$265,000
2
bds
|
2
ba
|
1,040
sqft
|
built
1982
9549 NW 2nd Pl, Coral Springs, FL 33071
$-882
Cash flow
-17.4%
Cash-on-Cash Return
2.2%
Cap rate
0.8%
Rent to Value Ratio

Active
$270,000
2
bds
|
2
ba
|
1,106
sqft
|
built
1987
5801 Riverside Dr, Coral Springs, FL 33067
$-948
Cash flow
-18.3%
Cash-on-Cash Return
1.9%
Cap rate
0.8%
Rent to Value Ratio

Active
$635,000
4
bds
|
2
ba
|
1,869
sqft
|
built
1986
7105 NW 45th St, Coral Springs, FL 33065
$-1,226
Cash flow
-10.1%
Cash-on-Cash Return
3.8%
Cap rate
0.6%
Rent to Value Ratio
Active
$129,500
1
bds
|
1
ba
|
750
sqft
|
built
1974
8404 W Sample Rd, Coral Springs, FL 33065
$-236
Cash flow
-9.5%
Cash-on-Cash Return
4.0%
Cap rate
1.2%
Rent to Value Ratio
Active
$190,000
2
bds
|
2
ba
|
768
sqft
|
built
1983
10127 Twin Lakes Dr, Coral Springs, FL 33071
$-623
Cash flow
-17.1%
Cash-on-Cash Return
2.2%
Cap rate
0.9%
Rent to Value Ratio
Active
$205,000
2
bds
|
2
ba
|
768
sqft
|
built
1982
1028 Twin Lakes Dr, Coral Springs, FL 33071
$-548
Cash flow
-13.9%
Cash-on-Cash Return
2.9%
Cap rate
1.0%
Rent to Value Ratio

Active
$1,195,000
5
bds
|
3
ba
|
3,135
sqft
|
built
1989
133 SW 121st Way, Coral Springs, FL 33071
$-1,276
Cash flow
-5.6%
Cash-on-Cash Return
4.9%
Cap rate
0.7%
Rent to Value Ratio
Active
$215,000
2
bds
|
2
ba
|
768
sqft
|
built
1983
909 Twin Lakes Dr, Coral Springs, FL 33071
$-613
Cash flow
-14.9%
Cash-on-Cash Return
2.7%
Cap rate
0.9%
Rent to Value Ratio
Active
$680,000
4
bds
|
2
ba
|
2,048
sqft
|
built
2001
12318 NW 25th St, Coral Springs, FL 33065
$-1,655
Cash flow
-12.7%
Cash-on-Cash Return
3.2%
Cap rate
0.7%
Rent to Value Ratio

Active
$4,800,000
9
bds
|
11
ba
|
8,167
sqft
|
built
1995
4010 NW 100th Ave, Coral Springs, FL 33065
$-21,548
Cash flow
-23.4%
Cash-on-Cash Return
0.8%
Cap rate
0.1%
Rent to Value Ratio
Active
$275,000
2
bds
|
2
ba
|
1,099
sqft
|
built
1974
8801 W Sample Rd, Coral Springs, FL 33065
$-880
Cash flow
-16.7%
Cash-on-Cash Return
2.3%
Cap rate
0.7%
Rent to Value Ratio
Active
$310,000
3
bds
|
2
ba
|
1,365
sqft
|
built
1974
8101 NW 27th St, Coral Springs, FL 33065
$-1,072
Cash flow
-18.0%
Cash-on-Cash Return
2.0%
Cap rate
0.8%
Rent to Value Ratio
Active
$239,900
2
bds
|
2
ba
|
1,044
sqft
|
built
1988
1122 Coral Club Dr, Coral Springs, FL 33071
$-699
Cash flow
-15.2%
Cash-on-Cash Return
2.7%
Cap rate
0.8%
Rent to Value Ratio
Active
$439,900
3
bds
|
2
ba
|
1,315
sqft
|
built
2005
5860 W Sample Rd, Coral Springs, FL 33067
$-1,207
Cash flow
-14.3%
Cash-on-Cash Return
2.9%
Cap rate
0.7%
Rent to Value Ratio

Active
$264,900
3
bds
|
2
ba
|
1,365
sqft
|
built
1974
8105 NW 27th St, Coral Springs, FL 33065
$-837
Cash flow
-16.5%
Cash-on-Cash Return
2.4%
Cap rate
0.9%
Rent to Value Ratio
Active
$180,000
2
bds
|
2
ba
|
990
sqft
|
built
1980
1100 NW 87th Ave, Coral Springs, FL 33071
$-408
Cash flow
-11.8%
Cash-on-Cash Return
3.4%
Cap rate
1.0%
Rent to Value Ratio
Active
$210,000
2
bds
|
2
ba
|
1,068
sqft
|
built
1979
8441 Forest Hills Dr, Coral Springs, FL 33065
$-208
Cash flow
-5.2%
Cash-on-Cash Return
5.0%
Cap rate
1.0%
Rent to Value Ratio
Active
$575,000
4
bds
|
2
ba
|
1,498
sqft
|
built
1970
7514 NW 40th St, Coral Springs, FL 33065
$-1,170
Cash flow
-10.6%
Cash-on-Cash Return
3.7%
Cap rate
0.6%
Rent to Value Ratio
Active
$138,500
1
bds
|
2
ba
|
690
sqft
|
built
1981
4279 NW 89th Ave, Coral Springs, FL 33065
$-84
Cash flow
-3.2%
Cash-on-Cash Return
5.4%
Cap rate
1.2%
Rent to Value Ratio
Active
$600,000
3
bds
|
2
ba
|
1,342
sqft
|
built
1995
8759 Forest Hills Blvd, Coral Springs, FL 33065
$-1,496
Cash flow
-13.0%
Cash-on-Cash Return
3.2%
Cap rate
0.6%
Rent to Value Ratio
Active
$199,000
1
bds
|
2
ba
|
835
sqft
|
built
1980
8735 Ramblewood Dr, Coral Springs, FL 33071
$-530
Cash flow
-13.9%
Cash-on-Cash Return
2.9%
Cap rate
0.8%
Rent to Value Ratio
Active
$339,000
3
bds
|
2
ba
|
1,166
sqft
|
built
1991
8801 Wiles Rd, Coral Springs, FL 33067
$-836
Cash flow
-12.9%
Cash-on-Cash Return
3.2%
Cap rate
0.8%
Rent to Value Ratio
Active
$649,900
4
bds
|
3
ba
|
2,293
sqft
|
built
1994
8395 NW 57th Dr, Coral Springs, FL 33067
$-1,062
Cash flow
-8.5%
Cash-on-Cash Return
4.2%
Cap rate
0.6%
Rent to Value Ratio
Active
$350,000
3
bds
|
3
ba
|
1,670
sqft
|
built
1997
9746 NW 35th St, Coral Springs, FL 33065
$-994
Cash flow
-14.8%
Cash-on-Cash Return
2.7%
Cap rate
0.8%
Rent to Value Ratio