Coral Springs, FL Investment Properties for Sale
Browse homes for sale and investment properties in Coral Springs, FL. Refine your search by price, property type, or more.
Best cash flowing properties in Coral Springs, FL
Active
$138,000
1
bds
|
1
ba
|
619
sqft
|
built
1984
2771 Riverside Dr, Coral Springs, FL 33065
$-195
Cash flow
-7.4%
Cash-on-Cash Return
4.5%
Cap rate
1.2%
Rent to Value Ratio

Active
$210,000
2
bds
|
2
ba
|
1,068
sqft
|
built
1974
8411 Forest Hills Dr, Coral Springs, FL 33065
$-289
Cash flow
-7.2%
Cash-on-Cash Return
4.5%
Cap rate
1.0%
Rent to Value Ratio
614 out of 718 properties for sale in Coral Springs, FL
Limited Results Shown
Create a free account, or log in to reveal all property listings and enjoy the complete experience.

Active
$199,950
2
bds
|
2
ba
|
1,000
sqft
|
built
1975
8605 W Sample Rd, Coral Springs, FL 33065
$-882
Cash flow
-23.0%
Cash-on-Cash Return
0.9%
Cap rate
1.0%
Rent to Value Ratio
Active
$634,800
4
bds
|
2
ba
|
2,048
sqft
|
built
2001
12340 NW 26th St, Coral Springs, FL 33065
$-1,626
Cash flow
-13.4%
Cash-on-Cash Return
3.1%
Cap rate
0.6%
Rent to Value Ratio
Active
$345,000
2
bds
|
2
ba
|
1,200
sqft
|
built
1987
1672 Cypress Pointe Dr, Coral Springs, FL 33071
$-1,130
Cash flow
-17.1%
Cash-on-Cash Return
2.2%
Cap rate
0.8%
Rent to Value Ratio

Active
$910,000
5
bds
|
4
ba
|
3,332
sqft
|
built
1995
1560 NW 103rd Ter, Coral Springs, FL 33071
$-1,252
Cash flow
-7.2%
Cash-on-Cash Return
4.5%
Cap rate
0.7%
Rent to Value Ratio
Active
$949,000
4
bds
|
3
ba
|
2,219
sqft
|
built
1983
875 NW 108th Ln, Coral Springs, FL 33071
$-2,752
Cash flow
-15.1%
Cash-on-Cash Return
2.7%
Cap rate
0.4%
Rent to Value Ratio
Active
$525,000
4
bds
|
3
ba
|
1,939
sqft
|
built
1996
10172 Royal Palm Blvd, Coral Springs, FL 33065
$-1,534
Cash flow
-15.2%
Cash-on-Cash Return
2.6%
Cap rate
0.6%
Rent to Value Ratio
Active
$138,000
1
bds
|
1
ba
|
619
sqft
|
built
1984
2771 Riverside Dr, Coral Springs, FL 33065
$-195
Cash flow
-7.4%
Cash-on-Cash Return
4.5%
Cap rate
1.2%
Rent to Value Ratio

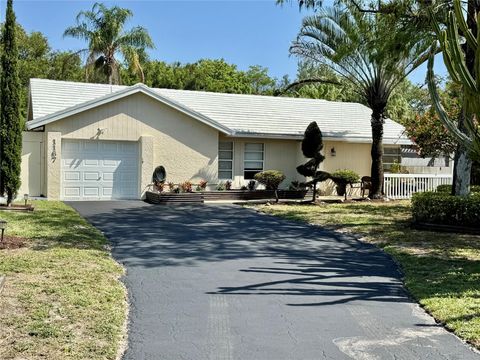
Active
$619,900
3
bds
|
2
ba
|
1,657
sqft
|
built
1982
10842 NW 15th St, Coral Springs, FL 33071
$-1,239
Cash flow
-10.4%
Cash-on-Cash Return
3.7%
Cap rate
0.6%
Rent to Value Ratio
Active
$570,000
3
bds
|
2
ba
|
1,610
sqft
|
built
1973
10655 NW 42nd Dr, Coral Springs, FL 33065
$-1,171
Cash flow
-10.7%
Cash-on-Cash Return
3.7%
Cap rate
0.6%
Rent to Value Ratio
Active
$714,999
4
bds
|
2
ba
|
2,188
sqft
|
built
2000
5445 NW 122nd Dr, Coral Springs, FL 33076
$-950
Cash flow
-6.9%
Cash-on-Cash Return
4.6%
Cap rate
0.7%
Rent to Value Ratio
Active
$690,000
4
bds
|
2
ba
|
2,131
sqft
|
built
1986
3985 NW 73rd Way, Coral Springs, FL 33065
$-720
Cash flow
-5.4%
Cash-on-Cash Return
4.9%
Cap rate
0.7%
Rent to Value Ratio
Active
$235,000
2
bds
|
1
ba
|
980
sqft
|
built
1988
833 Riverside Dr, Coral Springs, FL 33071
$-533
Cash flow
-11.8%
Cash-on-Cash Return
3.4%
Cap rate
0.9%
Rent to Value Ratio

Active
$1,050,000
6
bds
|
3
ba
|
3,210
sqft
|
built
1998
11913 NW 11th Ct, Coral Springs, FL 33071
$-1,915
Cash flow
-9.5%
Cash-on-Cash Return
4.0%
Cap rate
0.8%
Rent to Value Ratio

Active
$685,000
4
bds
|
2
ba
|
1,947
sqft
|
built
1976
1500 NW 85th Dr, Coral Springs, FL 33071
$-697
Cash flow
-5.3%
Cash-on-Cash Return
4.9%
Cap rate
0.7%
Rent to Value Ratio

Active
$830,000
4
bds
|
2
ba
|
0
sqft
|
built
1984
4029 NW 72nd Ave, Coral Springs, FL 33065
$-2,203
Cash flow
-13.8%
Cash-on-Cash Return
3.0%
Cap rate
0.5%
Rent to Value Ratio

Active
$299,900
3
bds
|
2
ba
|
1,166
sqft
|
built
2005
8977 Wiles Rd, Coral Springs, FL 33067
$-1,108
Cash flow
-19.3%
Cash-on-Cash Return
1.7%
Cap rate
0.8%
Rent to Value Ratio
Active
$709,900
4
bds
|
3
ba
|
1,935
sqft
|
built
1973
8438 NW 26th Dr, Coral Springs, FL 33065
$-1,549
Cash flow
-11.4%
Cash-on-Cash Return
3.5%
Cap rate
0.5%
Rent to Value Ratio
Active
$734,900
3
bds
|
3
ba
|
2,210
sqft
|
built
2021
3851 NW 87th Way, Coral Springs, FL 33065
$-1,744
Cash flow
-12.4%
Cash-on-Cash Return
3.3%
Cap rate
0.6%
Rent to Value Ratio
Active
$875,000
5
bds
|
3
ba
|
2,564
sqft
|
built
1989
4111 NW 83rd Ln, Coral Springs, FL 33065
$-2,210
Cash flow
-13.2%
Cash-on-Cash Return
3.1%
Cap rate
0.5%
Rent to Value Ratio

Active
$230,000
2
bds
|
2
ba
|
737
sqft
|
built
1982
3586 N University Dr, Coral Springs, FL 33065
$-618
Cash flow
-14.0%
Cash-on-Cash Return
2.9%
Cap rate
0.9%
Rent to Value Ratio
Active
$305,000
3
bds
|
2
ba
|
1,330
sqft
|
built
1974
8411 Forest Hills Dr, Coral Springs, FL 33065
$-652
Cash flow
-11.2%
Cash-on-Cash Return
3.6%
Cap rate
0.8%
Rent to Value Ratio

Active
$799,999
4
bds
|
2
ba
|
2,415
sqft
|
built
1982
9703 NW 20th St, Coral Springs, FL 33071
$-2,000
Cash flow
-13.0%
Cash-on-Cash Return
3.1%
Cap rate
0.5%
Rent to Value Ratio
Active
$265,000
2
bds
|
2
ba
|
1,218
sqft
|
built
1981
9552 SW 1st Ct, Coral Springs, FL 33071
$-683
Cash flow
-13.4%
Cash-on-Cash Return
3.1%
Cap rate
0.8%
Rent to Value Ratio
Active
$799,000
4
bds
|
3
ba
|
2,555
sqft
|
built
1984
11217 NW 10th Mnr, Coral Springs, FL 33071
$-1,961
Cash flow
-12.8%
Cash-on-Cash Return
3.2%
Cap rate
0.5%
Rent to Value Ratio
Active
$630,000
3
bds
|
2
ba
|
1,767
sqft
|
built
1972
4125 NW 78th Ln, Coral Springs, FL 33065
$-1,194
Cash flow
-9.9%
Cash-on-Cash Return
3.9%
Cap rate
0.5%
Rent to Value Ratio
Active
$500,000
3
bds
|
2
ba
|
1,202
sqft
|
built
1977
1167 NW 90th Ln, Coral Springs, FL 33071
$-1,427
Cash flow
-14.9%
Cash-on-Cash Return
2.7%
Cap rate
0.6%
Rent to Value Ratio
Active
$750,000
3
bds
|
2
ba
|
2,086
sqft
|
built
1994
11972 Glenmore Dr, Coral Springs, FL 33071
$-2,365
Cash flow
-16.5%
Cash-on-Cash Return
2.4%
Cap rate
0.6%
Rent to Value Ratio
Active
$210,000
2
bds
|
2
ba
|
1,068
sqft
|
built
1974
8411 Forest Hills Dr, Coral Springs, FL 33065
$-289
Cash flow
-7.2%
Cash-on-Cash Return
4.5%
Cap rate
1.0%
Rent to Value Ratio
Active
$725,000
3
bds
|
2
ba
|
2,073
sqft
|
built
1976
11886 NW 24th St, Coral Springs, FL 33065
$-688
Cash flow
-5.0%
Cash-on-Cash Return
5.0%
Cap rate
0.7%
Rent to Value Ratio
Active
$189,995
1
bds
|
1
ba
|
816
sqft
|
built
1987
1146 Coral Club Dr, Coral Springs, FL 33071
$-464
Cash flow
-12.7%
Cash-on-Cash Return
3.2%
Cap rate
0.9%
Rent to Value Ratio
Active
$840,000
4
bds
|
3
ba
|
2,717
sqft
|
built
1997
4927 NW 58th Ave, Coral Springs, FL 33067
$-1,785
Cash flow
-11.1%
Cash-on-Cash Return
3.6%
Cap rate
0.6%
Rent to Value Ratio
Active
$534,900
3
bds
|
2
ba
|
1,532
sqft
|
built
2001
11955 NW 57th Mnr, Coral Springs, FL 33076
$-852
Cash flow
-8.3%
Cash-on-Cash Return
4.2%
Cap rate
0.7%
Rent to Value Ratio
Active
$710,000
4
bds
|
2
ba
|
2,237
sqft
|
built
1978
453 NW 101st Ave, Coral Springs, FL 33071
$-1,001
Cash flow
-7.4%
Cash-on-Cash Return
4.5%
Cap rate
0.7%
Rent to Value Ratio

Active
$750,000
4
bds
|
2
ba
|
1,854
sqft
|
built
1995
5708 NW 47th Ct, Coral Springs, FL 33067
$-1,354
Cash flow
-9.4%
Cash-on-Cash Return
4.0%
Cap rate
0.6%
Rent to Value Ratio

Active
$700,000
4
bds
|
3
ba
|
2,207
sqft
|
built
1998
5552 NW 125th Ter, Coral Springs, FL 33076
$-1,492
Cash flow
-11.1%
Cash-on-Cash Return
3.6%
Cap rate
0.6%
Rent to Value Ratio

Active
$195,000
2
bds
|
2
ba
|
768
sqft
|
built
1982
9909 Twin Lakes Dr, Coral Springs, FL 33071
$-637
Cash flow
-17.0%
Cash-on-Cash Return
2.2%
Cap rate
0.9%
Rent to Value Ratio

Active
$849,500
5
bds
|
3
ba
|
2,573
sqft
|
built
1993
4647 NW 98th Ln, Coral Springs, FL 33076
$-1,257
Cash flow
-7.7%
Cash-on-Cash Return
4.4%
Cap rate
0.7%
Rent to Value Ratio
Active
$550,000
3
bds
|
2
ba
|
1,930
sqft
|
built
1988
2544 NW 95th Ter, Coral Springs, FL 33065
$-1,201
Cash flow
-11.4%
Cash-on-Cash Return
3.5%
Cap rate
0.7%
Rent to Value Ratio
Active
$925,000
5
bds
|
4
ba
|
3,513
sqft
|
built
1986
3220 NW 107th Ave, Coral Springs, FL 33065
$-1,896
Cash flow
-10.7%
Cash-on-Cash Return
3.7%
Cap rate
0.5%
Rent to Value Ratio
Active
$204,999
2
bds
|
2
ba
|
1,050
sqft
|
built
1979
8821 NW 38th Dr, Coral Springs, FL 33065
$-553
Cash flow
-14.1%
Cash-on-Cash Return
2.9%
Cap rate
1.0%
Rent to Value Ratio