Coral Springs, FL Investment Properties for Sale
Browse homes for sale and investment properties in Coral Springs, FL. Refine your search by price, property type, or more.
Best cash flowing properties in Coral Springs, FL
Active
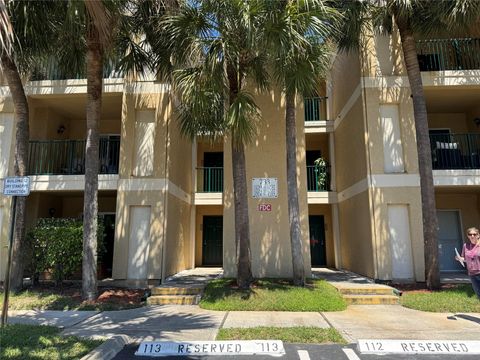
$174,900
1
bds
|
1
ba
|
780
sqft
|
built
1987
733 Riverside Dr, Coral Springs, FL 33071
$-298
Cash flow
-8.9%
Cash-on-Cash Return
4.1%
Cap rate
1.0%
Rent to Value Ratio
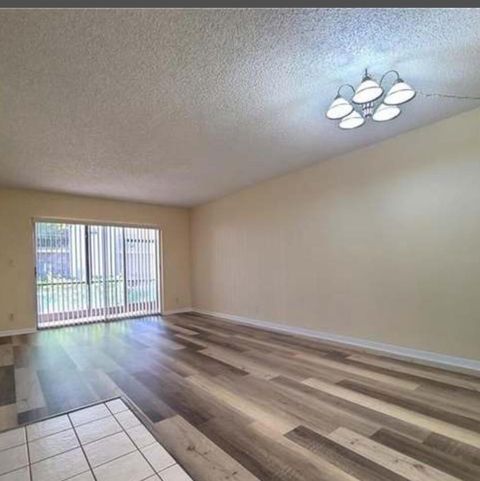
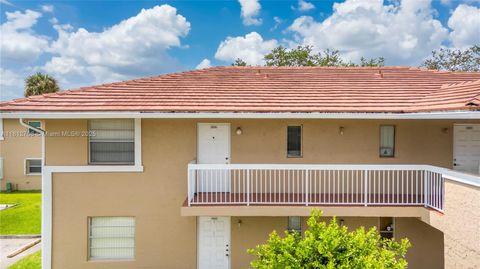
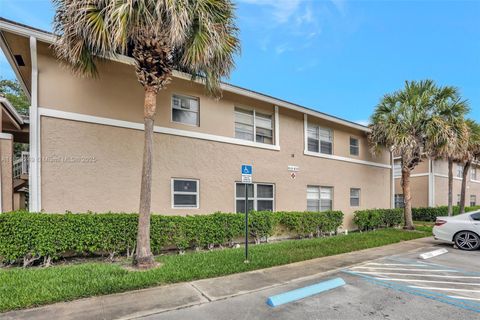
Active
$206,000
2
bds
|
1
ba
|
850
sqft
|
built
1979
4155 NW 90th Ave, Coral Springs, FL 33065
$-319
Cash flow
-8.1%
Cash-on-Cash Return
4.3%
Cap rate
0.9%
Rent to Value Ratio
614 out of 718 properties for sale in Coral Springs, FL
Limited Results Shown
Create a free account, or log in to reveal all property listings and enjoy the complete experience.
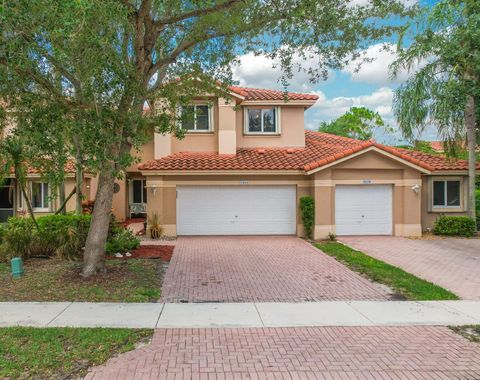
Active
$829,000
4
bds
|
2
ba
|
2,157
sqft
|
built
1979
1911 NW 107th Dr, Coral Springs, FL 33071
$-1,842
Cash flow
-11.6%
Cash-on-Cash Return
3.5%
Cap rate
0.5%
Rent to Value Ratio

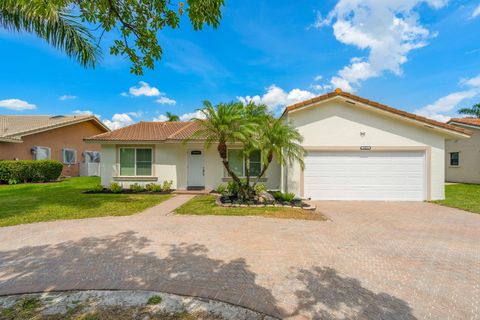
Active
$279,000
3
bds
|
2
ba
|
1,273
sqft
|
built
1990
9144 W Atlantic Blvd, Coral Springs, FL 33071
$-416
Cash flow
-7.8%
Cash-on-Cash Return
4.4%
Cap rate
0.9%
Rent to Value Ratio
Active
$549,900
3
bds
|
3
ba
|
2,048
sqft
|
built
2000
5664 NW 125th Ave, Coral Springs, FL 33076
$-1,393
Cash flow
-13.2%
Cash-on-Cash Return
3.1%
Cap rate
0.7%
Rent to Value Ratio
Active
$167,999
2
bds
|
2
ba
|
768
sqft
|
built
1982
9906 Twin Lakes Dr, Coral Springs, FL 33071
$-496
Cash flow
-15.4%
Cash-on-Cash Return
2.6%
Cap rate
1.1%
Rent to Value Ratio
Active
$174,900
1
bds
|
1
ba
|
780
sqft
|
built
1987
733 Riverside Dr, Coral Springs, FL 33071
$-298
Cash flow
-8.9%
Cash-on-Cash Return
4.1%
Cap rate
1.0%
Rent to Value Ratio
Active
$335,000
2
bds
|
3
ba
|
1,203
sqft
|
built
2003
6500 W Sample Rd, Coral Springs, FL 33067
$-958
Cash flow
-14.9%
Cash-on-Cash Return
2.7%
Cap rate
0.7%
Rent to Value Ratio
Active
$849,000
bds
|
0
ba
|
3,130
sqft
|
built
1974
4301 NW 110th Ave, Coral Springs, FL 33065
$-3,427
Cash flow
-21.1%
Cash-on-Cash Return
1.3%
Cap rate
0.3%
Rent to Value Ratio

Active
$621,000
3
bds
|
3
ba
|
1,508
sqft
|
built
2023
11965 NW 47th Mnr, Coral Springs, FL 33076
$-1,773
Cash flow
-14.9%
Cash-on-Cash Return
2.7%
Cap rate
0.6%
Rent to Value Ratio
Active
$230,000
2
bds
|
2
ba
|
1,000
sqft
|
built
1987
875 Riverside Dr, Coral Springs, FL 33071
$-814
Cash flow
-18.5%
Cash-on-Cash Return
1.9%
Cap rate
0.9%
Rent to Value Ratio
Active
$185,000
2
bds
|
2
ba
|
768
sqft
|
built
1982
826 Twin Lakes Dr, Coral Springs, FL 33071
$-603
Cash flow
-17.0%
Cash-on-Cash Return
2.2%
Cap rate
1.0%
Rent to Value Ratio
Active
$1,698,800
5
bds
|
5
ba
|
3,637
sqft
|
built
1997
6238 NW 120th Dr, Coral Springs, FL 33076
$-6,546
Cash flow
-20.1%
Cash-on-Cash Return
1.5%
Cap rate
0.3%
Rent to Value Ratio
Active
$273,500
2
bds
|
2
ba
|
850
sqft
|
built
1990
9901 Westview Dr, Coral Springs, FL 33076
$-604
Cash flow
-11.5%
Cash-on-Cash Return
3.5%
Cap rate
0.8%
Rent to Value Ratio
Active
$830,000
4
bds
|
2
ba
|
2,386
sqft
|
built
1984
10859 NW 14th St, Coral Springs, FL 33071
$-1,589
Cash flow
-10.0%
Cash-on-Cash Return
3.9%
Cap rate
0.5%
Rent to Value Ratio
Active
$899,000
5
bds
|
3
ba
|
2,934
sqft
|
built
1979
9919 SW 1st Ct, Coral Springs, FL 33071
$-2,247
Cash flow
-13.0%
Cash-on-Cash Return
3.1%
Cap rate
0.5%
Rent to Value Ratio
Active
$584,999
3
bds
|
3
ba
|
1,772
sqft
|
built
1994
8785 NW 6th St, Coral Springs, FL 33071
$-1,535
Cash flow
-13.7%
Cash-on-Cash Return
3.0%
Cap rate
0.6%
Rent to Value Ratio
Active
$179,000
2
bds
|
2
ba
|
1,030
sqft
|
built
1974
10762 La Placida Dr, Coral Springs, FL 33065
$-417
Cash flow
-12.2%
Cash-on-Cash Return
3.4%
Cap rate
1.1%
Rent to Value Ratio
Active
$278,000
3
bds
|
2
ba
|
1,250
sqft
|
built
1975
2500 Coral Springs Dr, Coral Springs, FL 33065
$-837
Cash flow
-15.7%
Cash-on-Cash Return
2.5%
Cap rate
0.8%
Rent to Value Ratio

Active
$775,000
4
bds
|
2
ba
|
2,295
sqft
|
built
1995
6631 NW 41st St, Coral Springs, FL 33067
$-1,713
Cash flow
-11.5%
Cash-on-Cash Return
3.5%
Cap rate
0.6%
Rent to Value Ratio
Active
$540,000
3
bds
|
4
ba
|
1,538
sqft
|
built
2007
6072 NW 116th Dr, Coral Springs, FL 33076
$-1,656
Cash flow
-16.0%
Cash-on-Cash Return
2.5%
Cap rate
0.7%
Rent to Value Ratio
Active
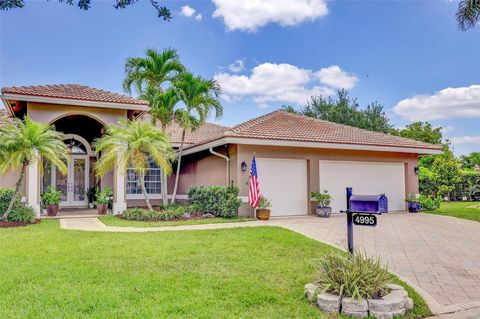
$989,999
6
bds
|
3
ba
|
2,617
sqft
|
built
1995
4995 NW 110th Ter, Coral Springs, FL 33076
$-2,023
Cash flow
-10.7%
Cash-on-Cash Return
3.7%
Cap rate
0.6%
Rent to Value Ratio
Active
$919,995
5
bds
|
4
ba
|
2,413
sqft
|
built
1991
1750 NW 127th Way, Coral Springs, FL 33071
$-2,412
Cash flow
-13.7%
Cash-on-Cash Return
3.0%
Cap rate
0.6%
Rent to Value Ratio
Active
$850,000
4
bds
|
3
ba
|
2,402
sqft
|
built
1994
5362 NW 108th Way, Coral Springs, FL 33076
$-1,908
Cash flow
-11.7%
Cash-on-Cash Return
3.5%
Cap rate
0.6%
Rent to Value Ratio

Active
$775,000
4
bds
|
3
ba
|
2,557
sqft
|
built
2001
5764 NW 125th Ter, Coral Springs, FL 33076
$-1,621
Cash flow
-10.9%
Cash-on-Cash Return
3.6%
Cap rate
0.6%
Rent to Value Ratio
Active
$849,000
4
bds
|
3
ba
|
2,667
sqft
|
built
1981
1988 NW 112th Ave, Coral Springs, FL 33071
$-2,141
Cash flow
-13.2%
Cash-on-Cash Return
3.1%
Cap rate
0.5%
Rent to Value Ratio

Active
$929,900
5
bds
|
5
ba
|
3,281
sqft
|
built
1998
346 NW 118th Ave, Coral Springs, FL 33071
$-2,701
Cash flow
-15.2%
Cash-on-Cash Return
2.7%
Cap rate
0.5%
Rent to Value Ratio
Active
$947,500
4
bds
|
3
ba
|
3,038
sqft
|
built
1999
5957 NW 125th Ave, Coral Springs, FL 33076
$-2,309
Cash flow
-12.7%
Cash-on-Cash Return
3.2%
Cap rate
0.6%
Rent to Value Ratio

Active
$365,000
3
bds
|
3
ba
|
1,170
sqft
|
built
1997
9808 NW 56th Pl, Coral Springs, FL 33076
$-885
Cash flow
-12.7%
Cash-on-Cash Return
3.2%
Cap rate
0.7%
Rent to Value Ratio
Active
$805,000
4
bds
|
3
ba
|
2,596
sqft
|
built
1996
11876 NW 55th St, Coral Springs, FL 33076
$-1,905
Cash flow
-12.3%
Cash-on-Cash Return
3.3%
Cap rate
0.5%
Rent to Value Ratio
Active
$949,000
5
bds
|
4
ba
|
2,787
sqft
|
built
1989
1943 Hartford Way, Coral Springs, FL 33071
$-3,357
Cash flow
-18.5%
Cash-on-Cash Return
1.9%
Cap rate
0.5%
Rent to Value Ratio

Active
$874,500
6
bds
|
3
ba
|
3,082
sqft
|
built
1999
10730 NW 56th Ct, Coral Springs, FL 33076
$-1,274
Cash flow
-7.6%
Cash-on-Cash Return
4.4%
Cap rate
0.7%
Rent to Value Ratio
Active
$195,000
2
bds
|
2
ba
|
1,030
sqft
|
built
1974
10772 La Placida Dr, Coral Springs, FL 33065
$-515
Cash flow
-13.8%
Cash-on-Cash Return
3.0%
Cap rate
1.0%
Rent to Value Ratio

Active
$179,000
2
bds
|
2
ba
|
1,000
sqft
|
built
1975
8605 W Sample Rd, Coral Springs, FL 33065
$-555
Cash flow
-16.2%
Cash-on-Cash Return
2.4%
Cap rate
1.1%
Rent to Value Ratio
Active
$225,000
2
bds
|
2
ba
|
835
sqft
|
built
1988
11496 NW 43rd St, Coral Springs, FL 33065
$-628
Cash flow
-14.6%
Cash-on-Cash Return
2.8%
Cap rate
0.8%
Rent to Value Ratio
Active
$849,999
4
bds
|
3
ba
|
2,291
sqft
|
built
1992
4723 NW 100th Ter, Coral Springs, FL 33076
$-1,763
Cash flow
-10.8%
Cash-on-Cash Return
3.7%
Cap rate
0.5%
Rent to Value Ratio

Active
$660,000
4
bds
|
2
ba
|
2,388
sqft
|
built
1993
5407 NW 107th Ave, Coral Springs, FL 33076
$-1,077
Cash flow
-8.5%
Cash-on-Cash Return
4.2%
Cap rate
0.7%
Rent to Value Ratio
Active
$829,000
4
bds
|
3
ba
|
2,678
sqft
|
built
1985
8924 NW 47th Ct, Coral Springs, FL 33067
$-1,877
Cash flow
-11.8%
Cash-on-Cash Return
3.4%
Cap rate
0.6%
Rent to Value Ratio
Active
$219,000
3
bds
|
2
ba
|
1,055
sqft
|
built
2003
2901 Riverside Dr, Coral Springs, FL 33065
$-438
Cash flow
-10.4%
Cash-on-Cash Return
3.7%
Cap rate
1.1%
Rent to Value Ratio

Active
$749,000
4
bds
|
3
ba
|
2,601
sqft
|
built
1977
10301 NW 16th Ct, Coral Springs, FL 33071
$-1,430
Cash flow
-10.0%
Cash-on-Cash Return
3.9%
Cap rate
0.6%
Rent to Value Ratio
Active
$535,000
3
bds
|
2
ba
|
1,660
sqft
|
built
1994
6382 NW 38th Dr, Coral Springs, FL 33067
$-1,100
Cash flow
-10.7%
Cash-on-Cash Return
3.7%
Cap rate
0.6%
Rent to Value Ratio
Active
$206,000
2
bds
|
1
ba
|
850
sqft
|
built
1979
4155 NW 90th Ave, Coral Springs, FL 33065
$-319
Cash flow
-8.1%
Cash-on-Cash Return
4.3%
Cap rate
0.9%
Rent to Value Ratio