Covington, LA Investment Properties for Sale
Browse homes for sale and investment properties in Covington, LA. Refine your search by price, property type, or more.
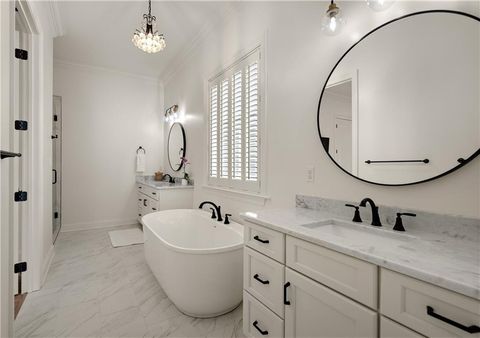
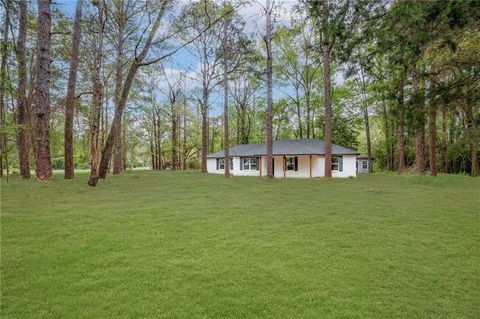
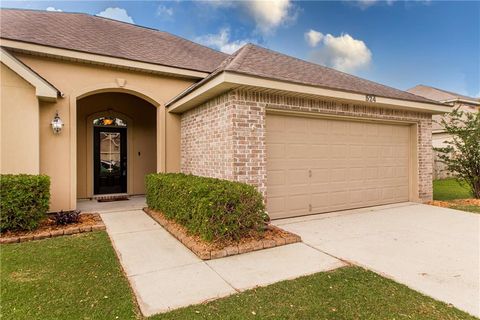
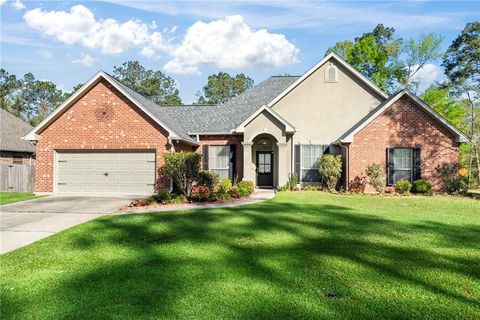
Best cash flowing properties in Covington, LA
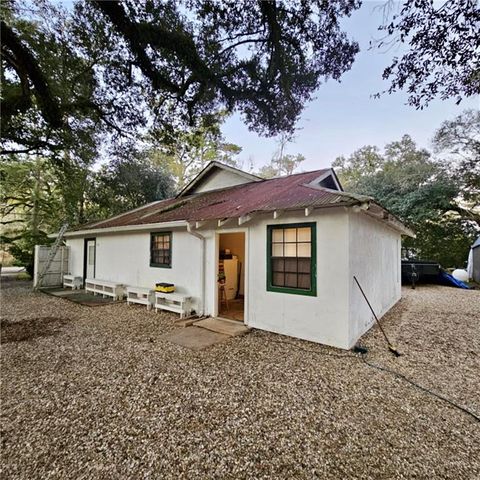
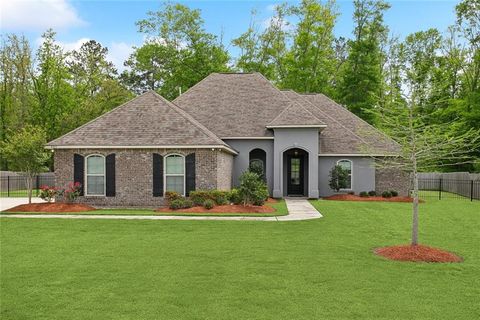
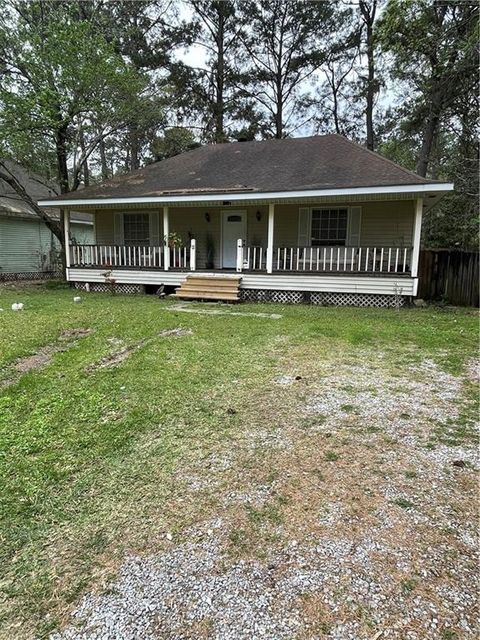
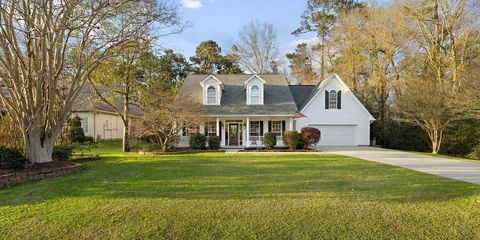
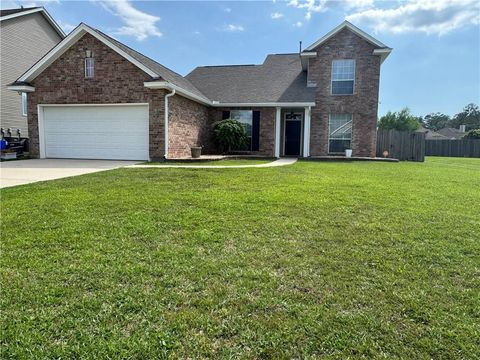
Active
$168,000
3
bds
|
2
ba
|
2,100
sqft
|
built
1950
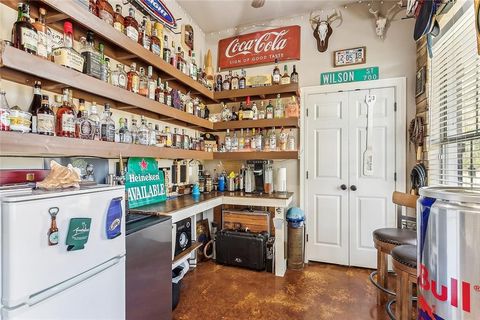
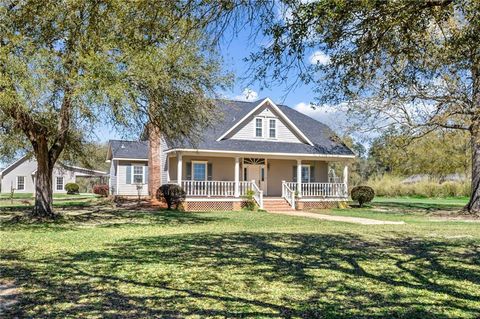
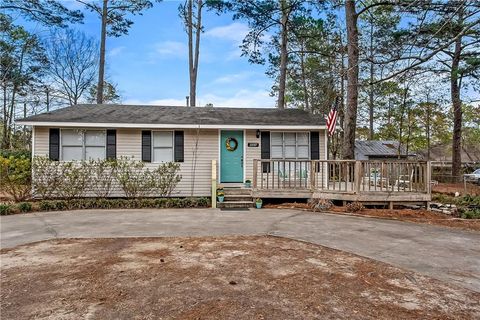
71349 Ruby St, Covington, LA 70433
$723
Cash flow
22.5%
Cash-on-Cash Return
10.8%
Cap rate
1.3%
Rent to Value Ratio
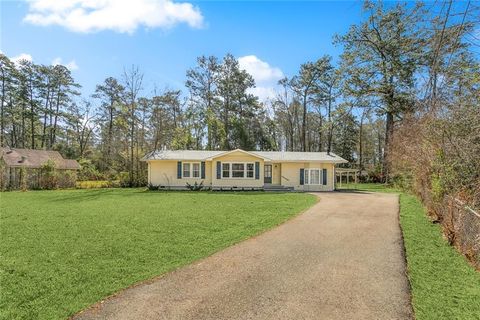
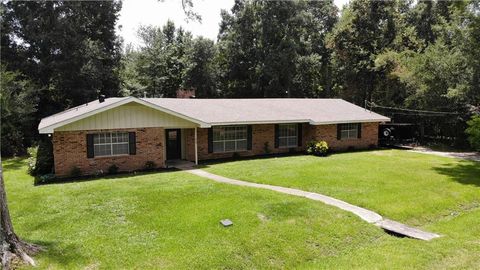
Active
$255,000
3
bds
|
2
ba
|
1,500
sqft
|
built
1974
72462 Wilkinson St, Covington, LA 70435
$311
Cash flow
6.4%
Cash-on-Cash Return
7.1%
Cap rate
0.9%
Rent to Value Ratio
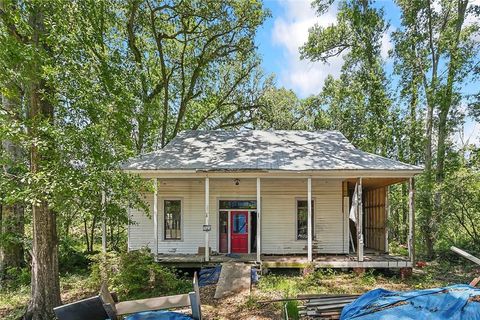
254 out of 301 properties for sale in Covington, LA
Limited Results Shown
Create a free account, or log in to reveal all property listings and enjoy the complete experience.
Active
$229,000
3
bds
|
2
ba
|
1,540
sqft
|
built
2001
70281 7th St, Covington, LA 70433
$296
Cash flow
6.7%
Cash-on-Cash Return
7.2%
Cap rate
0.9%
Rent to Value Ratio
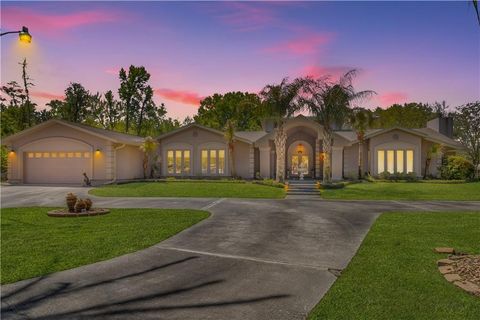
Active
$2,150,000
5
bds
|
6
ba
|
4,743
sqft
|
built
2005
73125 Military Rd, Covington, LA 70435
$-7,069
Cash flow
-17.2%
Cash-on-Cash Return
1.7%
Cap rate
0.2%
Rent to Value Ratio
Active
$433,000
4
bds
|
3
ba
|
2,343
sqft
|
built
2019
335 Saw Grass Loop, Covington, LA 70435
$7
Cash flow
0.1%
Cash-on-Cash Return
5.7%
Cap rate
0.7%
Rent to Value Ratio
Active
$284,000
3
bds
|
3
ba
|
2,262
sqft
|
built
2006
724 Simpson Way, Covington, LA 70435
$67
Cash flow
1.2%
Cash-on-Cash Return
6.0%
Cap rate
0.7%
Rent to Value Ratio
Active
$540,000
4
bds
|
3
ba
|
2,309
sqft
|
built
2023
456 Cottonwood Creek Ln, Covington, LA 70433
$61
Cash flow
0.6%
Cash-on-Cash Return
5.8%
Cap rate
0.7%
Rent to Value Ratio
Active
$338,000
3
bds
|
2
ba
|
1,925
sqft
|
built
2024
1421 Zachery Court, Covington, LA 70435
$0
Cash flow
n/a
Cash-on-Cash Return
n/a
Cap rate
n/a
Rent to Value Ratio
Active
$660,000
3
bds
|
3
ba
|
2,541
sqft
|
built
2022
521 Melrose Ave, Covington, LA 70433
$-488
Cash flow
-3.9%
Cash-on-Cash Return
4.8%
Cap rate
0.6%
Rent to Value Ratio
Active
$229,000
5
bds
|
2
ba
|
1,749
sqft
|
built
1985
21216 Gardenia St, Covington, LA 70435
$20
Cash flow
0.5%
Cash-on-Cash Return
5.8%
Cap rate
0.7%
Rent to Value Ratio
Active
$288,000
3
bds
|
2
ba
|
1,750
sqft
|
built
2014
524 Jessica Way, Covington, LA 70435
$107
Cash flow
1.9%
Cash-on-Cash Return
6.1%
Cap rate
0.8%
Rent to Value Ratio

Active
$550,000
4
bds
|
3
ba
|
3,126
sqft
|
built
1933
20490 Johnsen Crossing, Covington, LA 70435
$0
Cash flow
n/a
Cash-on-Cash Return
n/a
Cap rate
n/a
Rent to Value Ratio
Active
$380,000
4
bds
|
2
ba
|
2,269
sqft
|
built
2005
301 Clover Meadow Dr, Covington, LA 70433
$-211
Cash flow
-2.9%
Cash-on-Cash Return
5.0%
Cap rate
0.6%
Rent to Value Ratio
Active
$215,000
3
bds
|
2
ba
|
1,480
sqft
|
built
1988
70319 L St, Covington, LA 70433
$225
Cash flow
5.5%
Cash-on-Cash Return
6.9%
Cap rate
0.8%
Rent to Value Ratio
Active
$235,000
3
bds
|
2
ba
|
1,500
sqft
|
built
2004
70312 G St, Covington, LA 70433
$130
Cash flow
2.9%
Cash-on-Cash Return
6.3%
Cap rate
0.8%
Rent to Value Ratio
Active
$478,900
4
bds
|
4
ba
|
2,600
sqft
|
built
1976
156 Belle Terre Blvd, Covington, LA 70433
$-908
Cash flow
-9.9%
Cash-on-Cash Return
3.4%
Cap rate
0.4%
Rent to Value Ratio
Active
$235,000
3
bds
|
2
ba
|
1,369
sqft
|
built
2003
70296 F St, Covington, LA 70433
$130
Cash flow
2.9%
Cash-on-Cash Return
6.3%
Cap rate
0.8%
Rent to Value Ratio
Active
$545,000
4
bds
|
3
ba
|
2,550
sqft
|
built
2009
86141 Highway 437, Covington, LA 70435
$-440
Cash flow
-4.2%
Cash-on-Cash Return
4.7%
Cap rate
0.6%
Rent to Value Ratio
Active
$426,000
3
bds
|
2
ba
|
1,428
sqft
|
built
1976
1612 Mossy St, Covington, LA 70433
$-774
Cash flow
-9.5%
Cash-on-Cash Return
3.5%
Cap rate
0.4%
Rent to Value Ratio
Active
$499,900
5
bds
|
3
ba
|
2,796
sqft
|
built
2006
207 Thornwood Dr, Covington, LA 70435
$-432
Cash flow
-4.5%
Cash-on-Cash Return
4.6%
Cap rate
0.6%
Rent to Value Ratio
Active
$315,000
3
bds
|
2
ba
|
1,675
sqft
|
built
1994
313 E 7th Ave, Covington, LA 70433
$27
Cash flow
0.4%
Cash-on-Cash Return
5.8%
Cap rate
0.7%
Rent to Value Ratio
Active
$634,500
3
bds
|
4
ba
|
3,323
sqft
|
built
1984
17577 Million Dollar Rd, Covington, LA 70435
$-588
Cash flow
-4.8%
Cash-on-Cash Return
4.6%
Cap rate
0.6%
Rent to Value Ratio
Active
$693,500
3
bds
|
4
ba
|
2,523
sqft
|
built
2014
700 Cottage Ln, Covington, LA 70433
$-751
Cash flow
-5.6%
Cash-on-Cash Return
4.4%
Cap rate
0.6%
Rent to Value Ratio
Active
$1,465,000
5
bds
|
7
ba
|
4,626
sqft
|
built
2020
1633 Ox Bow Ln, Covington, LA 70433
$-875
Cash flow
-3.1%
Cash-on-Cash Return
5.0%
Cap rate
0.6%
Rent to Value Ratio
Active
$384,000
3
bds
|
2
ba
|
2,045
sqft
|
built
1997
403 Avenue Palais Royal, Covington, LA 70433
$-58
Cash flow
-0.8%
Cash-on-Cash Return
5.5%
Cap rate
0.7%
Rent to Value Ratio
Active
$199,000
4
bds
|
2
ba
|
1,470
sqft
|
built
1977
20087 Quincy Ave, Covington, LA 70433
$231
Cash flow
6.1%
Cash-on-Cash Return
7.1%
Cap rate
0.9%
Rent to Value Ratio
Active
$1,395,000
4
bds
|
4
ba
|
4,543
sqft
|
built
1980
17239 Three Rivers Rd, Covington, LA 70433
$-1,772
Cash flow
-6.6%
Cash-on-Cash Return
4.2%
Cap rate
0.5%
Rent to Value Ratio
Active
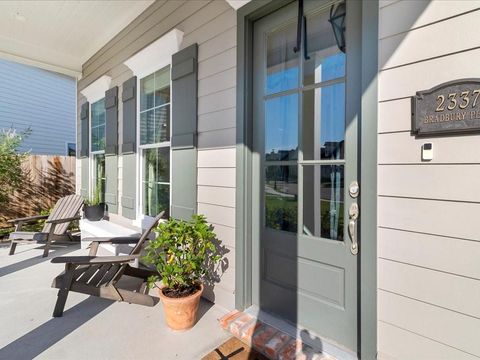
$449,500
4
bds
|
3
ba
|
2,517
sqft
|
built
2022
2337 Bradbury Pl, Covington, LA 70433
$257
Cash flow
3.0%
Cash-on-Cash Return
6.4%
Cap rate
0.8%
Rent to Value Ratio
Active
$659,000
5
bds
|
3
ba
|
3,167
sqft
|
built
2000
22 Wishing Well Ct, Covington, LA 70433
$-1,018
Cash flow
-8.1%
Cash-on-Cash Return
3.8%
Cap rate
0.5%
Rent to Value Ratio
Active
$475,000
4
bds
|
4
ba
|
2,812
sqft
|
built
1999
916 Avenue Du Chateau, Covington, LA 70433
$-144
Cash flow
-1.6%
Cash-on-Cash Return
5.3%
Cap rate
0.7%
Rent to Value Ratio
Active
$398,900
4
bds
|
3
ba
|
2,715
sqft
|
built
1979
309 E 5th Ave, Covington, LA 70433
$-163
Cash flow
-2.1%
Cash-on-Cash Return
5.2%
Cap rate
0.6%
Rent to Value Ratio
Active
$150,000
3
bds
|
1
ba
|
1,600
sqft
|
built
1922
19411 Jenkins Ave, Covington, LA 70433
$256
Cash flow
8.9%
Cash-on-Cash Return
7.7%
Cap rate
0.9%
Rent to Value Ratio

Active
$1,900,000
4
bds
|
5
ba
|
4,696
sqft
|
built
1895
605 S America St, Covington, LA 70433
$-6,024
Cash flow
-16.5%
Cash-on-Cash Return
1.9%
Cap rate
0.2%
Rent to Value Ratio
Active
$235,000
2
bds
|
2
ba
|
968
sqft
|
built
2004
411 W 11th Ave, Covington, LA 70433
$-8
Cash flow
-0.2%
Cash-on-Cash Return
5.6%
Cap rate
0.7%
Rent to Value Ratio
Active
$288,000
3
bds
|
2
ba
|
1,508
sqft
|
built
2022
20051 Linden St, Covington, LA 70435
$224
Cash flow
4.1%
Cash-on-Cash Return
6.6%
Cap rate
0.8%
Rent to Value Ratio
Active
$430,000
4
bds
|
3
ba
|
2,363
sqft
|
built
1977
108 Bertel Dr, Covington, LA 70433
$-454
Cash flow
-5.5%
Cash-on-Cash Return
4.4%
Cap rate
0.5%
Rent to Value Ratio
Active
$685,000
4
bds
|
3
ba
|
3,265
sqft
|
built
1971
307 W 10th Ave, Covington, LA 70433
$-758
Cash flow
-5.8%
Cash-on-Cash Return
4.4%
Cap rate
0.5%
Rent to Value Ratio
Active
$698,000
4
bds
|
3
ba
|
2,993
sqft
|
built
2006
459 Camden Park Dr, Covington, LA 70435
$-1,162
Cash flow
-8.7%
Cash-on-Cash Return
3.7%
Cap rate
0.5%
Rent to Value Ratio
Active
$318,000
4
bds
|
3
ba
|
2,418
sqft
|
built
2007
533 Moore Blvd, Covington, LA 70433
$199
Cash flow
3.3%
Cash-on-Cash Return
6.4%
Cap rate
0.8%
Rent to Value Ratio
Active
$780,000
3
bds
|
3
ba
|
3,153
sqft
|
built
2017
601 Bocage Ct S, Covington, LA 70433
$-24
Cash flow
-0.2%
Cash-on-Cash Return
5.6%
Cap rate
0.7%
Rent to Value Ratio