Crystal Beach, TX Investment Properties for Sale
Browse homes for sale and investment properties in Crystal Beach, TX. Refine your search by price, property type, or more.
Best cash flowing properties in Crystal Beach, TX
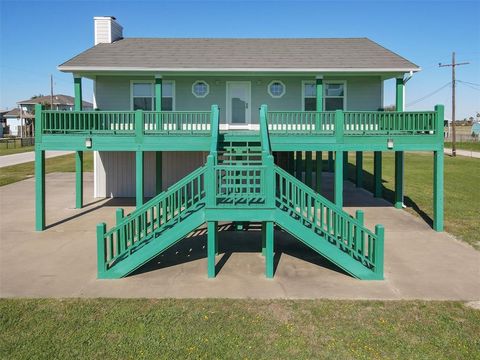
Active
$350,000
3
bds
|
3
ba
|
1,524
sqft
|
built
2010
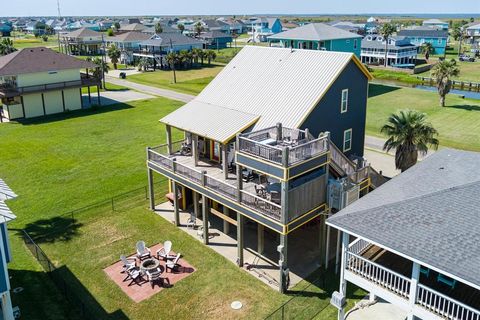
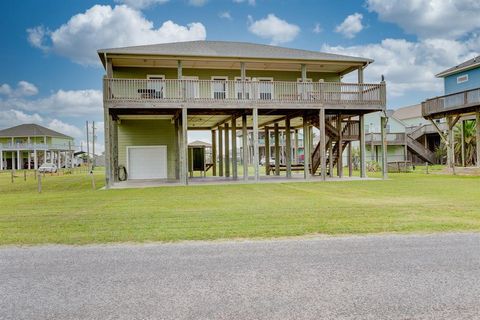
963 Driftwood Dr, Crystal Beach, TX 77650
$-334
Cash flow
-5.0%
Cash-on-Cash Return
4.5%
Cap rate
0.7%
Rent to Value Ratio
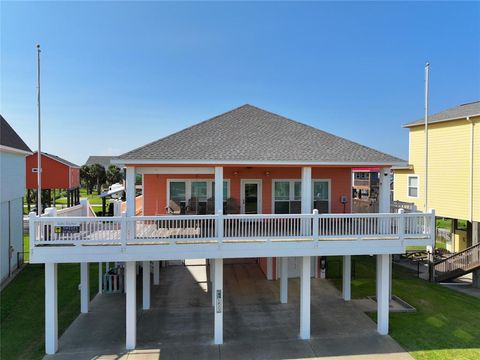
Active
$330,000
3
bds
|
2
ba
|
783
sqft
|
built
1984
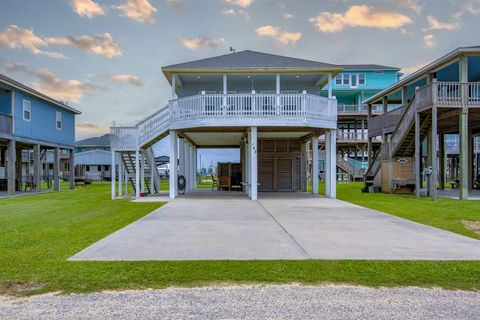
1104 Mayes Rd, Crystal Beach, TX 77650
$-462
Cash flow
-7.3%
Cash-on-Cash Return
4.0%
Cap rate
0.6%
Rent to Value Ratio
133 out of 207 properties for sale in Crystal Beach, TX
Limited Results Shown
Create a free account, or log in to reveal all property listings and enjoy the complete experience.
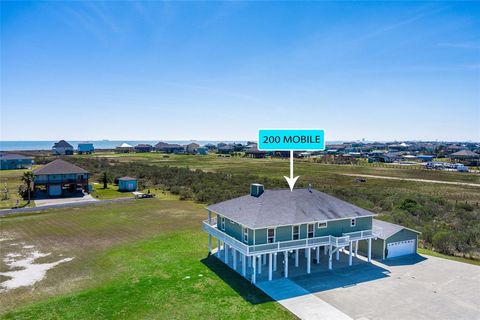
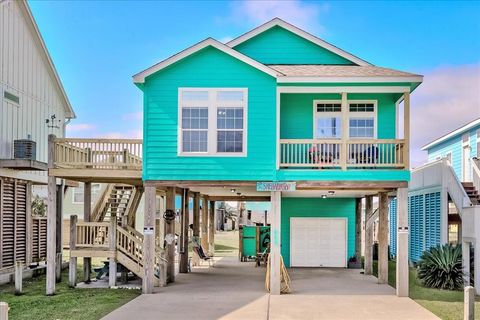
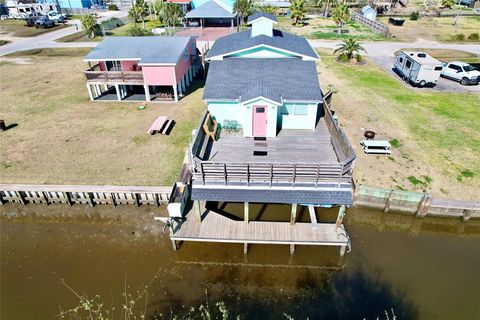
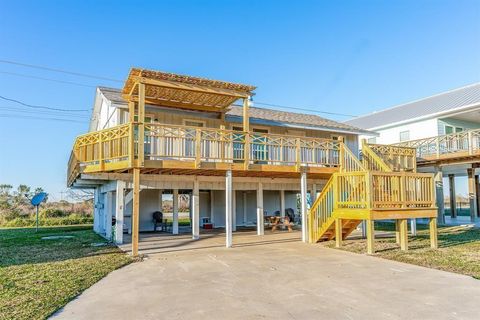
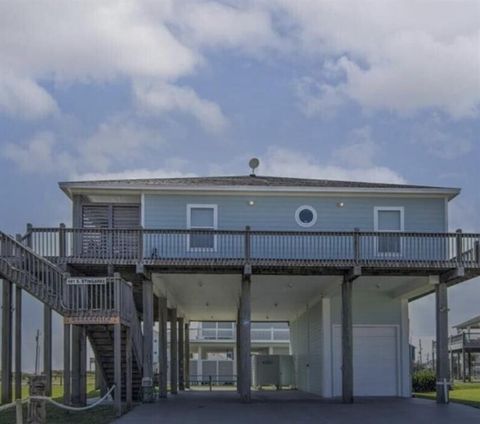
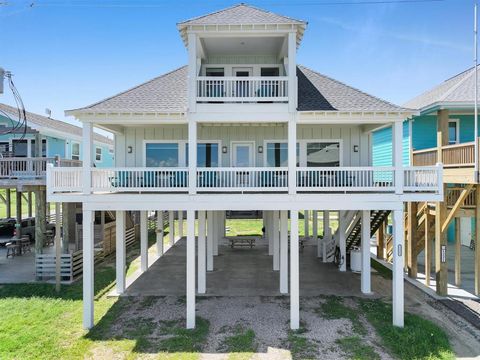
Active
$550,000
4
bds
|
4
ba
|
2,088
sqft
|
built
2003
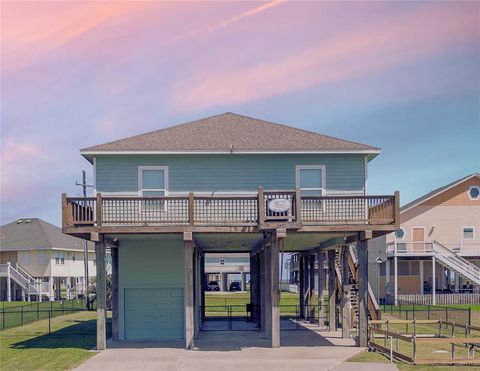
200 Mobile, Crystal Beach, TX 77650
$-951
Cash flow
-9.0%
Cash-on-Cash Return
3.6%
Cap rate
0.6%
Rent to Value Ratio
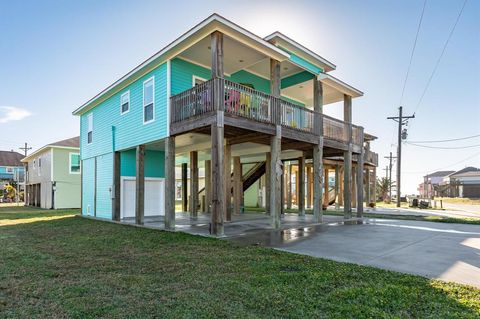
Active
$350,000
3
bds
|
2
ba
|
1,200
sqft
|
built
1993
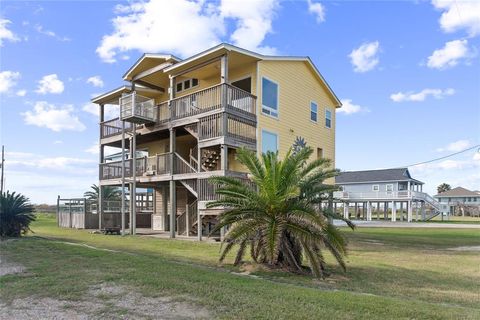
3619 Barracuda, Crystal Beach, TX 77650
$-621
Cash flow
-9.3%
Cash-on-Cash Return
3.5%
Cap rate
0.4%
Rent to Value Ratio
Active
$435,000
3
bds
|
3
ba
|
1,692
sqft
|
built
2004
3101 Diane, Crystal Beach, TX 77650
$-610
Cash flow
-7.3%
Cash-on-Cash Return
4.0%
Cap rate
0.6%
Rent to Value Ratio
Active
$449,000
3
bds
|
2
ba
|
1,240
sqft
|
built
2016
1844 Pompano Ln, Crystal Beach, TX 77650
$-878
Cash flow
-10.2%
Cash-on-Cash Return
3.3%
Cap rate
0.6%
Rent to Value Ratio
Active
$699,999
4
bds
|
4
ba
|
2,051
sqft
|
built
2011
2774 Gulfview Ln, Crystal Beach, TX 77650
$-1,380
Cash flow
-10.3%
Cash-on-Cash Return
3.3%
Cap rate
0.6%
Rent to Value Ratio
Active
$399,900
2
bds
|
2
ba
|
1,160
sqft
|
built
2018
984 Crane Ln, Crystal Beach, TX 77650
$-821
Cash flow
-10.7%
Cash-on-Cash Return
3.2%
Cap rate
0.6%
Rent to Value Ratio

Active
$549,900
4
bds
|
3
ba
|
1,682
sqft
|
built
2004
3341 Prides Way, Crystal Beach, TX 77650
$-774
Cash flow
-7.3%
Cash-on-Cash Return
4.0%
Cap rate
0.6%
Rent to Value Ratio
Active
$415,000
2
bds
|
3
ba
|
1,158
sqft
|
built
1975
1106 Helen Dowdy, Crystal Beach, TX 77650
$-921
Cash flow
-11.6%
Cash-on-Cash Return
3.0%
Cap rate
0.5%
Rent to Value Ratio
Active
$400,000
2
bds
|
4
ba
|
1,122
sqft
|
built
2016
3292 Hidden Gold, Crystal Beach, TX 77650
$-775
Cash flow
-10.1%
Cash-on-Cash Return
3.4%
Cap rate
0.5%
Rent to Value Ratio
Active
$475,000
4
bds
|
3
ba
|
1,758
sqft
|
built
2004
3216 Castle Dr, Crystal Beach, TX 77650
$-691
Cash flow
-7.6%
Cash-on-Cash Return
3.9%
Cap rate
0.7%
Rent to Value Ratio
Active
$450,000
3
bds
|
2
ba
|
1,280
sqft
|
built
2014
2307 Martinique, Crystal Beach, TX 77650
$-914
Cash flow
-10.6%
Cash-on-Cash Return
3.2%
Cap rate
0.6%
Rent to Value Ratio
Active
$529,900
4
bds
|
3
ba
|
1,700
sqft
|
built
2010
2932 Lakeside Dr, Crystal Beach, TX 77650
$-1,096
Cash flow
-10.8%
Cash-on-Cash Return
3.2%
Cap rate
0.6%
Rent to Value Ratio

Active
$549,000
3
bds
|
3
ba
|
1,632
sqft
|
built
2014
2836 Gulfview Ln, Crystal Beach, TX 77650
$-865
Cash flow
-8.2%
Cash-on-Cash Return
3.8%
Cap rate
0.6%
Rent to Value Ratio
Active
$478,000
2
bds
|
1
ba
|
1,008
sqft
|
built
2011
143 Ocean View Dr, Crystal Beach, TX 77650
$-1,155
Cash flow
-12.6%
Cash-on-Cash Return
2.8%
Cap rate
0.5%
Rent to Value Ratio
Active
$489,000
3
bds
|
2
ba
|
1,408
sqft
|
built
2011
3208 Castle Dr, Crystal Beach, TX 77650
$-970
Cash flow
-10.3%
Cash-on-Cash Return
3.3%
Cap rate
0.6%
Rent to Value Ratio
Active
$599,900
3
bds
|
4
ba
|
1,756
sqft
|
built
2008
835 S Tinkle Ln, Crystal Beach, TX 77650
$-988
Cash flow
-8.6%
Cash-on-Cash Return
3.7%
Cap rate
0.6%
Rent to Value Ratio
Active
$350,000
3
bds
|
2
ba
|
1,360
sqft
|
built
1992
1114 Helen Dowdy, Crystal Beach, TX 77650
$-596
Cash flow
-8.9%
Cash-on-Cash Return
3.6%
Cap rate
0.7%
Rent to Value Ratio
Active
$1,498,000
5
bds
|
5
ba
|
3,330
sqft
|
built
2016
1985 Gulf St, Crystal Beach, TX 77650
$-2,910
Cash flow
-10.1%
Cash-on-Cash Return
3.3%
Cap rate
0.6%
Rent to Value Ratio
Active
$699,500
3
bds
|
2
ba
|
2,149
sqft
|
built
1989
1200 Waterways Dr, Crystal Beach, TX 77650
$-1,457
Cash flow
-10.9%
Cash-on-Cash Return
3.2%
Cap rate
0.5%
Rent to Value Ratio

Active
$430,000
3
bds
|
3
ba
|
1,462
sqft
|
built
2016
1991 Sea Glass, Crystal Beach, TX 77650
$-670
Cash flow
-8.1%
Cash-on-Cash Return
3.8%
Cap rate
0.6%
Rent to Value Ratio
Active
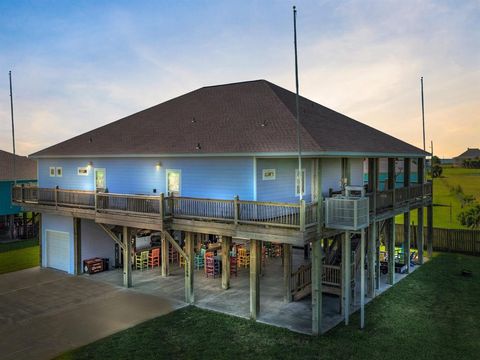
$859,520
4
bds
|
3
ba
|
2,097
sqft
|
built
2020
945 Gulfview Dr, Crystal Beach, TX 77650
$-1,646
Cash flow
-10.0%
Cash-on-Cash Return
3.4%
Cap rate
0.5%
Rent to Value Ratio
Active
$450,000
3
bds
|
2
ba
|
1,178
sqft
|
built
2017
967 Bowers Ln, Crystal Beach, TX 77650
$-855
Cash flow
-9.9%
Cash-on-Cash Return
3.4%
Cap rate
0.6%
Rent to Value Ratio
Active
$579,000
3
bds
|
3
ba
|
1,496
sqft
|
built
2022
2340 Martinique, Crystal Beach, TX 77650
$-1,263
Cash flow
-11.4%
Cash-on-Cash Return
3.1%
Cap rate
0.6%
Rent to Value Ratio
Active
$990,000
4
bds
|
3
ba
|
2,660
sqft
|
built
2012
2139 Gulf, Crystal Beach, TX 77650
$-2,076
Cash flow
-10.9%
Cash-on-Cash Return
3.2%
Cap rate
0.6%
Rent to Value Ratio
Active
$329,900
3
bds
|
2
ba
|
1,333
sqft
|
built
2000
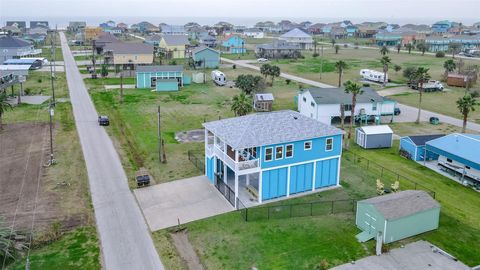
1984 Matt Dr, Crystal Beach, TX 77650
$-487
Cash flow
-7.7%
Cash-on-Cash Return
3.9%
Cap rate
0.7%
Rent to Value Ratio
Active
$375,000
2
bds
|
3
ba
|
1,176
sqft
|
built
2010
908 West Ln, Crystal Beach, TX 77650
$-645
Cash flow
-9.0%
Cash-on-Cash Return
3.6%
Cap rate
0.6%
Rent to Value Ratio
Active
$599,900
3
bds
|
2
ba
|
1,750
sqft
|
built
2016
1823 Pompano Ln, Crystal Beach, TX 77650
$-1,087
Cash flow
-9.5%
Cash-on-Cash Return
3.5%
Cap rate
0.6%
Rent to Value Ratio
Active
$699,000
3
bds
|
3
ba
|
1,692
sqft
|
built
2009
981 S Stingaree Dr, Crystal Beach, TX 77650
$-962
Cash flow
-7.2%
Cash-on-Cash Return
4.0%
Cap rate
0.5%
Rent to Value Ratio
Active
$359,000
2
bds
|
2
ba
|
1,216
sqft
|
built
2010
984 S Stingaree Dr, Crystal Beach, TX 77650
$-554
Cash flow
-8.1%
Cash-on-Cash Return
3.8%
Cap rate
0.6%
Rent to Value Ratio
Active
$645,000
4
bds
|
2
ba
|
1,400
sqft
|
built
2010
1971 Avenue I, Crystal Beach, TX 77650
$-1,223
Cash flow
-9.9%
Cash-on-Cash Return
3.4%
Cap rate
0.5%
Rent to Value Ratio
Active
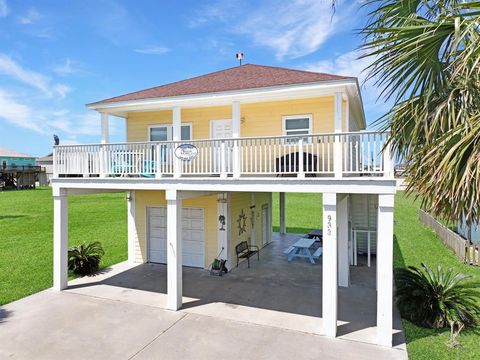
$349,900
2
bds
|
2
ba
|
900
sqft
|
built
2009
933 Westview, Crystal Beach, TX 77650
$-669
Cash flow
-10.0%
Cash-on-Cash Return
3.4%
Cap rate
0.6%
Rent to Value Ratio
Active
$749,000
4
bds
|
4
ba
|
2,378
sqft
|
built
2016
2366 Sand Crab Ln, Crystal Beach, TX 77650
$-1,606
Cash flow
-11.2%
Cash-on-Cash Return
3.1%
Cap rate
0.5%
Rent to Value Ratio
Active
$879,000
5
bds
|
3
ba
|
2,147
sqft
|
built
2014
1215 Gulf Rd, Crystal Beach, TX 77650
$-1,745
Cash flow
-10.4%
Cash-on-Cash Return
3.3%
Cap rate
0.4%
Rent to Value Ratio
Active
$269,900
bds
|
1
ba
|
440
sqft
|
built
2021
138 Mae Cir S, Crystal Beach, TX 77650
$-632
Cash flow
-12.2%
Cash-on-Cash Return
2.9%
Cap rate
0.5%
Rent to Value Ratio

Active
$1,750,000
4
bds
|
4
ba
|
4,100
sqft
|
built
2015
3450 Smiths Pt, Crystal Beach, TX 77650
$-3,471
Cash flow
-10.3%
Cash-on-Cash Return
3.3%
Cap rate
0.5%
Rent to Value Ratio
Active
$999,900
4
bds
|
4
ba
|
2,303
sqft
|
built
2011
3026 Copacabana Dr, Crystal Beach, TX 77650
$-1,993
Cash flow
-10.4%
Cash-on-Cash Return
3.3%
Cap rate
0.6%
Rent to Value Ratio

Active
$699,000
4
bds
|
2
ba
|
2,332
sqft
|
built
2012
2585 Tide Dr, Crystal Beach, TX 77650
$-1,222
Cash flow
-9.1%
Cash-on-Cash Return
3.6%
Cap rate
0.6%
Rent to Value Ratio

Active
$649,000
3
bds
|
2
ba
|
1,120
sqft
|
built
2009
2902 Lakeside Dr, Crystal Beach, TX 77650
$-1,788
Cash flow
-14.4%
Cash-on-Cash Return
2.4%
Cap rate
0.4%
Rent to Value Ratio