Crystal Beach, TX Investment Properties for Sale
Browse homes for sale and investment properties in Crystal Beach, TX. Refine your search by price, property type, or more.
Best cash flowing properties in Crystal Beach, TX
Active
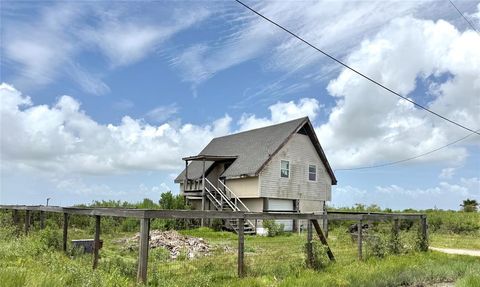
$99,000
2
bds
|
1
ba
|
632
sqft
|
built
1983
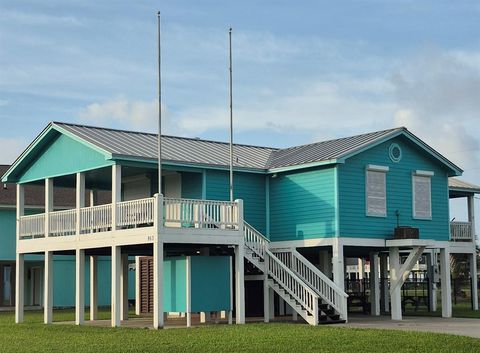
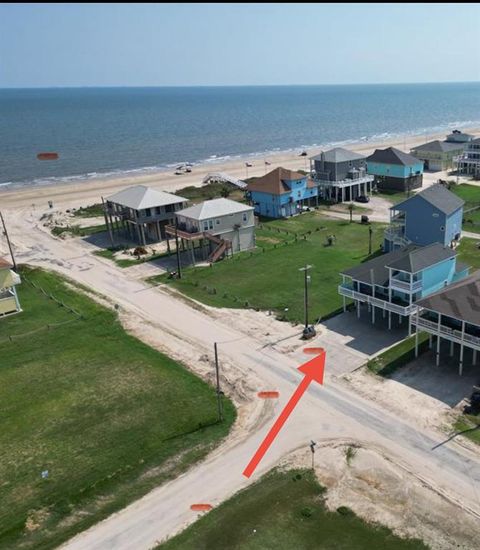
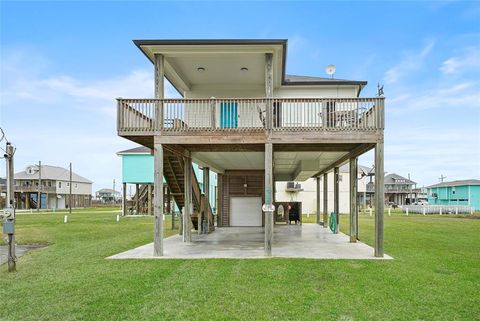
1157 N Tinkle Ln, Crystal Beach, TX 77650
$404
Cash flow
21.3%
Cash-on-Cash Return
10.6%
Cap rate
1.4%
Rent to Value Ratio

Active
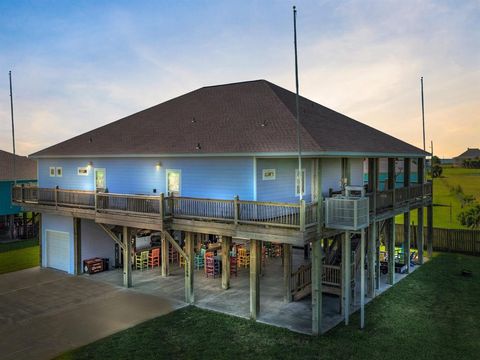
$375,000
3
bds
|
2
ba
|
2,037
sqft
|
built
2006
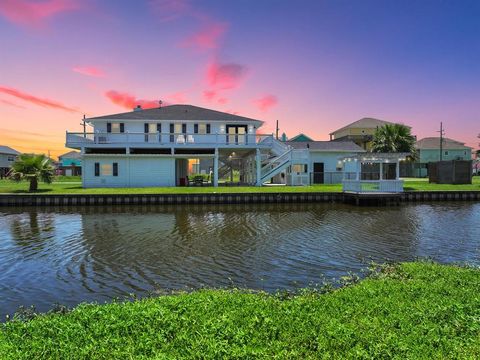
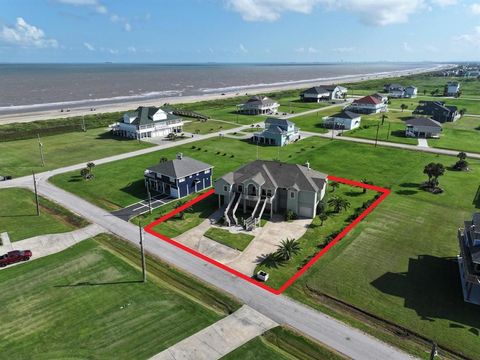
3241 Castle Dr, Crystal Beach, TX 77650
$-286
Cash flow
-4.0%
Cash-on-Cash Return
4.8%
Cap rate
0.9%
Rent to Value Ratio
159 out of 244 properties for sale in Crystal Beach, TX
Limited Results Shown
Create a free account, or log in to reveal all property listings and enjoy the complete experience.
Active
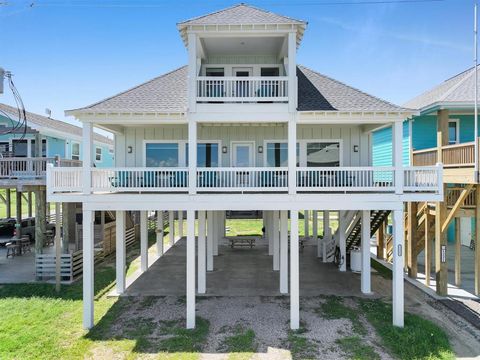
$749,000
4
bds
|
4
ba
|
2,378
sqft
|
built
2016
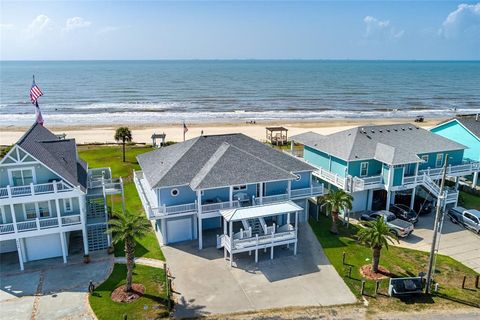
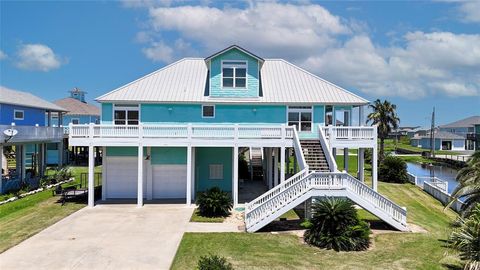
2366 Sand Crab Ln, Crystal Beach, TX 77650
$-1,606
Cash flow
-11.2%
Cash-on-Cash Return
3.1%
Cap rate
0.5%
Rent to Value Ratio
Active
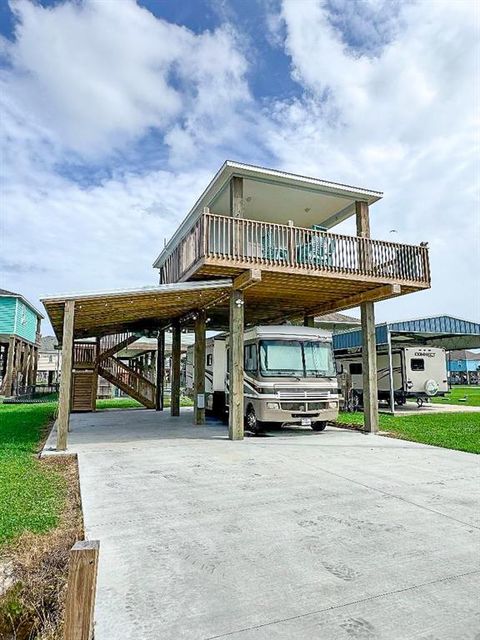
$879,000
5
bds
|
3
ba
|
2,147
sqft
|
built
2014
1215 Gulf Rd, Crystal Beach, TX 77650
$-1,745
Cash flow
-10.4%
Cash-on-Cash Return
3.3%
Cap rate
0.4%
Rent to Value Ratio
Active
$269,900
bds
|
1
ba
|
440
sqft
|
built
2021
138 Mae Cir S, Crystal Beach, TX 77650
$-632
Cash flow
-12.2%
Cash-on-Cash Return
2.9%
Cap rate
0.5%
Rent to Value Ratio

Active
$1,750,000
4
bds
|
4
ba
|
4,100
sqft
|
built
2015
3450 Smiths Pt, Crystal Beach, TX 77650
$-3,471
Cash flow
-10.3%
Cash-on-Cash Return
3.3%
Cap rate
0.5%
Rent to Value Ratio
Active
$475,000
3
bds
|
3
ba
|
1,518
sqft
|
built
2011
2757 Gulfview Ln, Crystal Beach, TX 77650
$-677
Cash flow
-7.4%
Cash-on-Cash Return
4.0%
Cap rate
0.7%
Rent to Value Ratio
Active
$999,900
4
bds
|
4
ba
|
2,303
sqft
|
built
2011
3026 Copacabana Dr, Crystal Beach, TX 77650
$-1,993
Cash flow
-10.4%
Cash-on-Cash Return
3.3%
Cap rate
0.6%
Rent to Value Ratio
Active
$449,000
3
bds
|
2
ba
|
1,542
sqft
|
built
2011
2634 Whitecap, Crystal Beach, TX 77650
$-838
Cash flow
-9.7%
Cash-on-Cash Return
3.4%
Cap rate
0.6%
Rent to Value Ratio

Active
$699,000
4
bds
|
2
ba
|
2,332
sqft
|
built
2012
2585 Tide Dr, Crystal Beach, TX 77650
$-1,222
Cash flow
-9.1%
Cash-on-Cash Return
3.6%
Cap rate
0.6%
Rent to Value Ratio

Active
$649,000
3
bds
|
2
ba
|
1,120
sqft
|
built
2009
2902 Lakeside Dr, Crystal Beach, TX 77650
$-1,788
Cash flow
-14.4%
Cash-on-Cash Return
2.4%
Cap rate
0.4%
Rent to Value Ratio

Active
$550,000
3
bds
|
2
ba
|
1,372
sqft
|
built
2011
3347 Prides Way, Crystal Beach, TX 77650
$-1,077
Cash flow
-10.2%
Cash-on-Cash Return
3.3%
Cap rate
0.6%
Rent to Value Ratio
Active
$1,650,000
5
bds
|
6
ba
|
4,140
sqft
|
built
2015
2414 Sand Drift Ln, Crystal Beach, TX 77650
$-3,372
Cash flow
-10.7%
Cash-on-Cash Return
3.2%
Cap rate
0.6%
Rent to Value Ratio

Active
$405,000
3
bds
|
2
ba
|
1,288
sqft
|
built
2004
3233 Castle Dr, Crystal Beach, TX 77650
$-796
Cash flow
-10.3%
Cash-on-Cash Return
3.3%
Cap rate
0.6%
Rent to Value Ratio

Active
$374,000
3
bds
|
2
ba
|
1,610
sqft
|
built
2015
973 Crane Ln, Crystal Beach, TX 77650
$-310
Cash flow
-4.3%
Cash-on-Cash Return
4.7%
Cap rate
0.7%
Rent to Value Ratio

Active
$475,000
3
bds
|
2
ba
|
1,421
sqft
|
built
2012
923 Tidelands Dr, Crystal Beach, TX 77650
$-830
Cash flow
-9.1%
Cash-on-Cash Return
3.6%
Cap rate
0.6%
Rent to Value Ratio
Active
$649,000
3
bds
|
3
ba
|
1,487
sqft
|
built
2009
2583 Breaker Dr, Crystal Beach, TX 77650
$-2,049
Cash flow
-16.5%
Cash-on-Cash Return
1.9%
Cap rate
0.4%
Rent to Value Ratio
Active
$575,000
3
bds
|
3
ba
|
1,576
sqft
|
built
2012
2100 Mills, Crystal Beach, TX 77650
$-1,009
Cash flow
-9.2%
Cash-on-Cash Return
3.6%
Cap rate
0.6%
Rent to Value Ratio
Active
$389,340
2
bds
|
2
ba
|
1,236
sqft
|
built
1998
953 Sea Breeze, Crystal Beach, TX 77650
$-795
Cash flow
-10.7%
Cash-on-Cash Return
3.2%
Cap rate
0.6%
Rent to Value Ratio
Active
$1,275,000
3
bds
|
4
ba
|
2,548
sqft
|
built
2009
2728 Gillespie, Crystal Beach, TX 77650
$-4,031
Cash flow
-16.5%
Cash-on-Cash Return
1.9%
Cap rate
0.4%
Rent to Value Ratio
Active
$889,500
4
bds
|
3
ba
|
1,984
sqft
|
built
2021
2408 Sandpiper, Crystal Beach, TX 77650
$-2,718
Cash flow
-15.9%
Cash-on-Cash Return
2.0%
Cap rate
0.4%
Rent to Value Ratio
Active
$599,000
3
bds
|
2
ba
|
1,512
sqft
|
built
2003
960 Alberdie Dr, Crystal Beach, TX 77650
$-1,355
Cash flow
-11.8%
Cash-on-Cash Return
3.0%
Cap rate
0.4%
Rent to Value Ratio
Active
$630,000
3
bds
|
2
ba
|
1,650
sqft
|
built
2010
845 Beaumont Dr, Crystal Beach, TX 77650
$-1,560
Cash flow
-12.9%
Cash-on-Cash Return
2.7%
Cap rate
0.5%
Rent to Value Ratio
Active
$549,000
3
bds
|
2
ba
|
1,496
sqft
|
built
2011
2108 Mills, Crystal Beach, TX 77650
$-1,093
Cash flow
-10.4%
Cash-on-Cash Return
3.3%
Cap rate
0.5%
Rent to Value Ratio

Active
$385,000
3
bds
|
2
ba
|
1,207
sqft
|
built
2011
905 Sage, Crystal Beach, TX 77650
$-844
Cash flow
-11.4%
Cash-on-Cash Return
3.0%
Cap rate
0.5%
Rent to Value Ratio
Active
$549,900
4
bds
|
2
ba
|
1,815
sqft
|
built
2007
833 S Oneal Rd, Crystal Beach, TX 77650
$-954
Cash flow
-9.1%
Cash-on-Cash Return
3.6%
Cap rate
0.6%
Rent to Value Ratio

Active
$1,825,000
6
bds
|
6
ba
|
3,720
sqft
|
built
2019
870 Kahla Dr, Crystal Beach, TX 77650
$-3,607
Cash flow
-10.3%
Cash-on-Cash Return
3.3%
Cap rate
0.5%
Rent to Value Ratio
Active
$399,000
2
bds
|
2
ba
|
1,080
sqft
|
built
2013
962 Driftwood Dr, Crystal Beach, TX 77650
$-661
Cash flow
-8.6%
Cash-on-Cash Return
3.7%
Cap rate
0.6%
Rent to Value Ratio

Active
$420,000
2
bds
|
2
ba
|
999
sqft
|
built
2011
2021 Vista Dr, Crystal Beach, TX 77650
$-825
Cash flow
-10.2%
Cash-on-Cash Return
3.3%
Cap rate
0.5%
Rent to Value Ratio
Active
$849,000
4
bds
|
3
ba
|
3,210
sqft
|
built
2006
813 Pinata Dr, Crystal Beach, TX 77650
$-915
Cash flow
-5.6%
Cash-on-Cash Return
4.4%
Cap rate
0.7%
Rent to Value Ratio
Active
$699,000
4
bds
|
3
ba
|
2,050
sqft
|
built
2010
942 Kent, Crystal Beach, TX 77650
$-987
Cash flow
-7.4%
Cash-on-Cash Return
4.0%
Cap rate
0.7%
Rent to Value Ratio

Active
$519,400
3
bds
|
3
ba
|
1,484
sqft
|
built
1993
2332 Martinique, Crystal Beach, TX 77650
$-1,175
Cash flow
-11.8%
Cash-on-Cash Return
3.0%
Cap rate
0.5%
Rent to Value Ratio
Active
$595,000
3
bds
|
2
ba
|
1,715
sqft
|
built
2012
858 Kahla Dr, Crystal Beach, TX 77650
$-1,362
Cash flow
-11.9%
Cash-on-Cash Return
2.9%
Cap rate
0.5%
Rent to Value Ratio
Active
$499,900
3
bds
|
2
ba
|
1,480
sqft
|
built
2012
1121 Blue Water Dr, Crystal Beach, TX 77650
$-1,090
Cash flow
-11.4%
Cash-on-Cash Return
3.1%
Cap rate
0.6%
Rent to Value Ratio

Active
$439,000
2
bds
|
2
ba
|
1,120
sqft
|
built
2009
914 Palmview, Crystal Beach, TX 77650
$-879
Cash flow
-10.4%
Cash-on-Cash Return
3.3%
Cap rate
0.6%
Rent to Value Ratio

Active
$500,000
2
bds
|
2
ba
|
1,188
sqft
|
built
2011
3008 Shady Ln, Crystal Beach, TX 77650
$-1,104
Cash flow
-11.5%
Cash-on-Cash Return
3.0%
Cap rate
0.5%
Rent to Value Ratio
Active
$1,173,000
3
bds
|
3
ba
|
2,262
sqft
|
built
2020
2798 Tradewind Ln, Crystal Beach, TX 77650
$-2,986
Cash flow
-13.3%
Cash-on-Cash Return
2.6%
Cap rate
0.5%
Rent to Value Ratio
Active
$495,000
3
bds
|
2
ba
|
1,680
sqft
|
built
2011
936 Surf Rd, Crystal Beach, TX 77650
$-1,017
Cash flow
-10.7%
Cash-on-Cash Return
3.2%
Cap rate
0.6%
Rent to Value Ratio
Active
$570,000
3
bds
|
2
ba
|
1,332
sqft
|
built
2010
919 Eastview, Crystal Beach, TX 77650
$-1,420
Cash flow
-13.0%
Cash-on-Cash Return
2.7%
Cap rate
0.5%
Rent to Value Ratio
Active
$589,900
3
bds
|
2
ba
|
1,988
sqft
|
built
2011
214 Biloxi, Crystal Beach, TX 77650
$-922
Cash flow
-8.2%
Cash-on-Cash Return
3.8%
Cap rate
0.6%
Rent to Value Ratio