Dartmouth, MA Investment Properties for Sale
Browse homes for sale and investment properties in Dartmouth, MA. Refine your search by price, property type, or more.
Best cash flowing properties in Dartmouth, MA
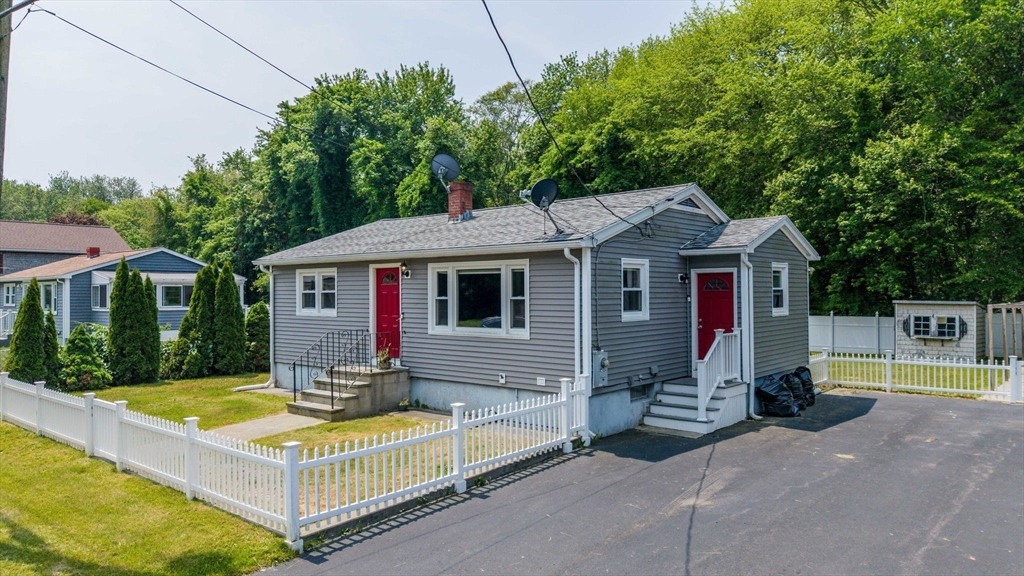
Active
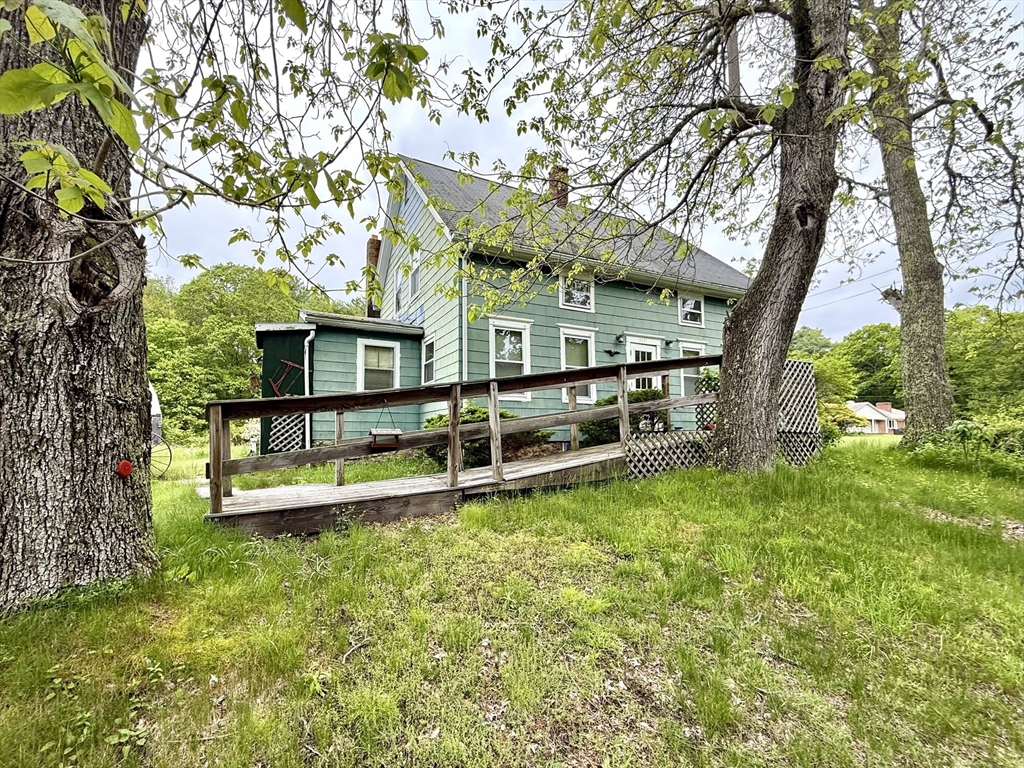
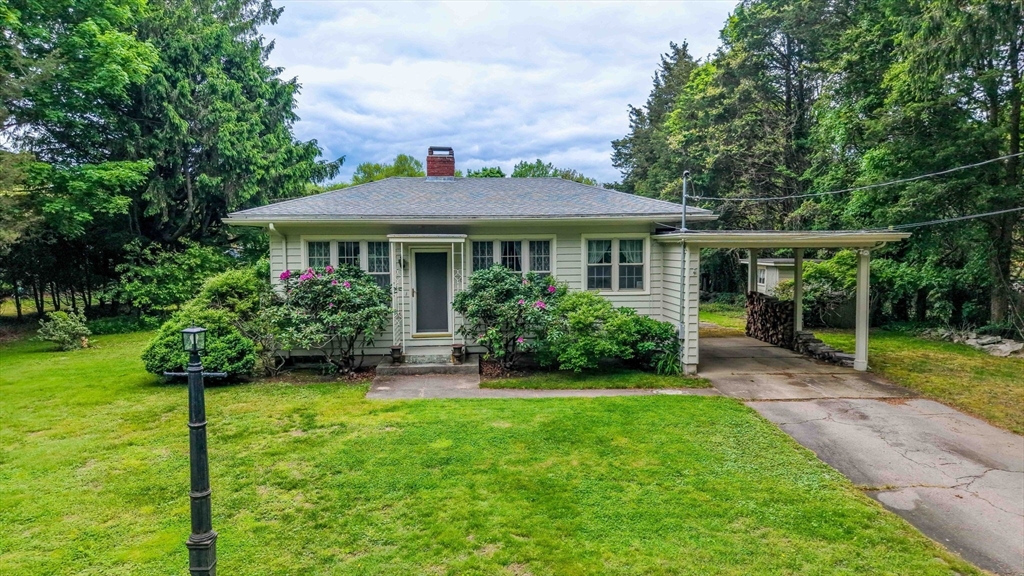
$369,900
4
bds
|
2
ba
|
1,240
sqft
|
built
1880
527 Collins Corner Rd, Dartmouth, MA 02747
$-216
Cash flow
-3.0%
Cash-on-Cash Return
5.6%
Cap rate
0.8%
Rent to Value Ratio
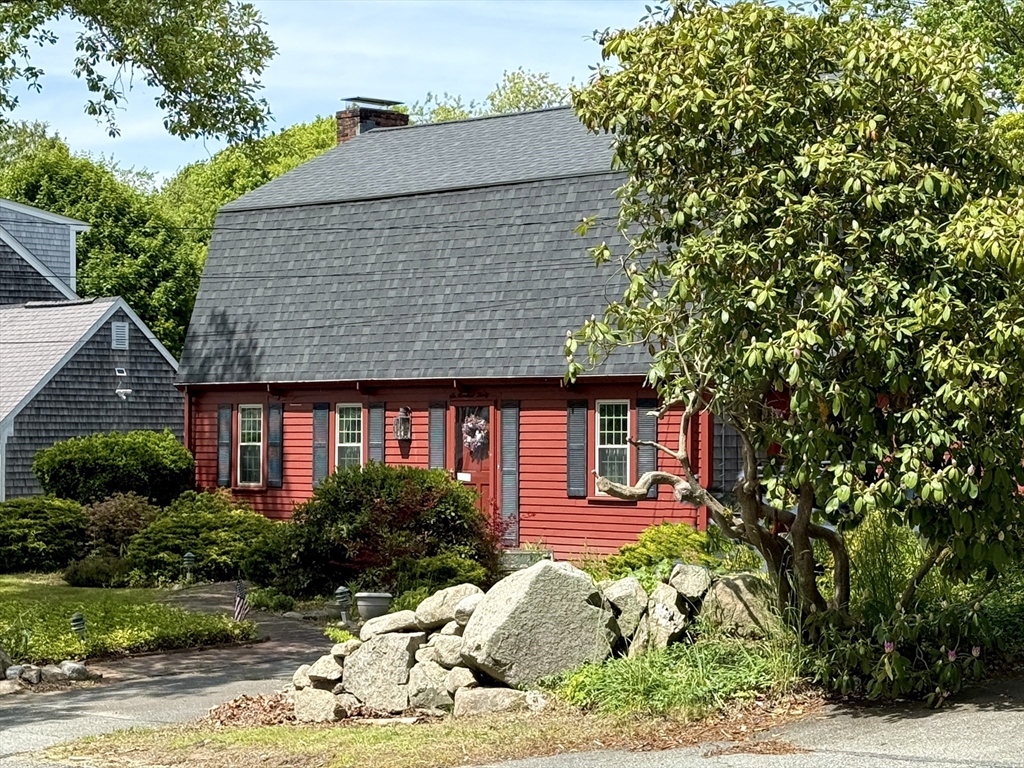
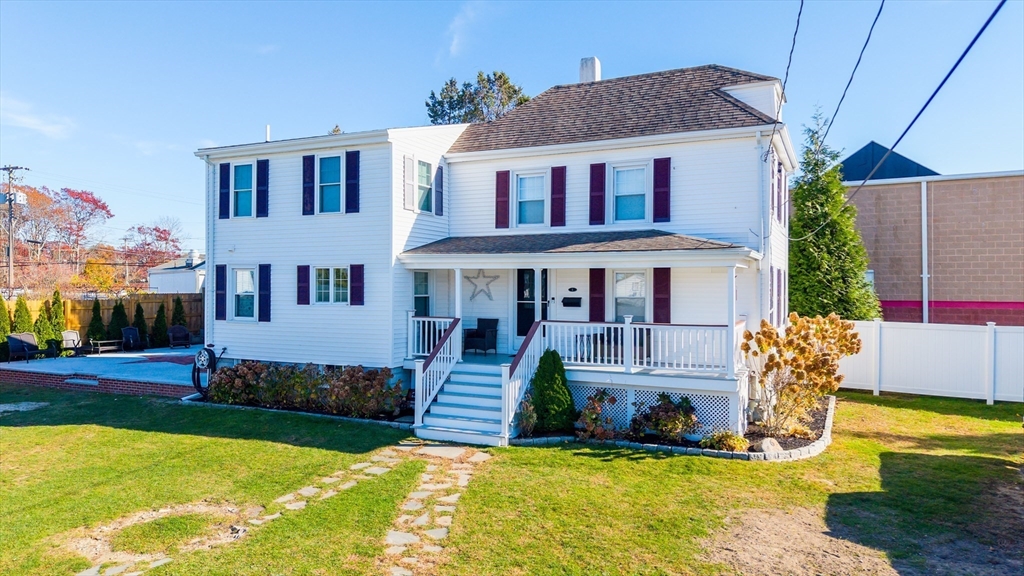
Active under contract
$449,000
4
bds
|
1
ba
|
1,606
sqft
|
built
1900
590 Slocum Rd, Dartmouth, MA 02747
$-416
Cash flow
-4.8%
Cash-on-Cash Return
5.2%
Cap rate
0.7%
Rent to Value Ratio
38 out of 53 properties for sale in Dartmouth, MA
Limited Results Shown
Create a free account, or log in to reveal all property listings and enjoy the complete experience.
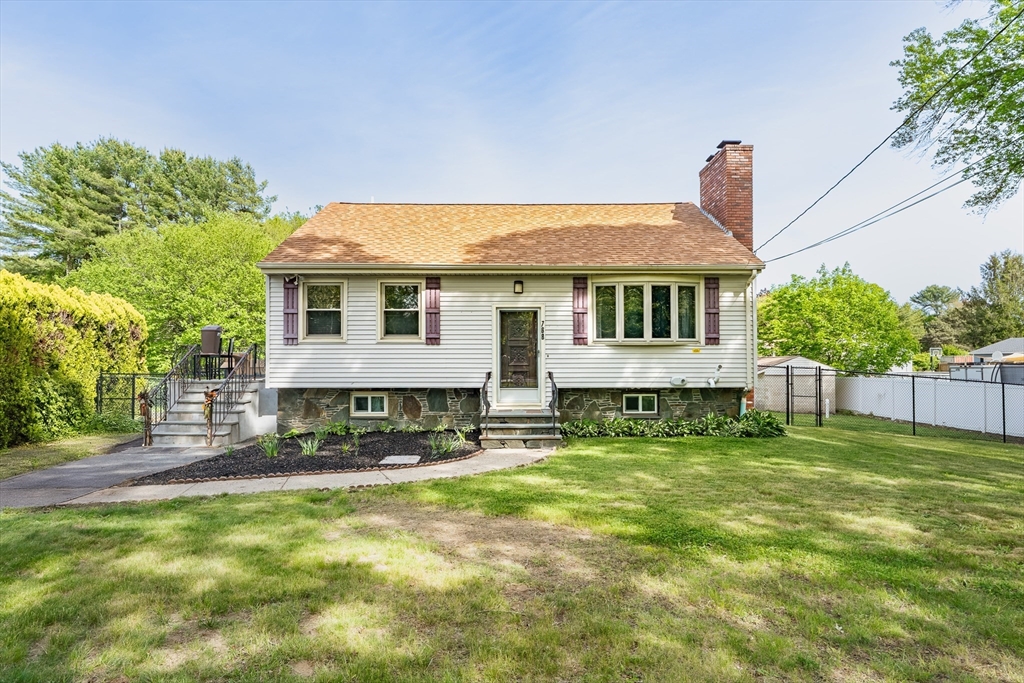
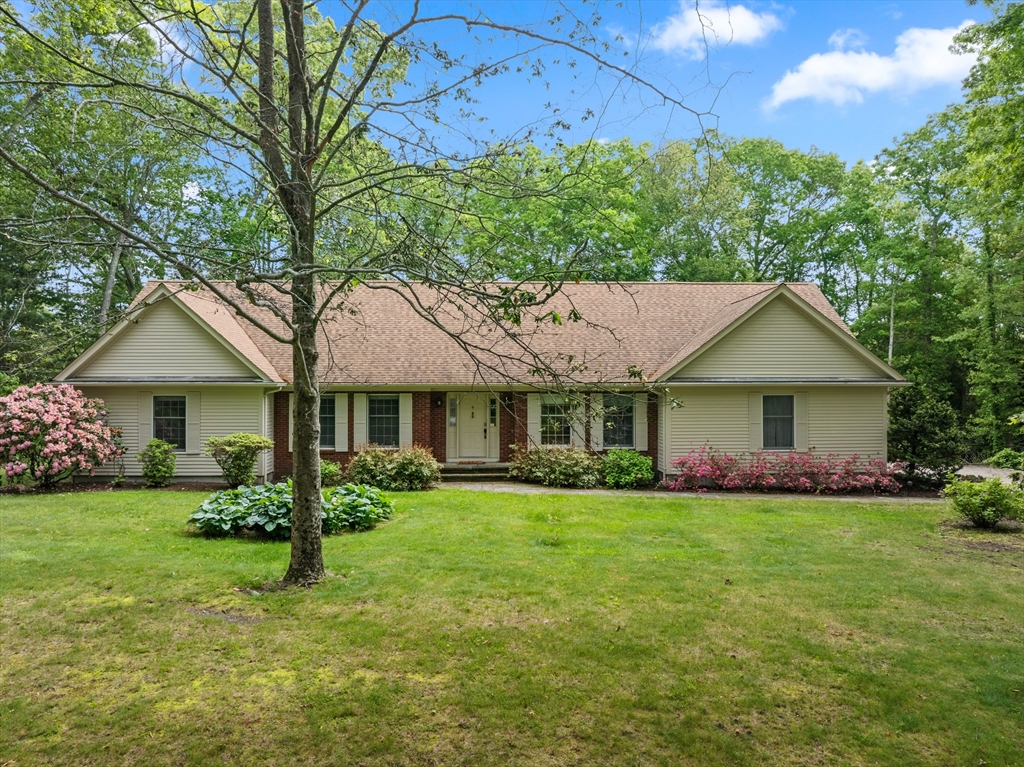
Active under contract
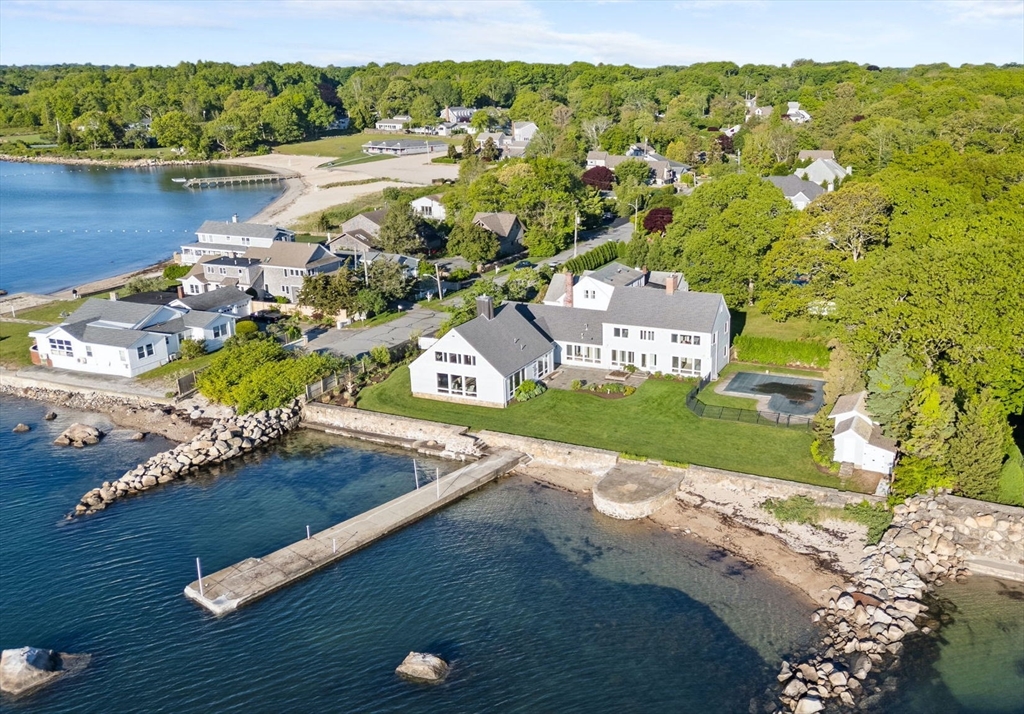
$695,000
4
bds
|
2
ba
|
2,104
sqft
|
built
1965
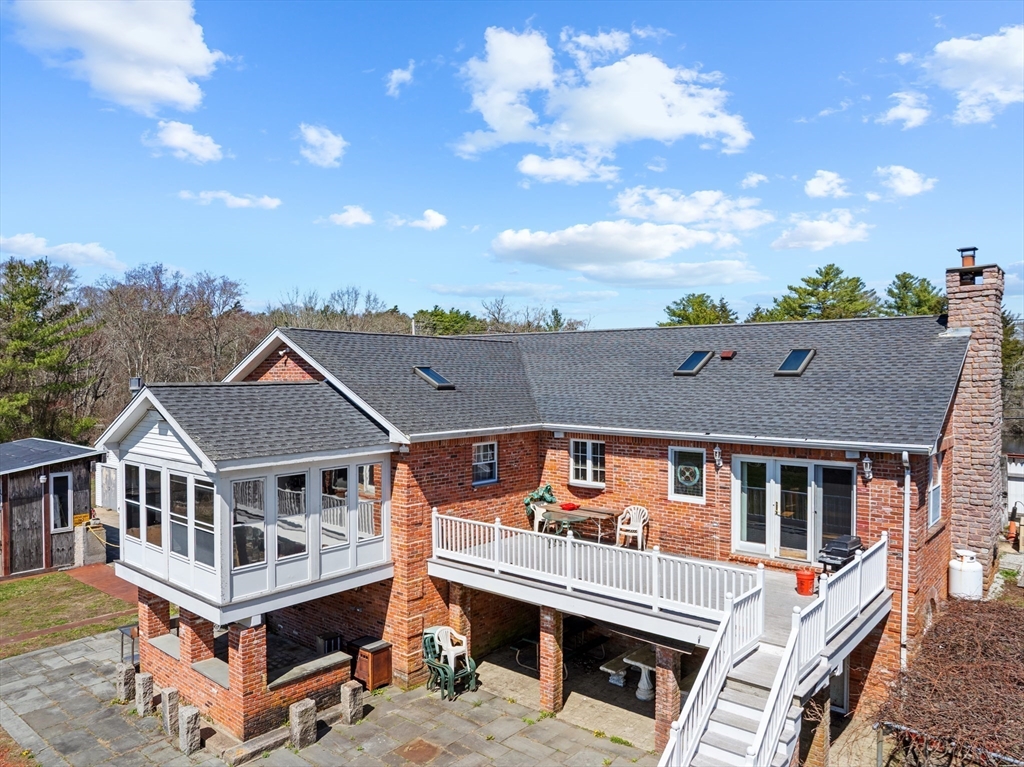
631 Elm St, Dartmouth, MA 02748
$-1,821
Cash flow
-13.7%
Cash-on-Cash Return
3.1%
Cap rate
0.5%
Rent to Value Ratio
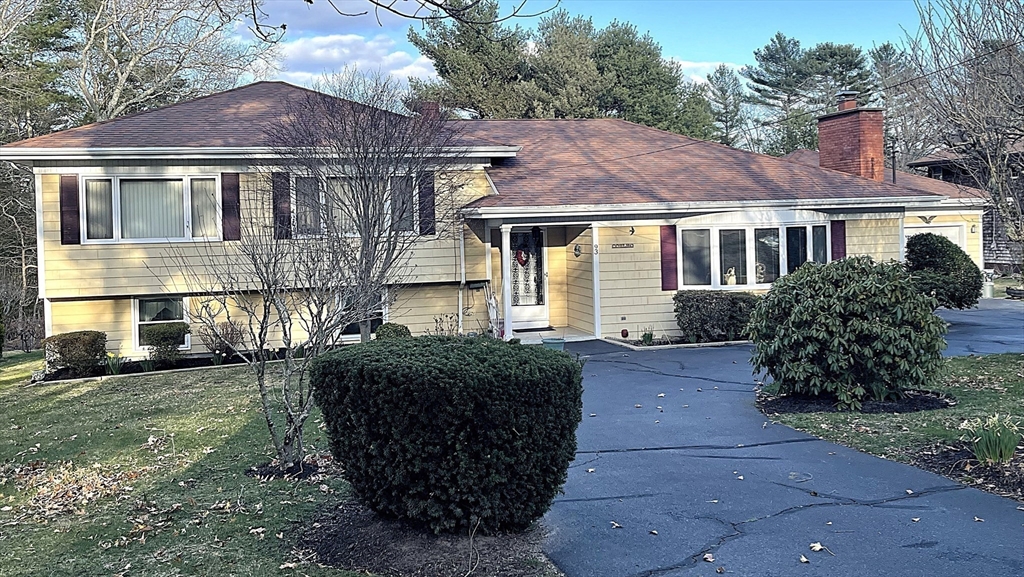
Active
$575,000
3
bds
|
2
ba
|
1,462
sqft
|
built
1978
768 Russells Mills Rd, Dartmouth, MA 02748
$-1,548
Cash flow
-14.0%
Cash-on-Cash Return
3.0%
Cap rate
0.5%
Rent to Value Ratio
Active under contract
$499,900
3
bds
|
1
ba
|
1,464
sqft
|
built
1906
6 Park St, Dartmouth, MA 02748
$-931
Cash flow
-9.7%
Cash-on-Cash Return
4.0%
Cap rate
0.6%
Rent to Value Ratio
Active
$449,000
2
bds
|
1
ba
|
825
sqft
|
built
1963
101 Alpha St, Dartmouth, MA 02747
$-1,046
Cash flow
-12.2%
Cash-on-Cash Return
3.5%
Cap rate
0.5%
Rent to Value Ratio
Active under contract
$449,000
4
bds
|
1
ba
|
1,606
sqft
|
built
1900
590 Slocum Rd, Dartmouth, MA 02747
$-416
Cash flow
-4.8%
Cash-on-Cash Return
5.2%
Cap rate
0.7%
Rent to Value Ratio
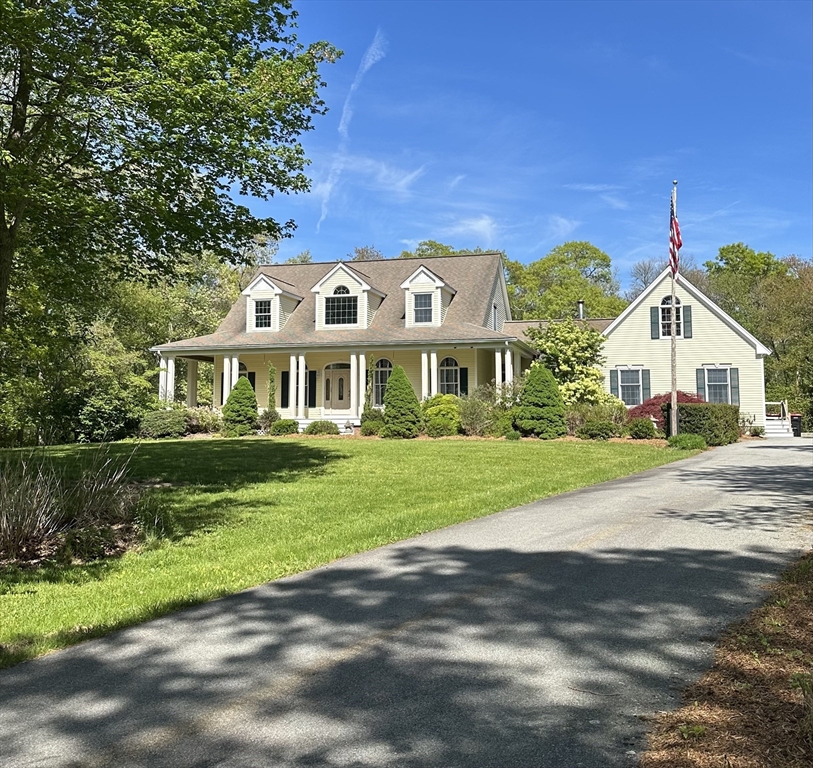
Active
$774,900
3
bds
|
2
ba
|
2,050
sqft
|
built
1966
30 Lucy St, Dartmouth, MA 02748
$-1,954
Cash flow
-13.2%
Cash-on-Cash Return
3.2%
Cap rate
0.5%
Rent to Value Ratio
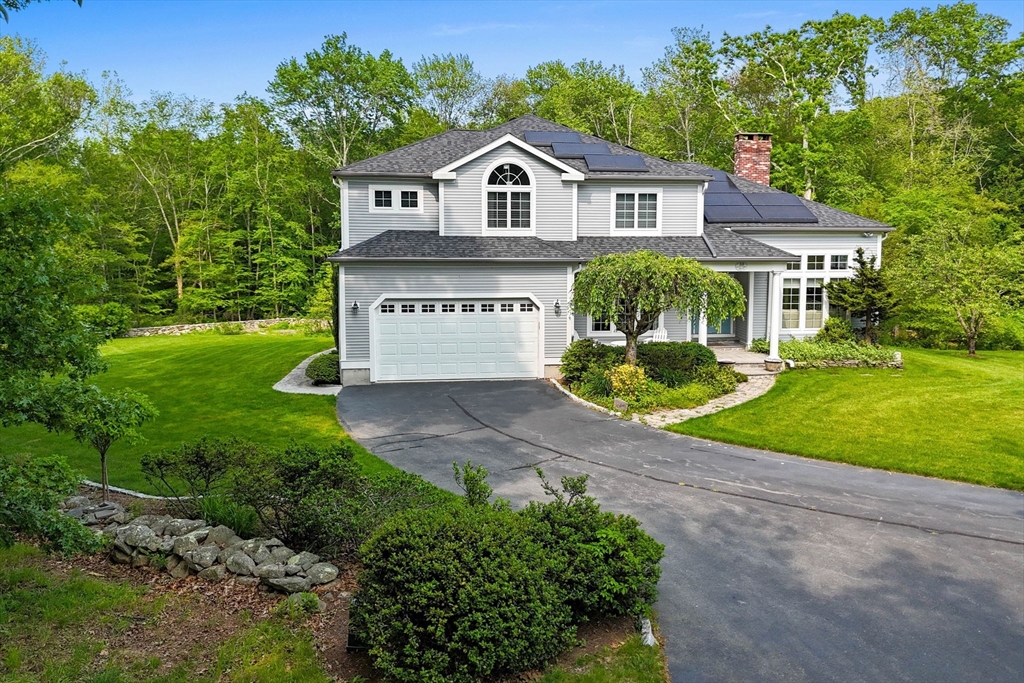
Active under contract
$849,900
3
bds
|
3
ba
|
3,162
sqft
|
built
1987
9 William Bradford Rd, Dartmouth, MA 02747
$-2,267
Cash flow
-13.9%
Cash-on-Cash Return
3.1%
Cap rate
0.5%
Rent to Value Ratio
Active
$895,000
3
bds
|
2
ba
|
1,488
sqft
|
built
1925
2 Howland Ave, Dartmouth, MA 02748
$-3,062
Cash flow
-17.8%
Cash-on-Cash Return
2.2%
Cap rate
0.3%
Rent to Value Ratio
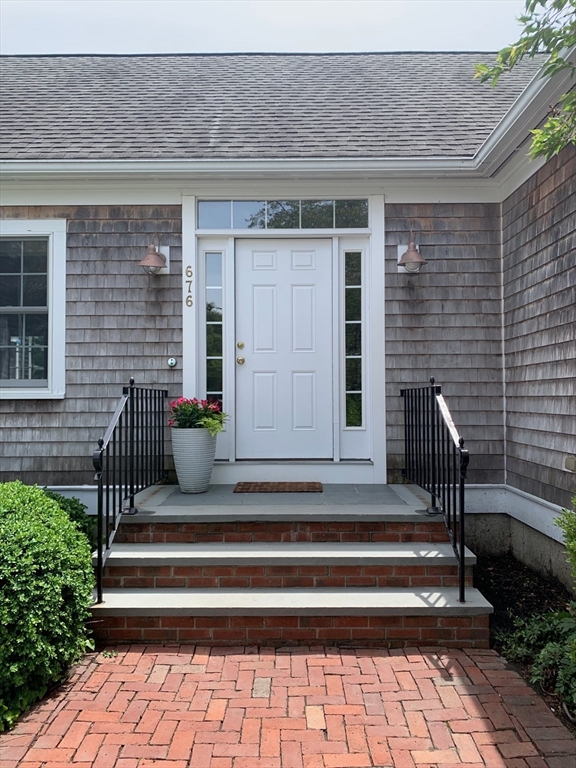
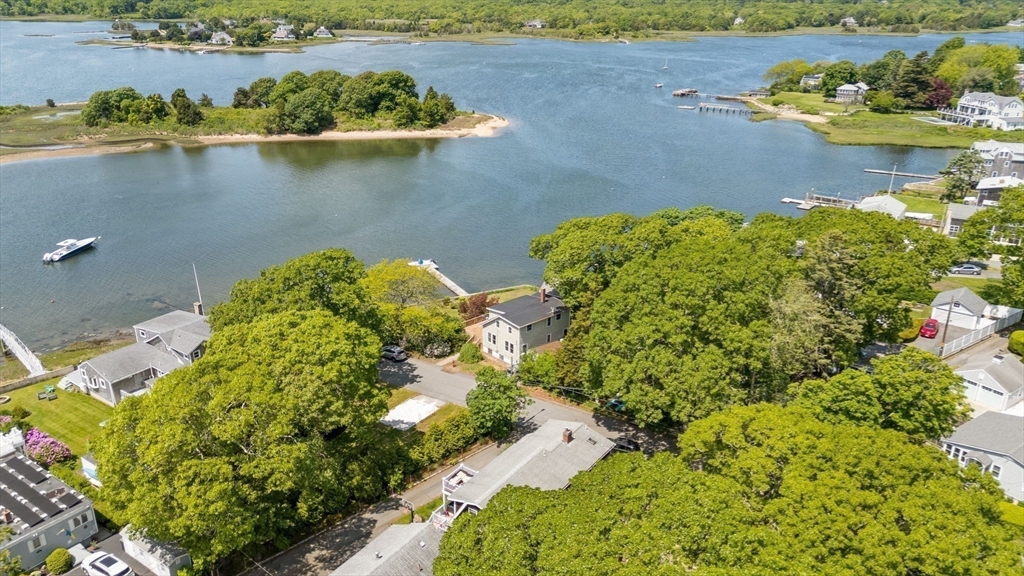
Active
$1,789,000
4
bds
|
4
ba
|
3,332
sqft
|
built
2005
676 Elm St, Dartmouth, MA 02748
$-6,232
Cash flow
-18.2%
Cash-on-Cash Return
2.1%
Cap rate
0.3%
Rent to Value Ratio
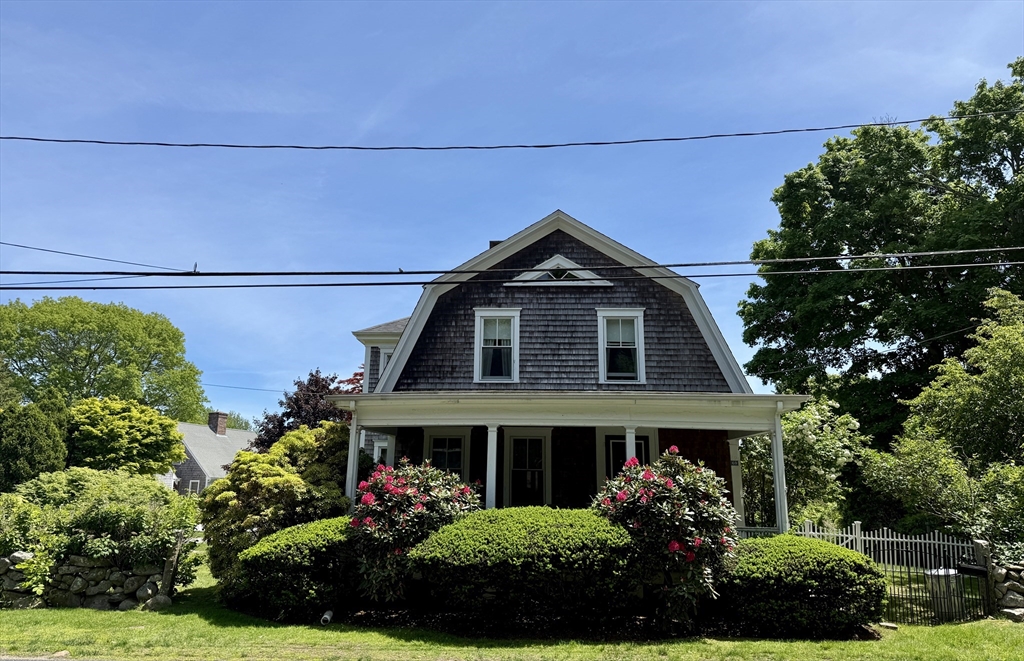
Active
$1,390,000
4
bds
|
3
ba
|
3,501
sqft
|
built
1892
69 Prospect St, Dartmouth, MA 02748
$-5,197
Cash flow
-19.5%
Cash-on-Cash Return
1.8%
Cap rate
0.3%
Rent to Value Ratio
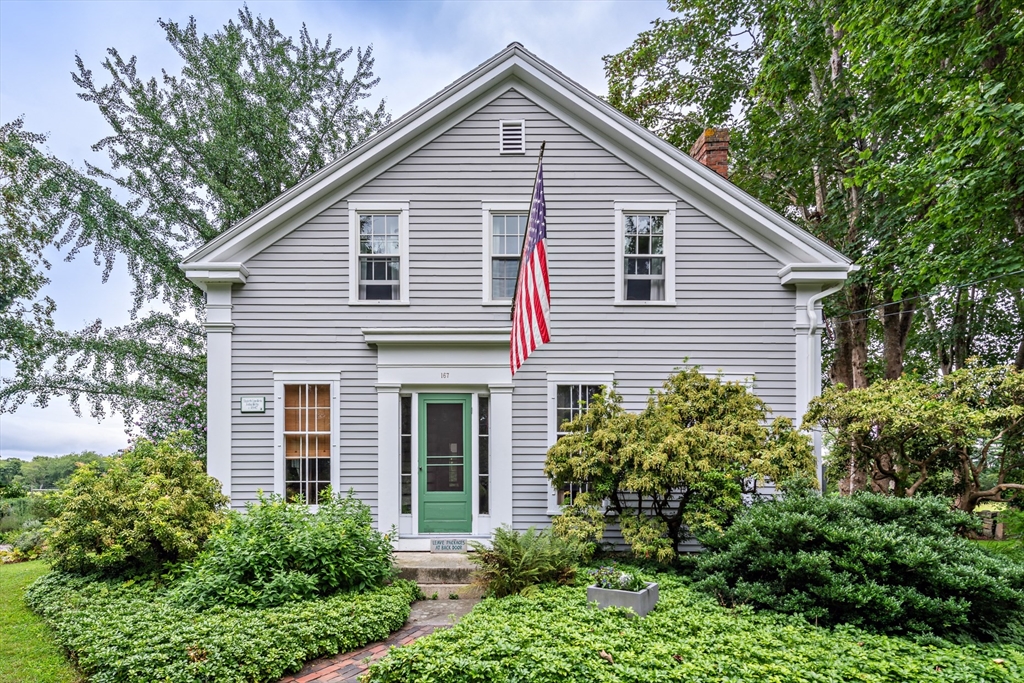
Pending
$1,200,000
4
bds
|
2
ba
|
1,964
sqft
|
built
1846
167 Bakerville Rd, Dartmouth, MA 02748
$-4,751
Cash flow
-20.7%
Cash-on-Cash Return
1.5%
Cap rate
0.3%
Rent to Value Ratio
Active
$2,395,000
4
bds
|
5
ba
|
5,232
sqft
|
built
1930
124 William St, Dartmouth, MA 02748
$-9,912
Cash flow
-21.6%
Cash-on-Cash Return
1.3%
Cap rate
0.2%
Rent to Value Ratio
Active
$695,000
2
bds
|
1
ba
|
885
sqft
|
built
1963
16 Stoneledge Rd, Dartmouth, MA 02748
$-2,427
Cash flow
-18.2%
Cash-on-Cash Return
2.1%
Cap rate
0.3%
Rent to Value Ratio
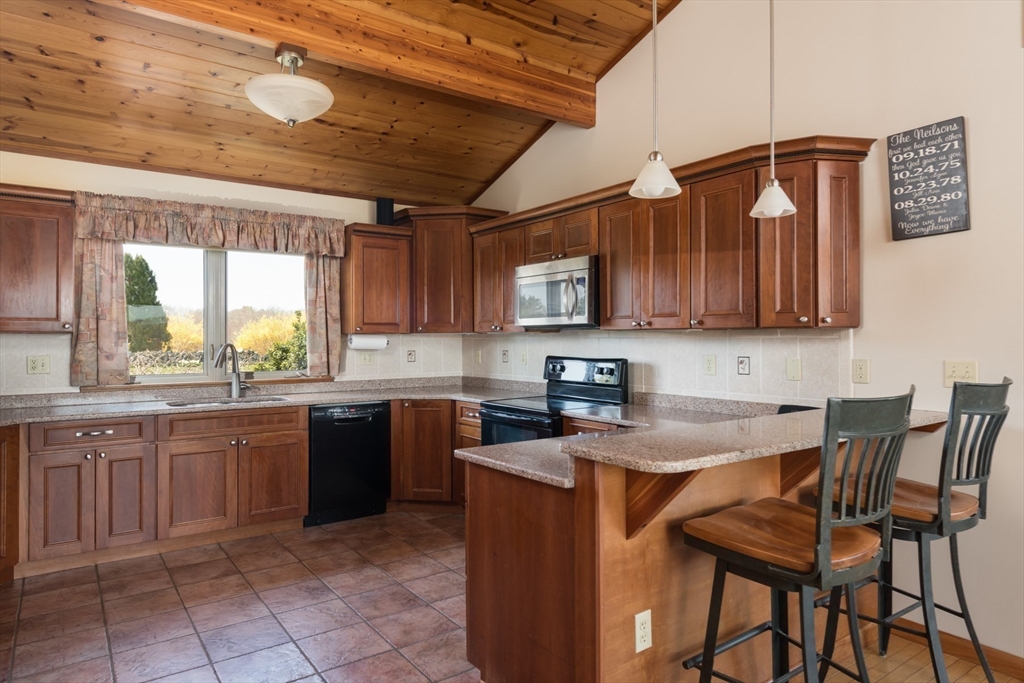
Active
$947,800
3
bds
|
3
ba
|
4,480
sqft
|
built
2007
545 Hixville Rd, Dartmouth, MA 02747
$-2,417
Cash flow
-13.3%
Cash-on-Cash Return
3.2%
Cap rate
0.5%
Rent to Value Ratio
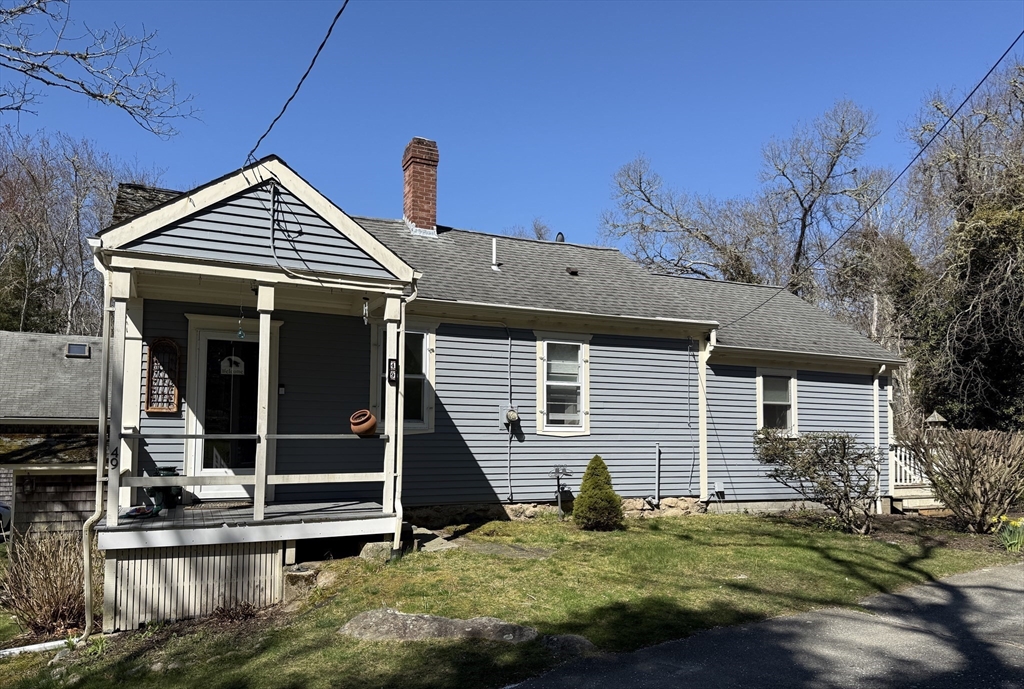
Active
$369,900
4
bds
|
2
ba
|
1,240
sqft
|
built
1880
527 Collins Corner Rd, Dartmouth, MA 02747
$-216
Cash flow
-3.0%
Cash-on-Cash Return
5.6%
Cap rate
0.8%
Rent to Value Ratio
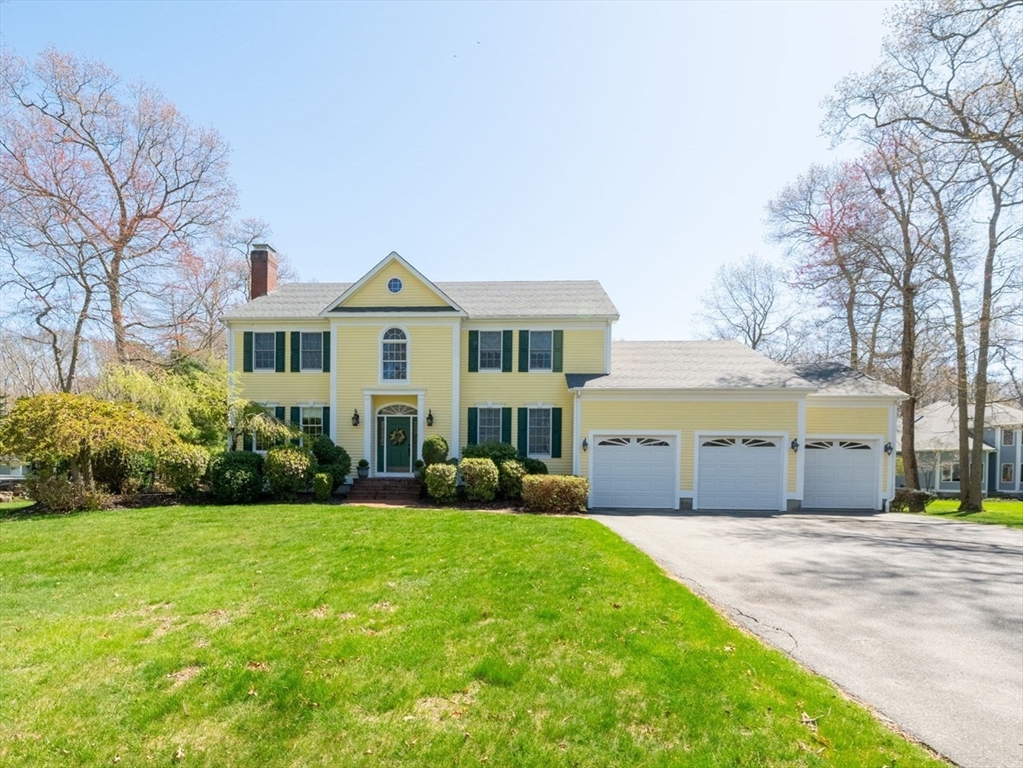
Active
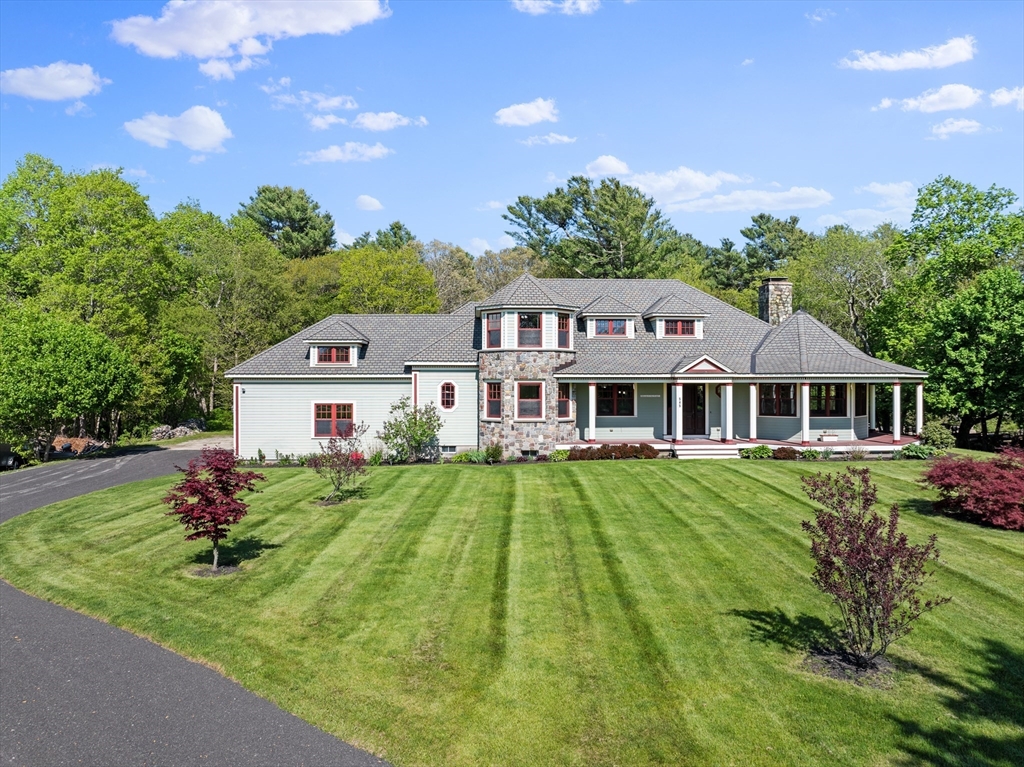
$849,995
3
bds
|
2
ba
|
1,971
sqft
|
built
2003
7 Rileys Way, Dartmouth, MA 02747
$-1,934
Cash flow
-11.9%
Cash-on-Cash Return
3.5%
Cap rate
0.5%
Rent to Value Ratio
Active
$4,000,000
7
bds
|
4
ba
|
4,344
sqft
|
built
1980
482 Smith Neck Rd, Dartmouth, MA 02748
$-20,516
Cash flow
-26.8%
Cash-on-Cash Return
0.1%
Cap rate
0.0%
Rent to Value Ratio
Active
$2,395,000
5
bds
|
5
ba
|
3,228
sqft
|
built
1965
21 Fremont St, Dartmouth, MA 02748
$-10,711
Cash flow
-23.3%
Cash-on-Cash Return
0.9%
Cap rate
0.2%
Rent to Value Ratio
Active
$1,299,999
4
bds
|
5
ba
|
3,586
sqft
|
built
1978
16 Wadsworth Ln, Dartmouth, MA 02748
$-4,366
Cash flow
-17.5%
Cash-on-Cash Return
2.2%
Cap rate
0.3%
Rent to Value Ratio

Active
$1,850,000
12
bds
|
14
ba
|
12,255
sqft
|
built
1920
824 Tucker Rd, Dartmouth, MA 02747
$-7,524
Cash flow
-21.2%
Cash-on-Cash Return
1.4%
Cap rate
0.3%
Rent to Value Ratio
Active
$625,000
5
bds
|
2
ba
|
2,576
sqft
|
built
1920
360 Russells Mills Rd, Dartmouth, MA 02748
$-1,860
Cash flow
-15.5%
Cash-on-Cash Return
2.7%
Cap rate
0.4%
Rent to Value Ratio
Active
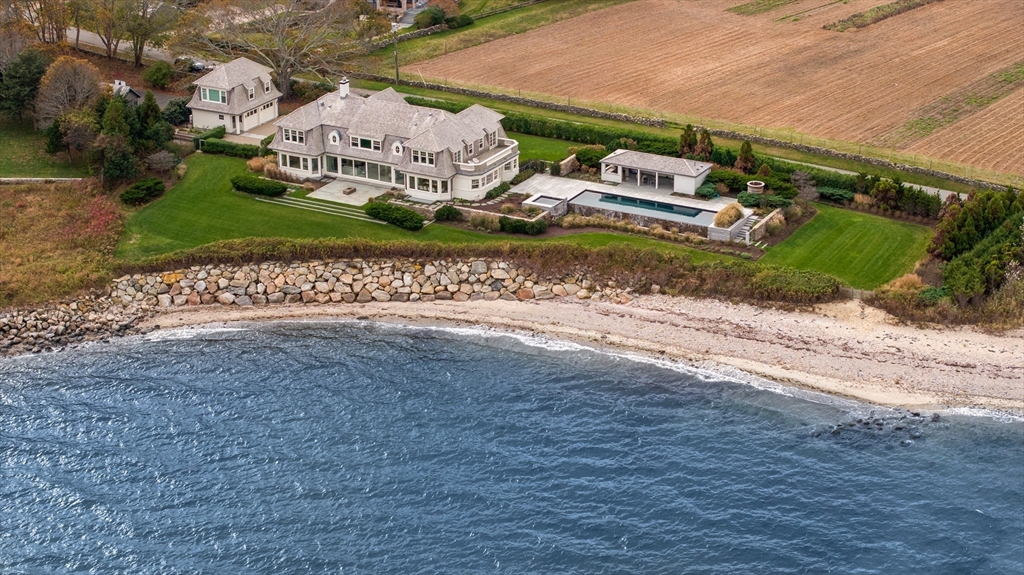
$14,995,000
7
bds
|
11
ba
|
8,765
sqft
|
built
2016
1 Mattarest Ln, Dartmouth, MA 02748
$-79,644
Cash flow
-27.7%
Cash-on-Cash Return
-0.1%
Cap rate
0.0%
Rent to Value Ratio
Active
$1,139,000
4
bds
|
4
ba
|
3,328
sqft
|
built
1995
78 Emerald Dr, Dartmouth, MA 02747
$-3,463
Cash flow
-15.9%
Cash-on-Cash Return
2.6%
Cap rate
0.4%
Rent to Value Ratio
Active
$1,200,000
3
bds
|
4
ba
|
3,100
sqft
|
built
2005
61 Pardon Hill Rd, Dartmouth, MA 02748
$-4,795
Cash flow
-20.8%
Cash-on-Cash Return
1.5%
Cap rate
0.3%
Rent to Value Ratio
Active
$499,900
2
bds
|
1
ba
|
756
sqft
|
built
1900
49 Rock Odundee Rd, Dartmouth, MA 02748
$-1,628
Cash flow
-17.0%
Cash-on-Cash Return
2.4%
Cap rate
0.4%
Rent to Value Ratio

Pending
$625,000
3
bds
|
2
ba
|
2,860
sqft
|
built
1970
16 Basswood Ave, Dartmouth, MA 02747
$-1,379
Cash flow
-11.5%
Cash-on-Cash Return
3.6%
Cap rate
0.5%
Rent to Value Ratio
Active
$950,000
4
bds
|
3
ba
|
1,998
sqft
|
built
1999
700 Old Fall River Rd, Dartmouth, MA 02747
$-3,077
Cash flow
-16.9%
Cash-on-Cash Return
2.4%
Cap rate
0.4%
Rent to Value Ratio
Active
$1,199,000
4
bds
|
3
ba
|
2,840
sqft
|
built
2000
33 Gulf Hill Dr, Dartmouth, MA 02748
$-3,232
Cash flow
-14.1%
Cash-on-Cash Return
3.0%
Cap rate
0.5%
Rent to Value Ratio
Active
$675,000
3
bds
|
2
ba
|
2,236
sqft
|
built
1971
93 Highland Ave, Dartmouth, MA 02747
$-1,454
Cash flow
-11.2%
Cash-on-Cash Return
3.7%
Cap rate
0.5%
Rent to Value Ratio
Active
$1,199,999
4
bds
|
4
ba
|
4,049
sqft
|
built
2003
332 Division Rd, Dartmouth, MA 02748
$-4,378
Cash flow
-19.0%
Cash-on-Cash Return
1.9%
Cap rate
0.3%
Rent to Value Ratio
Active
$1,695,995
4
bds
|
4
ba
|
5,384
sqft
|
built
2001
24 White Alder Way, Dartmouth, MA 02748
$-5,827
Cash flow
-17.9%
Cash-on-Cash Return
2.1%
Cap rate
0.4%
Rent to Value Ratio
Active
$759,999
3
bds
|
3
ba
|
2,204
sqft
|
built
1997
3 Eliza Ln, Dartmouth, MA 02747
$-1,952
Cash flow
-13.4%
Cash-on-Cash Return
3.2%
Cap rate
0.5%
Rent to Value Ratio
Active under contract
$1,375,000
4
bds
|
3
ba
|
2,700
sqft
|
built
2022
119 Wilson St, Dartmouth, MA 02748
$-3,839
Cash flow
-14.6%
Cash-on-Cash Return
2.9%
Cap rate
0.4%
Rent to Value Ratio
Active
$799,900
3
bds
|
1
ba
|
1,146
sqft
|
built
1775
1150 Russells Mills Rd, Dartmouth, MA 02748
$-2,276
Cash flow
-14.8%
Cash-on-Cash Return
2.9%
Cap rate
0.4%
Rent to Value Ratio
Active
$2,399,000
4
bds
|
5
ba
|
4,572
sqft
|
built
1988
180 Rock Odundee Rd, Dartmouth, MA 02748
$-9,037
Cash flow
-19.7%
Cash-on-Cash Return
1.7%
Cap rate
0.3%
Rent to Value Ratio
Active
$8,900,000
5
bds
|
8
ba
|
13,220
sqft
|
built
2006
150 Horseneck Rd, Dartmouth, MA 02748
$-45,755
Cash flow
-26.8%
Cash-on-Cash Return
0.1%
Cap rate
0.1%
Rent to Value Ratio
Active
$1,445,000
4
bds
|
4
ba
|
5,694
sqft
|
built
2000
6 Wildpepper Ln, Dartmouth, MA 02748
$-4,272
Cash flow
-15.4%
Cash-on-Cash Return
2.7%
Cap rate
0.4%
Rent to Value Ratio

Active
$3,000,000
3
bds
|
1
ba
|
1,512
sqft
|
built
1998
337 Old Fall River Rd, Dartmouth, MA 02747
$-13,691
Cash flow
-23.8%
Cash-on-Cash Return
0.8%
Cap rate
0.1%
Rent to Value Ratio