Davenport, FL Investment Properties for Sale
Browse homes for sale and investment properties in Davenport, FL. Refine your search by price, property type, or more.
Best cash flowing properties in Davenport, FL
Active
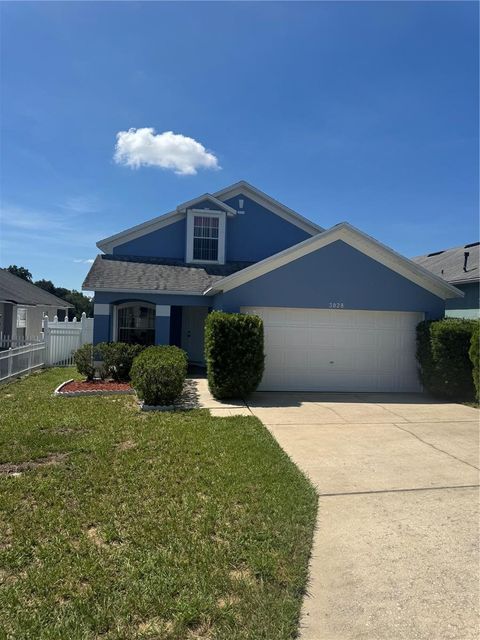
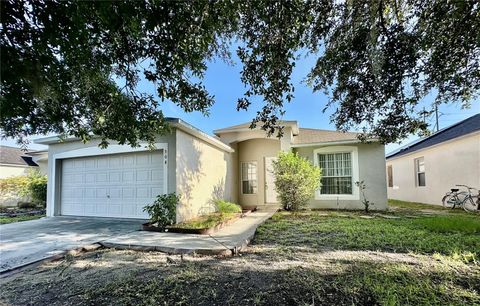
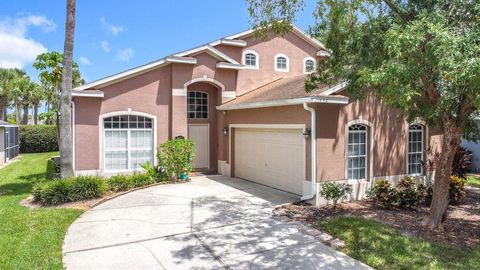
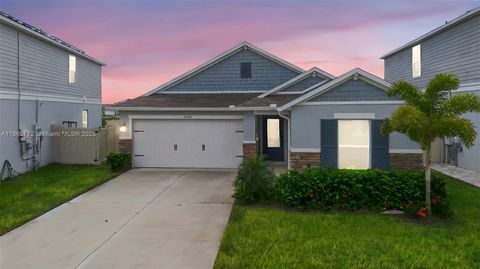
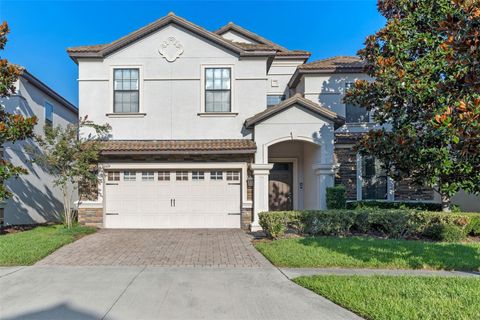
$329,999
4
bds
|
3
ba
|
1,551
sqft
|
built
2003
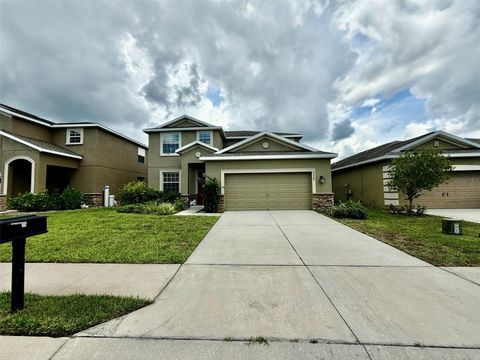
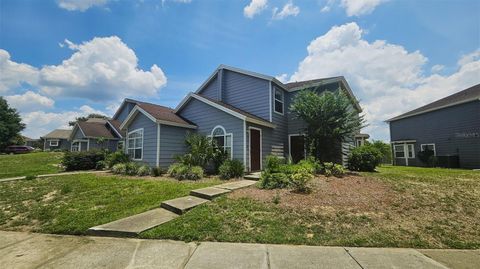
3028 Huntwicke Blvd, Davenport, FL 33837
$-301
Cash flow
-4.8%
Cash-on-Cash Return
5.1%
Cap rate
0.7%
Rent to Value Ratio
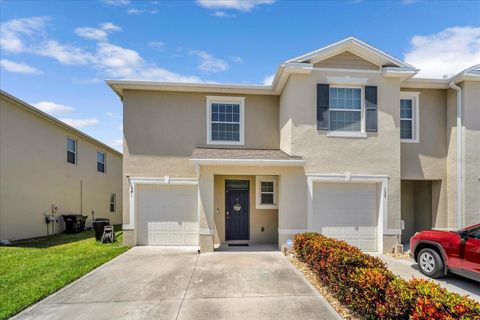
Active
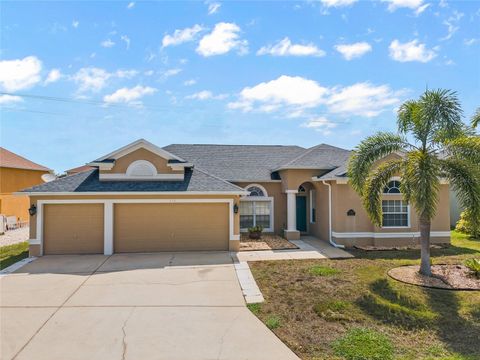
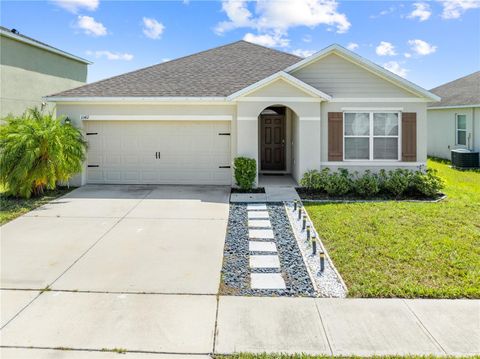
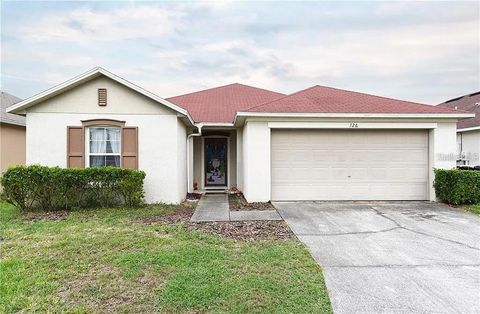
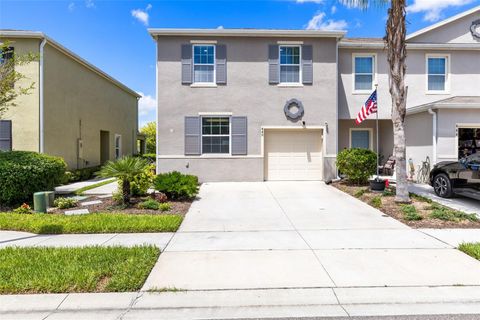
$295,000
3
bds
|
3
ba
|
1,758
sqft
|
built
2020
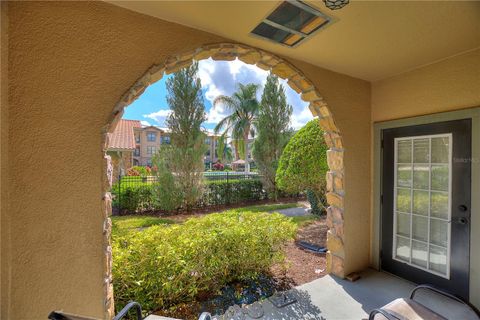
141 Feltrim Reserve Blvd, Davenport, FL 33837
$-305
Cash flow
-5.4%
Cash-on-Cash Return
4.9%
Cap rate
0.8%
Rent to Value Ratio
486 out of 488 properties for sale in Davenport, FL
Limited Results Shown
Create a free account, or log in to reveal all property listings and enjoy the complete experience.
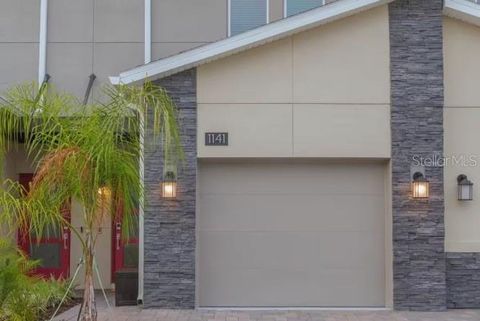
Active
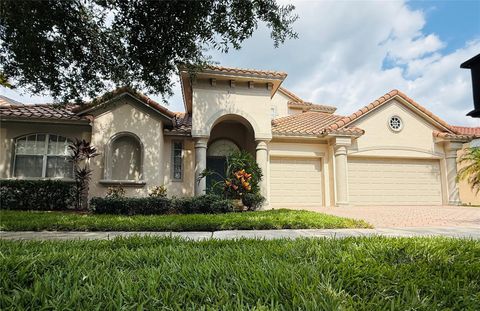
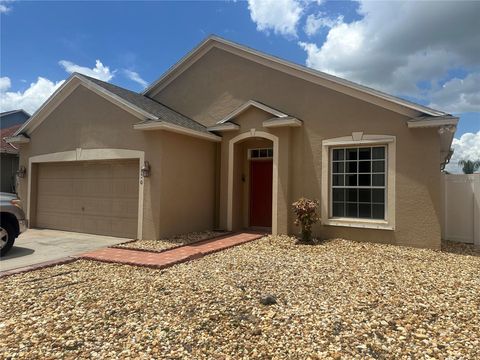
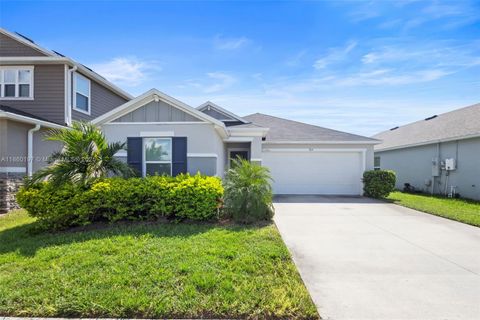
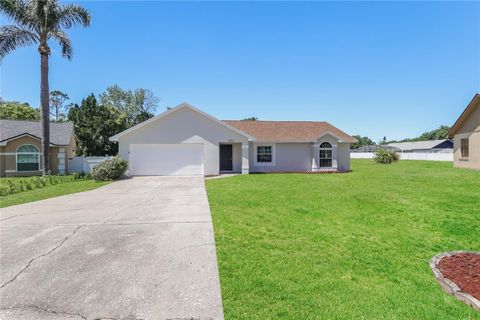
$365,000
3
bds
|
2
ba
|
1,787
sqft
|
built
2021
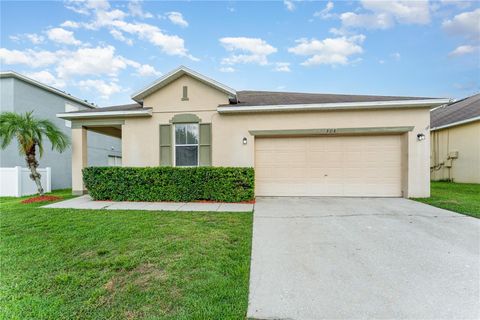
1141 Drop Ln, Davenport, FL 33896
$-953
Cash flow
-13.6%
Cash-on-Cash Return
3.0%
Cap rate
0.6%
Rent to Value Ratio
Active
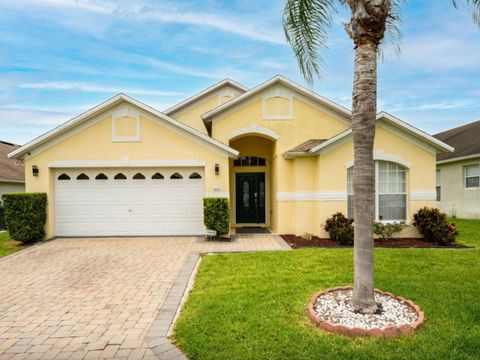
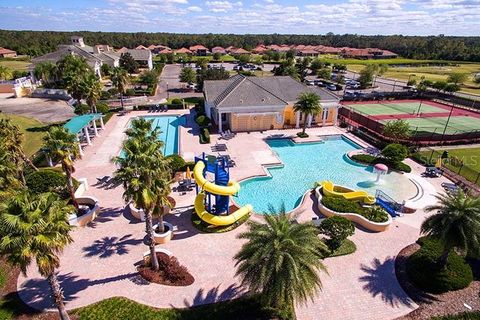
$595,900
6
bds
|
6
ba
|
0
sqft
|
built
2016
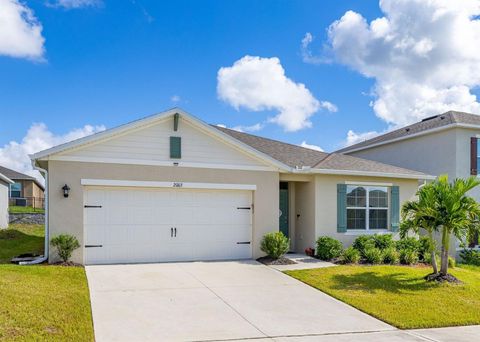
381 Cabello Dr, Davenport, FL 33837
$-1,434
Cash flow
-12.6%
Cash-on-Cash Return
3.3%
Cap rate
0.6%
Rent to Value Ratio
Active
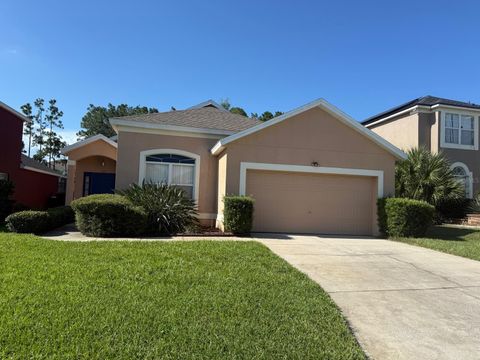
$355,000
4
bds
|
2
ba
|
1,848
sqft
|
built
2023
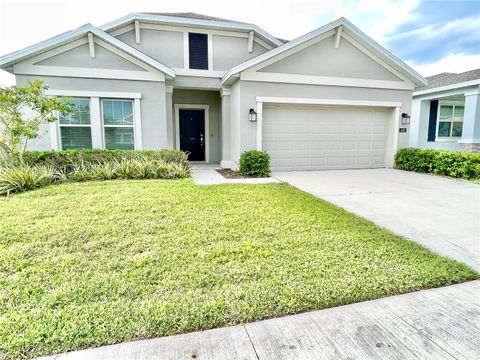
648 Daring Dr, Davenport, FL 33837
$-635
Cash flow
-9.3%
Cash-on-Cash Return
4.0%
Cap rate
0.7%
Rent to Value Ratio
Active
$400,000
4
bds
|
2
ba
|
1,604
sqft
|
built
2008
3014 Bella Vista Dr, Davenport, FL 33897
$-1,251
Cash flow
-16.3%
Cash-on-Cash Return
2.4%
Cap rate
0.5%
Rent to Value Ratio
Active
$295,000
3
bds
|
2
ba
|
1,185
sqft
|
built
1999
212 Eckerd St, Davenport, FL 33837
$-470
Cash flow
-8.3%
Cash-on-Cash Return
4.2%
Cap rate
0.7%
Rent to Value Ratio
Active
$265,000
3
bds
|
3
ba
|
1,621
sqft
|
built
2019
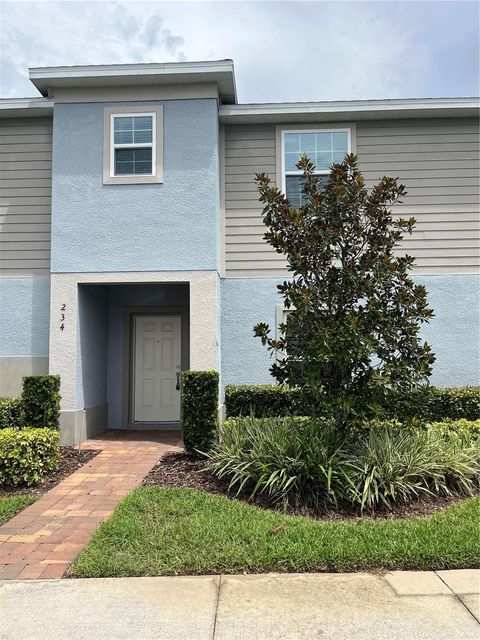
234 Annabelle Way, Davenport, FL 33837
$-506
Cash flow
-10.0%
Cash-on-Cash Return
3.9%
Cap rate
0.8%
Rent to Value Ratio
Active
$328,000
5
bds
|
4
ba
|
1,825
sqft
|
built
2005
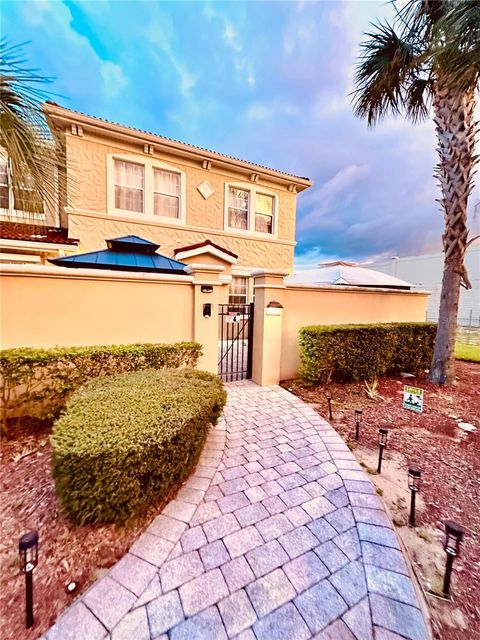
504 Sunset View Dr, Davenport, FL 33837
$-569
Cash flow
-9.1%
Cash-on-Cash Return
4.1%
Cap rate
0.7%
Rent to Value Ratio
Active
$499,990
4
bds
|
3
ba
|
2,582
sqft
|
built
2004
518 Grand Reserve Dr, Davenport, FL 33837
$-714
Cash flow
-7.5%
Cash-on-Cash Return
4.4%
Cap rate
0.6%
Rent to Value Ratio
Active
$800,000
4
bds
|
5
ba
|
4,307
sqft
|
built
2006
488 Chelsea Ave, Davenport, FL 33837
$-2,447
Cash flow
-16.0%
Cash-on-Cash Return
2.5%
Cap rate
0.4%
Rent to Value Ratio
Active
$415,000
4
bds
|
3
ba
|
1,915
sqft
|
built
2005
641 Old Bridge Cir, Davenport, FL 33897
$-809
Cash flow
-10.2%
Cash-on-Cash Return
3.8%
Cap rate
0.6%
Rent to Value Ratio
Active
$935,000
8
bds
|
6
ba
|
4,036
sqft
|
built
2022
3520 Lavender Dr, Davenport, FL 33897
$-3,344
Cash flow
-18.7%
Cash-on-Cash Return
1.9%
Cap rate
0.5%
Rent to Value Ratio
Active
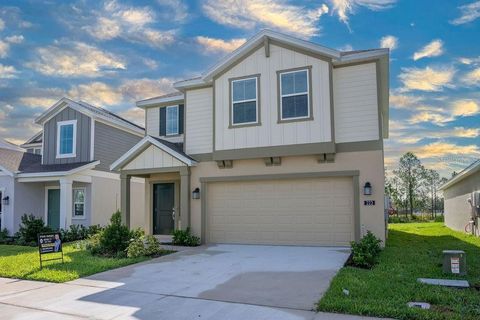
$513,000
5
bds
|
5
ba
|
2,283
sqft
|
built
2021
207 Jetty Way, Davenport, FL 33897
$-1,446
Cash flow
-14.7%
Cash-on-Cash Return
2.8%
Cap rate
0.7%
Rent to Value Ratio
Active
$433,000
3
bds
|
4
ba
|
2,205
sqft
|
built
2022
175 Villa Domani Cir, Davenport, FL 33896
$-842
Cash flow
-10.1%
Cash-on-Cash Return
3.8%
Cap rate
0.7%
Rent to Value Ratio
Active
$389,900
4
bds
|
3
ba
|
1,562
sqft
|
built
1999
325 Grosvenor Loop, Davenport, FL 33897
$-751
Cash flow
-10.0%
Cash-on-Cash Return
3.8%
Cap rate
0.6%
Rent to Value Ratio
Active
$489,990
4
bds
|
3
ba
|
2,522
sqft
|
built
2017
4628 Cortland Dr, Davenport, FL 33837
$-1,135
Cash flow
-12.1%
Cash-on-Cash Return
3.4%
Cap rate
0.6%
Rent to Value Ratio
Active
$435,000
4
bds
|
2
ba
|
1,931
sqft
|
built
2023
223 Brave Rd, Davenport, FL 33837
$-1,034
Cash flow
-12.4%
Cash-on-Cash Return
3.3%
Cap rate
0.6%
Rent to Value Ratio
Active
$355,000
3
bds
|
2
ba
|
1,684
sqft
|
built
2014
100 Bridgeford Crossing Blvd, Davenport, FL 33837
$-670
Cash flow
-9.8%
Cash-on-Cash Return
3.9%
Cap rate
0.6%
Rent to Value Ratio
Active
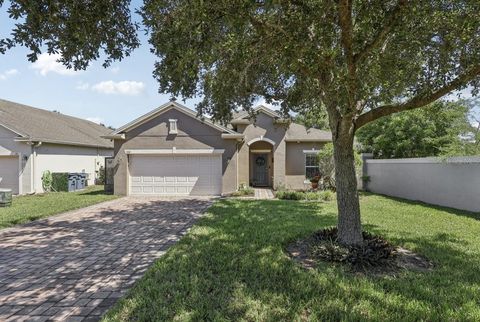
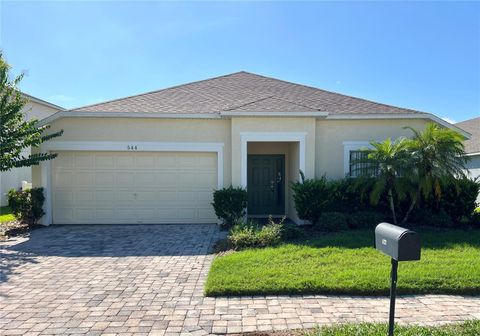
$409,990
5
bds
|
3
ba
|
2,013
sqft
|
built
2001
544 Balmoral Dr, Davenport, FL 33896
$-834
Cash flow
-10.6%
Cash-on-Cash Return
3.7%
Cap rate
0.7%
Rent to Value Ratio
Active
$430,000
5
bds
|
4
ba
|
2,376
sqft
|
built
1999
302 Julliard Blvd, Davenport, FL 33897
$-579
Cash flow
-7.0%
Cash-on-Cash Return
4.5%
Cap rate
0.7%
Rent to Value Ratio
Active
$325,000
3
bds
|
2
ba
|
1,690
sqft
|
built
2019
3342 Sonder Dr, Davenport, FL 33896
$-554
Cash flow
-8.9%
Cash-on-Cash Return
4.1%
Cap rate
0.7%
Rent to Value Ratio
Active
$315,000
3
bds
|
2
ba
|
1,403
sqft
|
built
2004
330 Graystone Blvd, Davenport, FL 33837
$-598
Cash flow
-9.9%
Cash-on-Cash Return
3.9%
Cap rate
0.6%
Rent to Value Ratio
Active
$445,000
4
bds
|
3
ba
|
1,922
sqft
|
built
2009
698 Brookeshire Dr, Davenport, FL 33837
$-1,076
Cash flow
-12.6%
Cash-on-Cash Return
3.2%
Cap rate
0.6%
Rent to Value Ratio
Active
$450,000
3
bds
|
2
ba
|
0
sqft
|
built
2023
9100 Oscraft Dr, Davenport, FL 33896
$-1,157
Cash flow
-13.4%
Cash-on-Cash Return
3.1%
Cap rate
0.6%
Rent to Value Ratio
Active
$415,000
3
bds
|
2
ba
|
1,896
sqft
|
built
2004
326 Elderberry Dr, Davenport, FL 33897
$-777
Cash flow
-9.8%
Cash-on-Cash Return
3.9%
Cap rate
0.6%
Rent to Value Ratio
Active
$450,000
3
bds
|
2
ba
|
0
sqft
|
built
2023
915 Overpool Ave, Davenport, FL 33896
$-1,226
Cash flow
-14.2%
Cash-on-Cash Return
2.9%
Cap rate
0.5%
Rent to Value Ratio
Active
$350,000
4
bds
|
2
ba
|
1,611
sqft
|
built
2001
525 Corvina Dr, Davenport, FL 33897
$-423
Cash flow
-6.3%
Cash-on-Cash Return
4.7%
Cap rate
0.7%
Rent to Value Ratio
Active
$985,000
9
bds
|
5
ba
|
3,909
sqft
|
built
2014
1424 Wexford Way, Davenport, FL 33896
$-3,703
Cash flow
-19.6%
Cash-on-Cash Return
1.6%
Cap rate
0.4%
Rent to Value Ratio
Active
$310,000
3
bds
|
3
ba
|
1,724
sqft
|
built
2019
440 Arbor Lakes Dr, Davenport, FL 33896
$-442
Cash flow
-7.4%
Cash-on-Cash Return
4.4%
Cap rate
0.7%
Rent to Value Ratio
Active
$350,000
3
bds
|
2
ba
|
1,608
sqft
|
built
1990
177 Tortuga Ct, Davenport, FL 33837
$-658
Cash flow
-9.8%
Cash-on-Cash Return
3.9%
Cap rate
0.6%
Rent to Value Ratio
Active
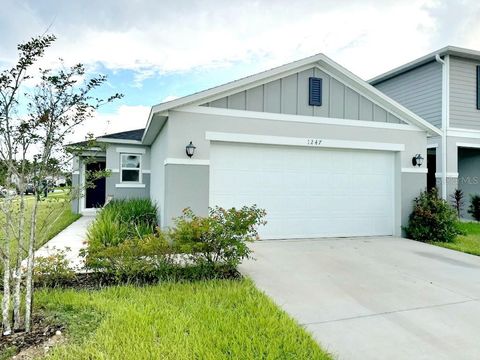
$389,000
3
bds
|
2
ba
|
1,512
sqft
|
built
2023
1247 Papaya Cir, Davenport, FL 33897
$-672
Cash flow
-9.0%
Cash-on-Cash Return
4.1%
Cap rate
0.6%
Rent to Value Ratio
Active
$315,000
4
bds
|
3
ba
|
1,664
sqft
|
built
2002
207 Orchid Dr, Davenport, FL 33897
$-912
Cash flow
-15.1%
Cash-on-Cash Return
2.7%
Cap rate
0.6%
Rent to Value Ratio
Active
$179,000
3
bds
|
3
ba
|
1,217
sqft
|
built
2008
904 Charo Pkwy, Davenport, FL 33897
$-1,045
Cash flow
-30.5%
Cash-on-Cash Return
-0.9%
Cap rate
1.1%
Rent to Value Ratio
Active
$369,900
4
bds
|
3
ba
|
1,960
sqft
|
built
2005
308 Andover Dr, Davenport, FL 33897
$-550
Cash flow
-7.8%
Cash-on-Cash Return
4.4%
Cap rate
0.7%
Rent to Value Ratio
Active
$354,900
4
bds
|
2
ba
|
1,867
sqft
|
built
2022
2003 Chickasaw Blvd, Davenport, FL 33837
$-785
Cash flow
-11.5%
Cash-on-Cash Return
3.5%
Cap rate
0.7%
Rent to Value Ratio
Active
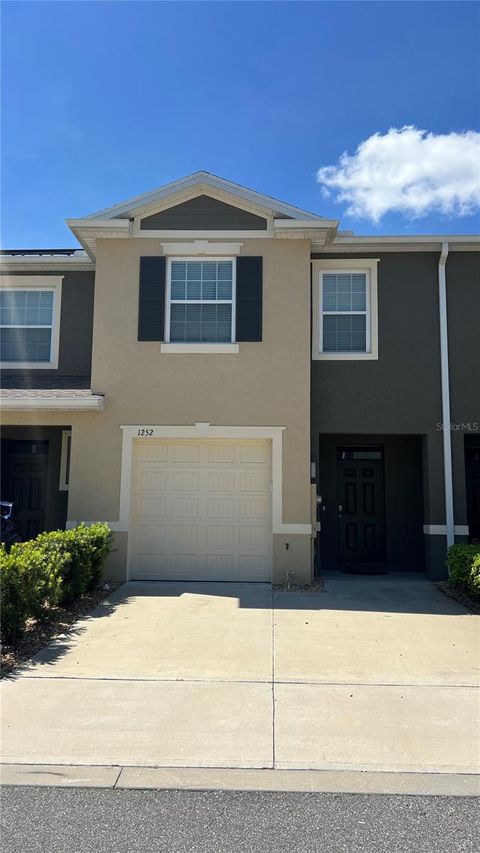
$279,990
3
bds
|
3
ba
|
1,673
sqft
|
built
2024
1252 Yellow Finch Dr, Davenport, FL 33837
$-671
Cash flow
-12.5%
Cash-on-Cash Return
3.3%
Cap rate
0.6%
Rent to Value Ratio
Active
$335,000
4
bds
|
2
ba
|
1,364
sqft
|
built
2005
340 Paradise Woods Pl, Davenport, FL 33896
$-631
Cash flow
-9.8%
Cash-on-Cash Return
3.9%
Cap rate
0.7%
Rent to Value Ratio
Active
$315,900
3
bds
|
2.5
ba
|
1,622
sqft
|
built
2018
1202 Conch Key Ln, Davenport, FL 33837
$-348
Cash flow
-5.7%
Cash-on-Cash Return
4.8%
Cap rate
0.7%
Rent to Value Ratio
Active
$360,000
5
bds
|
3
ba
|
1,825
sqft
|
built
2005
238 Sunset View Dr, Davenport, FL 33837
$-494
Cash flow
-7.2%
Cash-on-Cash Return
4.5%
Cap rate
0.7%
Rent to Value Ratio