Davenport, FL Investment Properties for Sale
Browse homes for sale and investment properties in Davenport, FL. Refine your search by price, property type, or more.
Best cash flowing properties in Davenport, FL
Active
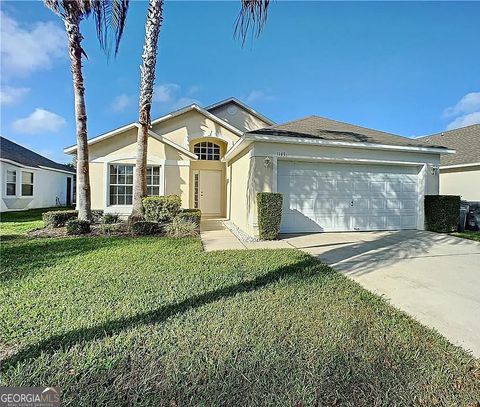
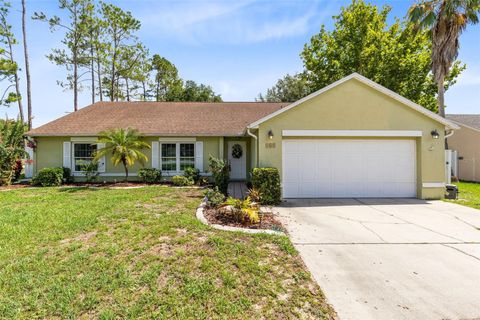
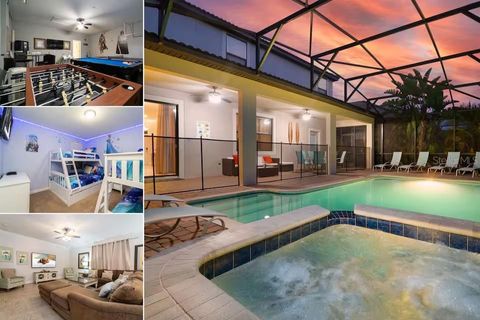
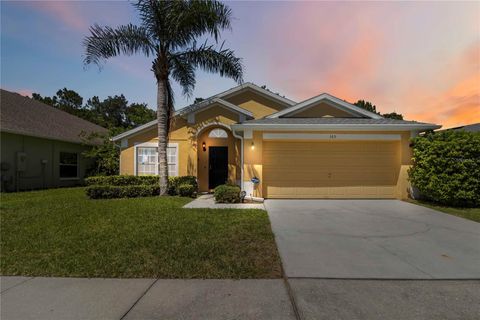
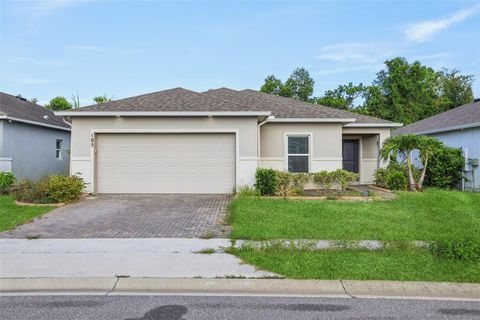
$190,000
4
bds
|
0
ba
|
1,402
sqft
|
built
2000
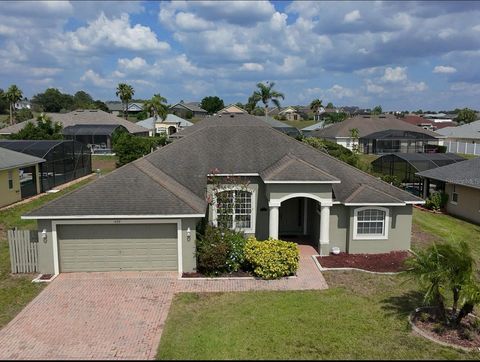
1143 Casterton Cir, Davenport, FL 33897
$457
Cash flow
12.5%
Cash-on-Cash Return
9.0%
Cap rate
1.3%
Rent to Value Ratio
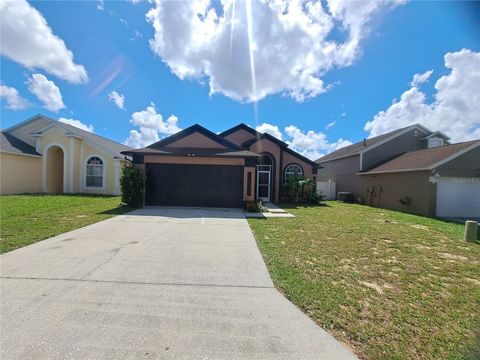
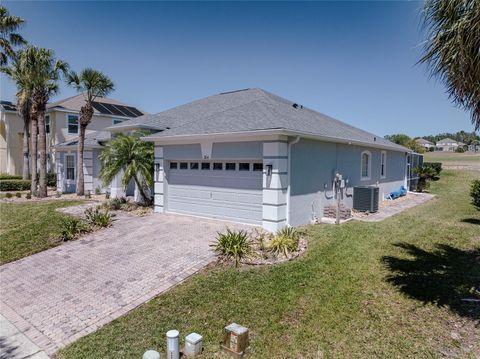
Active
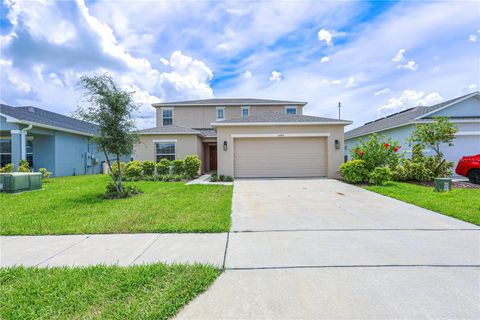
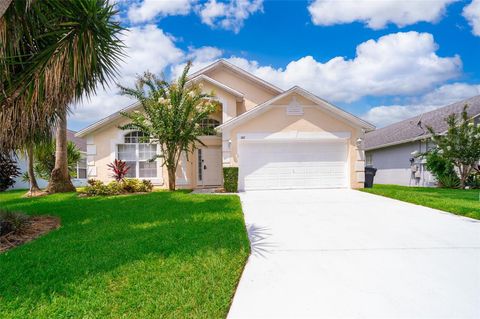
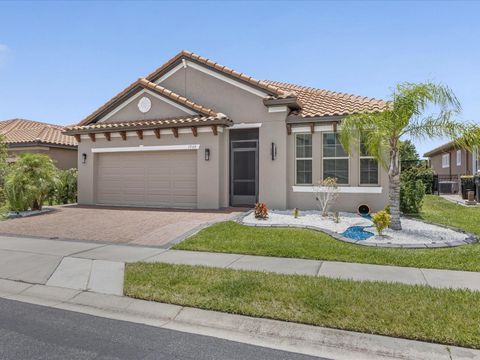
$285,000
3
bds
|
2
ba
|
1,374
sqft
|
built
2005
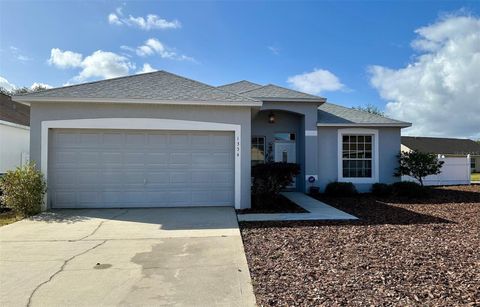
506 Nicholson Dr, Davenport, FL 33837
$-291
Cash flow
-5.3%
Cash-on-Cash Return
4.9%
Cap rate
0.7%
Rent to Value Ratio
806 out of 813 properties for sale in Davenport, FL
Limited Results Shown
Create a free account, or log in to reveal all property listings and enjoy the complete experience.
Active
$190,000
4
bds
|
0
ba
|
1,402
sqft
|
built
2000
1143 Casterton Cir, Davenport, FL 33897
$457
Cash flow
12.5%
Cash-on-Cash Return
9.0%
Cap rate
1.3%
Rent to Value Ratio
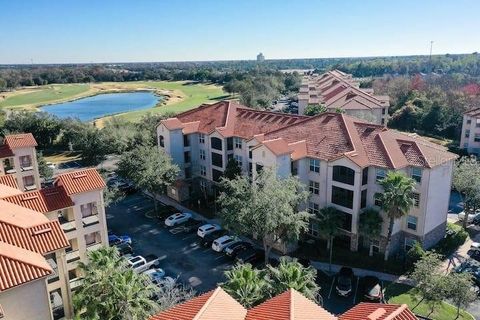
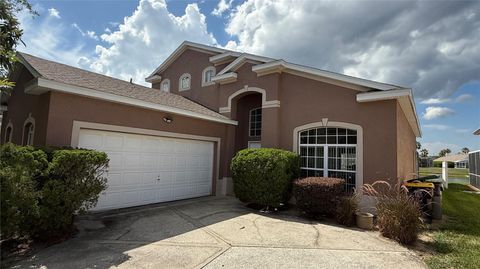
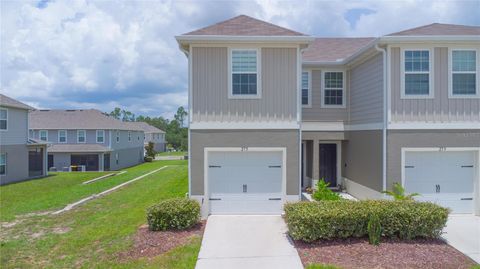
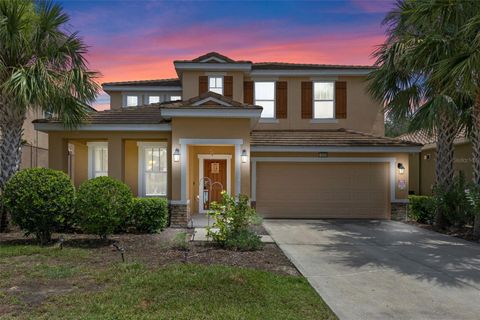
Active
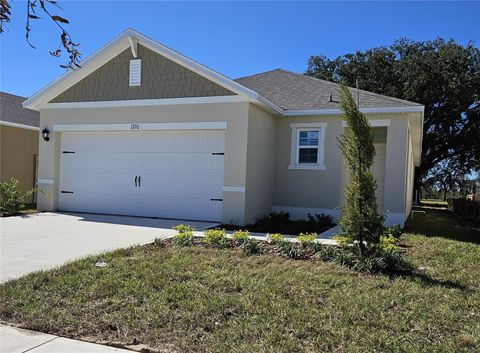
$265,000
3
bds
|
2
ba
|
1,244
sqft
|
built
2008
1301 Tuscan Ter, Davenport, FL 33896
$-794
Cash flow
-15.6%
Cash-on-Cash Return
2.5%
Cap rate
0.8%
Rent to Value Ratio
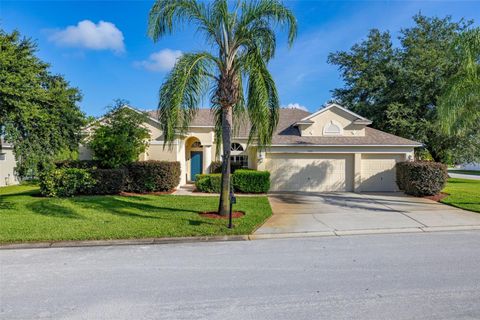
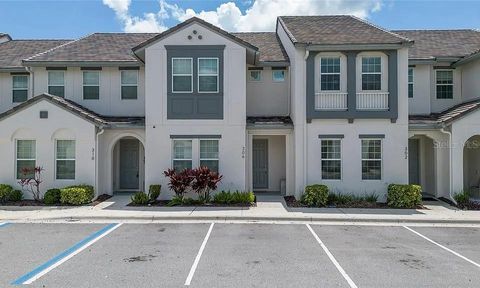
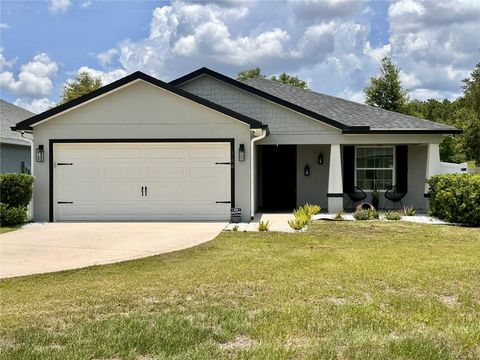
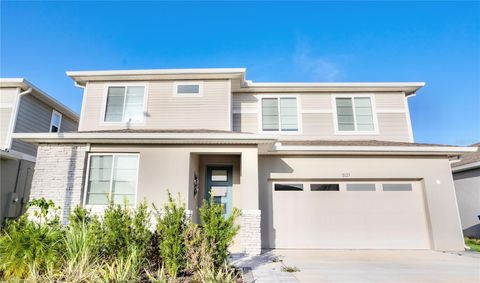
Active
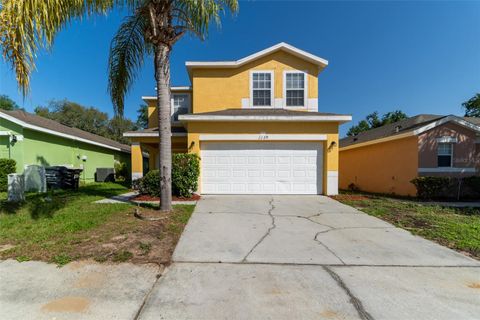
$490,000
4
bds
|
3
ba
|
2,583
sqft
|
built
2003
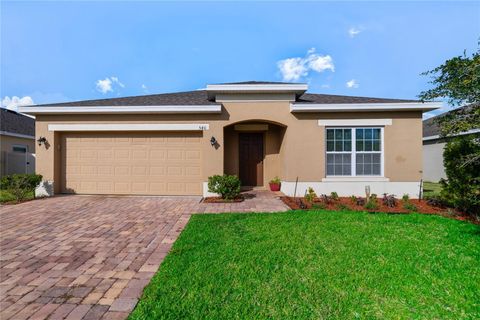
305 Grand Reserve Dr, Davenport, FL 33837
$-690
Cash flow
-7.3%
Cash-on-Cash Return
4.5%
Cap rate
0.7%
Rent to Value Ratio
Active
$365,900
4
bds
|
2
ba
|
1,807
sqft
|
built
2023
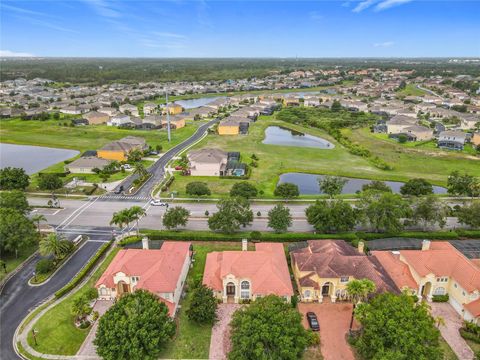
1168 Citrus Landings Blvd, Davenport, FL 33837
$-943
Cash flow
-13.4%
Cash-on-Cash Return
3.1%
Cap rate
0.6%
Rent to Value Ratio
Active
$379,000
3
bds
|
2
ba
|
1,732
sqft
|
built
2020
8990 Ace Loop, Davenport, FL 33896
$-1,463
Cash flow
-20.1%
Cash-on-Cash Return
1.5%
Cap rate
0.7%
Rent to Value Ratio
Active
$349,900
4
bds
|
2
ba
|
1,867
sqft
|
built
2020
633 Greymount St, Davenport, FL 33837
$-731
Cash flow
-10.9%
Cash-on-Cash Return
3.6%
Cap rate
0.7%
Rent to Value Ratio
Active
$360,000
4
bds
|
2
ba
|
1,698
sqft
|
built
2021
220 Foxtail Loop, Davenport, FL 33837
$-691
Cash flow
-10.0%
Cash-on-Cash Return
3.8%
Cap rate
0.7%
Rent to Value Ratio
Active
$374,900
3
bds
|
2
ba
|
1,711
sqft
|
built
1993
204 Grovepark Dr, Davenport, FL 33837
$-602
Cash flow
-8.4%
Cash-on-Cash Return
4.2%
Cap rate
0.7%
Rent to Value Ratio
Active
$285,000
3
bds
|
2
ba
|
1,374
sqft
|
built
2005
506 Nicholson Dr, Davenport, FL 33837
$-291
Cash flow
-5.3%
Cash-on-Cash Return
4.9%
Cap rate
0.7%
Rent to Value Ratio
Active
$448,000
5
bds
|
3
ba
|
2,396
sqft
|
built
2021
5345 Tuscany Ln, Davenport, FL 33897
$-955
Cash flow
-11.1%
Cash-on-Cash Return
3.6%
Cap rate
0.6%
Rent to Value Ratio
Active
$459,900
5
bds
|
3
ba
|
2,376
sqft
|
built
1999
513 Bailey Cir, Davenport, FL 33897
$-824
Cash flow
-9.3%
Cash-on-Cash Return
4.0%
Cap rate
0.7%
Rent to Value Ratio
Active
$444,900
4
bds
|
5
ba
|
2,094
sqft
|
built
2016
306 Captiva Dr, Davenport, FL 33896
$-1,184
Cash flow
-13.9%
Cash-on-Cash Return
3.0%
Cap rate
0.6%
Rent to Value Ratio
Active
$499,000
4
bds
|
3
ba
|
2,161
sqft
|
built
2004
458 Moscato Dr, Davenport, FL 33897
$-1,082
Cash flow
-11.3%
Cash-on-Cash Return
3.5%
Cap rate
0.6%
Rent to Value Ratio
Active
$415,000
5
bds
|
3
ba
|
1,825
sqft
|
built
2005
1354 Knollwood Dr, Davenport, FL 33837
$-833
Cash flow
-10.5%
Cash-on-Cash Return
3.7%
Cap rate
0.6%
Rent to Value Ratio
Active
$344,997
4
bds
|
2
ba
|
1,972
sqft
|
built
2016
540 Vitoria Rd, Davenport, FL 33837
$-619
Cash flow
-9.4%
Cash-on-Cash Return
4.0%
Cap rate
0.7%
Rent to Value Ratio
Active
$690,000
4
bds
|
4
ba
|
4,034
sqft
|
built
2007
2209 Callaway Ct, Davenport, FL 33837
$-2,123
Cash flow
-16.1%
Cash-on-Cash Return
2.5%
Cap rate
0.5%
Rent to Value Ratio
Active
$589,900
5
bds
|
5
ba
|
2,842
sqft
|
built
2013
1452 Moon Valley Dr, Davenport, FL 33896
$-1,789
Cash flow
-15.8%
Cash-on-Cash Return
2.5%
Cap rate
0.6%
Rent to Value Ratio
Active
$539,500
5
bds
|
3
ba
|
2,370
sqft
|
built
2004
204 Birkdale St, Davenport, FL 33897
$-1,069
Cash flow
-10.3%
Cash-on-Cash Return
3.8%
Cap rate
0.6%
Rent to Value Ratio
Active
$310,000
3
bds
|
2
ba
|
1,413
sqft
|
built
2022
275 Blueberry Ln, Davenport, FL 33837
$-537
Cash flow
-9.0%
Cash-on-Cash Return
4.1%
Cap rate
0.7%
Rent to Value Ratio
Active
$349,900
3
bds
|
2
ba
|
1,566
sqft
|
built
2021
144 Foxtail Loop, Davenport, FL 33837
$-715
Cash flow
-10.7%
Cash-on-Cash Return
3.7%
Cap rate
0.6%
Rent to Value Ratio
Active
$589,990
5
bds
|
4
ba
|
2,496
sqft
|
built
2004
408 Bloomingdale Dr, Davenport, FL 33897
$-1,412
Cash flow
-12.5%
Cash-on-Cash Return
3.3%
Cap rate
0.5%
Rent to Value Ratio
Active
$335,000
3
bds
|
2
ba
|
1,450
sqft
|
built
2021
264 Fiddlewood Ct, Davenport, FL 33837
$-554
Cash flow
-8.6%
Cash-on-Cash Return
4.2%
Cap rate
0.7%
Rent to Value Ratio
Active
$429,000
4
bds
|
4
ba
|
2,067
sqft
|
built
2007
477 Orange Cosmos Blvd, Davenport, FL 33837
$-1,221
Cash flow
-14.8%
Cash-on-Cash Return
2.7%
Cap rate
0.7%
Rent to Value Ratio
Active
$405,000
4
bds
|
2
ba
|
1,999
sqft
|
built
1997
204 Canary Island Cir, Davenport, FL 33837
$-821
Cash flow
-10.6%
Cash-on-Cash Return
3.7%
Cap rate
0.6%
Rent to Value Ratio

Active
$545,000
5
bds
|
4
ba
|
2,813
sqft
|
built
2004
160 Calabay Parc Blvd, Davenport, FL 33897
$-1,302
Cash flow
-12.5%
Cash-on-Cash Return
3.3%
Cap rate
0.5%
Rent to Value Ratio
Active
$399,999
5
bds
|
3
ba
|
1,662
sqft
|
built
2005
165 Scrub Jay Way, Davenport, FL 33896
$-804
Cash flow
-10.5%
Cash-on-Cash Return
3.7%
Cap rate
0.6%
Rent to Value Ratio
Active
$426,000
4
bds
|
3
ba
|
1,905
sqft
|
built
2000
207 Langham Dr, Davenport, FL 33897
$-774
Cash flow
-9.5%
Cash-on-Cash Return
4.0%
Cap rate
0.7%
Rent to Value Ratio
Active
$538,000
5
bds
|
5
ba
|
2,751
sqft
|
built
2015
5172 Oakbourne Ave, Davenport, FL 33837
$-895
Cash flow
-8.7%
Cash-on-Cash Return
4.2%
Cap rate
0.7%
Rent to Value Ratio
Active
$489,900
5
bds
|
4
ba
|
3,090
sqft
|
built
2022
1023 Sugarwood St, Davenport, FL 33837
$-1,155
Cash flow
-12.3%
Cash-on-Cash Return
3.3%
Cap rate
0.7%
Rent to Value Ratio
Active
$400,000
3
bds
|
2
ba
|
1,842
sqft
|
built
2018
185 Hamlet Loop, Davenport, FL 33837
$-902
Cash flow
-11.8%
Cash-on-Cash Return
3.4%
Cap rate
0.6%
Rent to Value Ratio
Active
$347,999
3
bds
|
2
ba
|
1,516
sqft
|
built
2023
1370 Holodak Dr, Davenport, FL 33837
$-864
Cash flow
-13.0%
Cash-on-Cash Return
3.2%
Cap rate
0.7%
Rent to Value Ratio
Active
$525,000
4
bds
|
3
ba
|
2,105
sqft
|
built
2018
1709 Benoit Ter, Davenport, FL 33837
$-1,370
Cash flow
-13.6%
Cash-on-Cash Return
3.0%
Cap rate
0.5%
Rent to Value Ratio
Active
$395,000
4
bds
|
4
ba
|
1,502
sqft
|
built
2005
1129 Royal Ridge Dr, Davenport, FL 33896
$-1,397
Cash flow
-18.5%
Cash-on-Cash Return
1.9%
Cap rate
0.5%
Rent to Value Ratio
Active
$425,000
4
bds
|
3
ba
|
2,027
sqft
|
built
2016
4928 Cortland Dr, Davenport, FL 33837
$-798
Cash flow
-9.8%
Cash-on-Cash Return
3.9%
Cap rate
0.6%
Rent to Value Ratio
Active
$3,200,000
6
bds
|
5
ba
|
4,223
sqft
|
built
2022
1702 Hidden Palms Dr, Davenport, FL 33897
$-14,860
Cash flow
-24.2%
Cash-on-Cash Return
0.6%
Cap rate
0.1%
Rent to Value Ratio
Active
$250,000
4
bds
|
3
ba
|
1,492
sqft
|
built
2003
226 Verona Pl, Davenport, FL 33897
$-665
Cash flow
-13.9%
Cash-on-Cash Return
3.0%
Cap rate
0.9%
Rent to Value Ratio
Active
$309,000
3
bds
|
2
ba
|
1,455
sqft
|
built
2005
130 Winsor Ave, Davenport, FL 33837
$-476
Cash flow
-8.0%
Cash-on-Cash Return
4.3%
Cap rate
0.7%
Rent to Value Ratio
Active
$524,900
5
bds
|
5
ba
|
3,367
sqft
|
built
2013
256 Yellow Snapdragon Dr, Davenport, FL 33837
$-1,066
Cash flow
-10.6%
Cash-on-Cash Return
3.7%
Cap rate
0.7%
Rent to Value Ratio
Active
$375,000
3
bds
|
2
ba
|
1,312
sqft
|
built
1997
144 Bridgeton St, Davenport, FL 33896
$-606
Cash flow
-8.4%
Cash-on-Cash Return
4.2%
Cap rate
0.7%
Rent to Value Ratio
Active
$540,000
5
bds
|
5
ba
|
2,777
sqft
|
built
2016
5368 Oakbourne Ave, Davenport, FL 33837
$-1,403
Cash flow
-13.6%
Cash-on-Cash Return
3.0%
Cap rate
0.7%
Rent to Value Ratio