Davenport, FL Investment Properties for Sale
Browse homes for sale and investment properties in Davenport, FL. Refine your search by price, property type, or more.
Best cash flowing properties in Davenport, FL
Active
$67,500
0
bds
|
1
ba
|
300
sqft
|
built
1999
43420 Highway 27, Davenport, FL 33837
$406
Cash flow
7.0%
Cash-on-Cash Return
7.2%
Cap rate
1.5%
Rent to Value Ratio
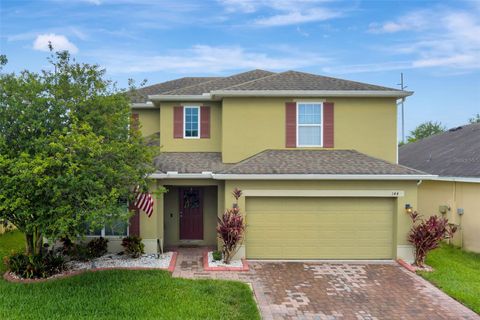
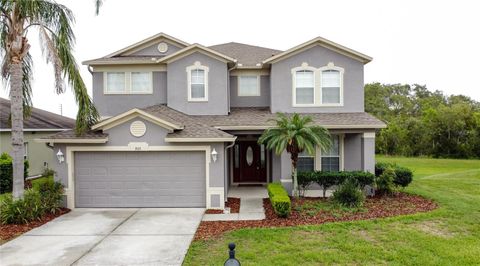
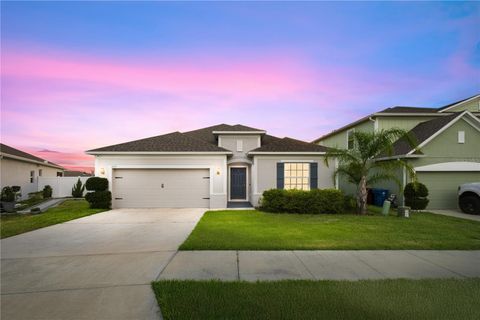
Active
$310,000
3
bds
|
2
ba
|
1,921
sqft
|
built
1955
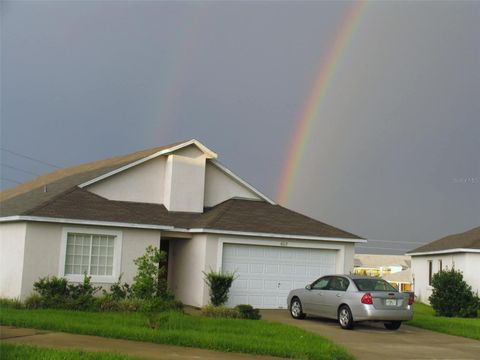
111 E Orange St, Davenport, FL 33837
$-143
Cash flow
-2.4%
Cash-on-Cash Return
5.6%
Cap rate
0.7%
Rent to Value Ratio
804 out of 811 properties for sale in Davenport, FL
Limited Results Shown
Create a free account, or log in to reveal all property listings and enjoy the complete experience.
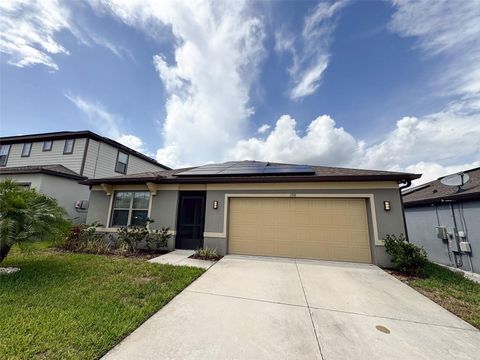
Active
$590,000
6
bds
|
5
ba
|
3,629
sqft
|
built
2016
391 Cabello Dr, Davenport, FL 33837
$-1,223
Cash flow
-10.8%
Cash-on-Cash Return
3.7%
Cap rate
0.7%
Rent to Value Ratio
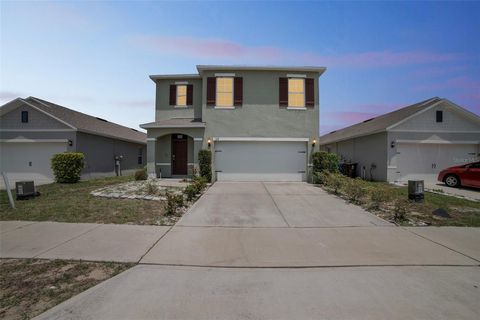
Active
$409,000
4
bds
|
3
ba
|
1,902
sqft
|
built
2017
9061 Dogleg Dr, Davenport, FL 33896
$-1,371
Cash flow
-17.5%
Cash-on-Cash Return
2.1%
Cap rate
0.7%
Rent to Value Ratio
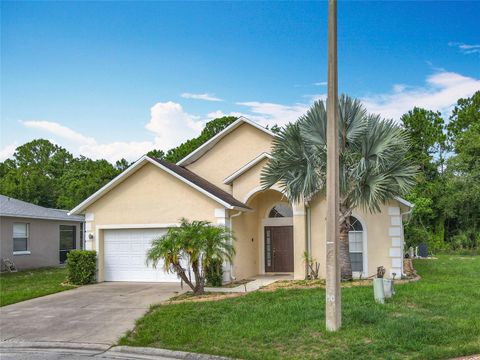
Active
$319,900
4
bds
|
2
ba
|
1,865
sqft
|
built
2020
398 Citrus Isle Loop, Davenport, FL 33837
$-611
Cash flow
-10.0%
Cash-on-Cash Return
3.9%
Cap rate
0.7%
Rent to Value Ratio
Active
$245,000
3
bds
|
3
ba
|
1,457
sqft
|
built
2005
130 Napoli Dr, Davenport, FL 33897
$-817
Cash flow
-17.4%
Cash-on-Cash Return
2.1%
Cap rate
0.8%
Rent to Value Ratio
Active
$389,900
5
bds
|
3
ba
|
2,522
sqft
|
built
2020
129 Eagleview Loop, Davenport, FL 33837
$-908
Cash flow
-12.2%
Cash-on-Cash Return
3.4%
Cap rate
0.7%
Rent to Value Ratio
Active
$389,900
4
bds
|
3
ba
|
1,780
sqft
|
built
2000
341 Whittier St, Davenport, FL 33896
$-724
Cash flow
-9.7%
Cash-on-Cash Return
3.9%
Cap rate
0.6%
Rent to Value Ratio
Active
$465,000
5
bds
|
4
ba
|
2,632
sqft
|
built
2016
144 Williamson Dr, Davenport, FL 33897
$-834
Cash flow
-9.4%
Cash-on-Cash Return
4.0%
Cap rate
0.6%
Rent to Value Ratio
Active
$425,000
4
bds
|
3
ba
|
2,460
sqft
|
built
2019
178 Aberdeen St, Davenport, FL 33896
$-771
Cash flow
-9.5%
Cash-on-Cash Return
4.0%
Cap rate
0.6%
Rent to Value Ratio
Active
$425,000
5
bds
|
4
ba
|
2,376
sqft
|
built
2004
824 Bloomingdale Dr, Davenport, FL 33897
$-726
Cash flow
-8.9%
Cash-on-Cash Return
4.1%
Cap rate
0.7%
Rent to Value Ratio
Active
$415,000
4
bds
|
3
ba
|
1,905
sqft
|
built
2002
318 Langham Dr, Davenport, FL 33897
$-855
Cash flow
-10.7%
Cash-on-Cash Return
3.7%
Cap rate
0.6%
Rent to Value Ratio
Active
$410,000
5
bds
|
4
ba
|
2,345
sqft
|
built
2007
426 Cadiz Loop, Davenport, FL 33837
$-660
Cash flow
-8.4%
Cash-on-Cash Return
4.2%
Cap rate
0.7%
Rent to Value Ratio
Active
$310,000
3
bds
|
2
ba
|
1,921
sqft
|
built
1955
111 E Orange St, Davenport, FL 33837
$-143
Cash flow
-2.4%
Cash-on-Cash Return
5.6%
Cap rate
0.7%
Rent to Value Ratio
Active
$305,000
3
bds
|
3
ba
|
1,646
sqft
|
built
2018
212 Primrose Dr, Davenport, FL 33837
$-654
Cash flow
-11.2%
Cash-on-Cash Return
3.6%
Cap rate
0.8%
Rent to Value Ratio
Active
$387,500
4
bds
|
3
ba
|
1,854
sqft
|
built
2000
5604 Loma Vista Dr W, Davenport, FL 33896
$-689
Cash flow
-9.3%
Cash-on-Cash Return
4.0%
Cap rate
0.6%
Rent to Value Ratio
Active
$368,000
4
bds
|
3
ba
|
2,120
sqft
|
built
2022
417 Tisone Ln, Davenport, FL 33837
$-742
Cash flow
-10.5%
Cash-on-Cash Return
3.7%
Cap rate
0.7%
Rent to Value Ratio
Active
$415,000
3
bds
|
3
ba
|
2,160
sqft
|
built
2022
1754 Sanibel Dr, Davenport, FL 33896
$-928
Cash flow
-11.7%
Cash-on-Cash Return
3.5%
Cap rate
0.7%
Rent to Value Ratio
Active
$360,000
3
bds
|
2
ba
|
1,527
sqft
|
built
1995
906 Berwick Dr, Davenport, FL 33897
$-260
Cash flow
-3.8%
Cash-on-Cash Return
5.3%
Cap rate
0.7%
Rent to Value Ratio
Active
$470,000
4
bds
|
3
ba
|
2,330
sqft
|
built
2005
226 Canna Dr, Davenport, FL 33897
$-674
Cash flow
-7.5%
Cash-on-Cash Return
4.4%
Cap rate
0.7%
Rent to Value Ratio
Active
$850,000
5
bds
|
4
ba
|
4,034
sqft
|
built
2008
2333 Pinehurst Ct, Davenport, FL 33837
$-2,142
Cash flow
-13.1%
Cash-on-Cash Return
3.1%
Cap rate
0.5%
Rent to Value Ratio
Active
$345,000
4
bds
|
2
ba
|
1,426
sqft
|
built
2001
602 Hillcrest Dr, Davenport, FL 33897
$-552
Cash flow
-8.3%
Cash-on-Cash Return
4.2%
Cap rate
0.7%
Rent to Value Ratio
Active
$243,900
3
bds
|
3
ba
|
1,364
sqft
|
built
2002
206 Orchid Dr, Davenport, FL 33897
$-364
Cash flow
-7.8%
Cash-on-Cash Return
4.4%
Cap rate
0.8%
Rent to Value Ratio
Active
$309,000
3
bds
|
3
ba
|
1,828
sqft
|
built
2018
1312 Royal St George Blvd, Davenport, FL 33896
$-887
Cash flow
-15.0%
Cash-on-Cash Return
2.7%
Cap rate
0.7%
Rent to Value Ratio
Active
$210,000
3
bds
|
2
ba
|
1,227
sqft
|
built
2005
110 Watling Way, Davenport, FL 33897
$-495
Cash flow
-12.3%
Cash-on-Cash Return
3.3%
Cap rate
1.0%
Rent to Value Ratio
Active
$415,000
4
bds
|
2
ba
|
1,802
sqft
|
built
1999
517 Westwind Dr, Davenport, FL 33896
$-744
Cash flow
-9.4%
Cash-on-Cash Return
4.0%
Cap rate
0.6%
Rent to Value Ratio
Active
$429,900
4
bds
|
3
ba
|
2,027
sqft
|
built
2015
2016 Lake Side Ave, Davenport, FL 33837
$-893
Cash flow
-10.8%
Cash-on-Cash Return
3.7%
Cap rate
0.6%
Rent to Value Ratio
Active
$425,000
4
bds
|
3
ba
|
2,571
sqft
|
built
2013
1394 Palmetto Dunes St, Davenport, FL 33896
$-1,571
Cash flow
-19.3%
Cash-on-Cash Return
1.7%
Cap rate
0.7%
Rent to Value Ratio
Active
$459,000
5
bds
|
4
ba
|
2,167
sqft
|
built
2021
1128 Challenger Ave, Davenport, FL 33897
$-1,245
Cash flow
-14.2%
Cash-on-Cash Return
2.9%
Cap rate
0.7%
Rent to Value Ratio
Active
$599,000
5
bds
|
4
ba
|
3,221
sqft
|
built
2008
805 Suffolk Pl, Davenport, FL 33896
$-1,252
Cash flow
-10.9%
Cash-on-Cash Return
3.6%
Cap rate
0.7%
Rent to Value Ratio
Active
$485,000
5
bds
|
3
ba
|
3,079
sqft
|
built
2012
3391 Cortland Dr, Davenport, FL 33837
$-765
Cash flow
-8.2%
Cash-on-Cash Return
4.3%
Cap rate
0.6%
Rent to Value Ratio
Active
$67,500
0
bds
|
1
ba
|
300
sqft
|
built
1999
43420 Highway 27, Davenport, FL 33837
$406
Cash flow
7.0%
Cash-on-Cash Return
7.2%
Cap rate
1.5%
Rent to Value Ratio
Active
$459,900
5
bds
|
4
ba
|
2,767
sqft
|
built
2007
315 Wildflower Rd, Davenport, FL 33837
$-727
Cash flow
-8.2%
Cash-on-Cash Return
4.3%
Cap rate
0.7%
Rent to Value Ratio
Active
$415,000
4
bds
|
2
ba
|
1,428
sqft
|
built
1996
703 Sunridge Woods Blvd, Davenport, FL 33837
$-815
Cash flow
-10.2%
Cash-on-Cash Return
3.8%
Cap rate
0.6%
Rent to Value Ratio
Active
$405,000
4
bds
|
3
ba
|
2,006
sqft
|
built
1997
925 Montana Ave, Davenport, FL 33897
$-581
Cash flow
-7.5%
Cash-on-Cash Return
4.4%
Cap rate
0.7%
Rent to Value Ratio
Active
$370,000
3
bds
|
2
ba
|
2,080
sqft
|
built
2003
442 Graystone Blvd, Davenport, FL 33837
$-472
Cash flow
-6.7%
Cash-on-Cash Return
4.6%
Cap rate
0.6%
Rent to Value Ratio
Active
$369,000
3
bds
|
2
ba
|
1,950
sqft
|
built
2007
126 San Carlo Rd, Davenport, FL 33896
$-755
Cash flow
-10.7%
Cash-on-Cash Return
3.7%
Cap rate
0.6%
Rent to Value Ratio
Active
$459,000
5
bds
|
4
ba
|
2,796
sqft
|
built
2023
2210 Derwent Dr, Davenport, FL 33896
$-774
Cash flow
-8.8%
Cash-on-Cash Return
4.1%
Cap rate
0.7%
Rent to Value Ratio
Active
$365,000
4
bds
|
2
ba
|
2,182
sqft
|
built
2021
622 Taft Dr, Davenport, FL 33837
$-849
Cash flow
-12.1%
Cash-on-Cash Return
3.4%
Cap rate
0.7%
Rent to Value Ratio
Active
$489,500
4
bds
|
3
ba
|
2,018
sqft
|
built
2001
802 Balmoral Dr, Davenport, FL 33896
$-1,449
Cash flow
-15.4%
Cash-on-Cash Return
2.6%
Cap rate
0.5%
Rent to Value Ratio
Active
$465,000
5
bds
|
4
ba
|
2,451
sqft
|
built
2005
257 Lancaster Dr, Davenport, FL 33897
$-805
Cash flow
-9.0%
Cash-on-Cash Return
4.1%
Cap rate
0.7%
Rent to Value Ratio
Active
$458,000
5
bds
|
3
ba
|
2,376
sqft
|
built
1999
553 Bailey Cir, Davenport, FL 33897
$-895
Cash flow
-10.2%
Cash-on-Cash Return
3.8%
Cap rate
0.6%
Rent to Value Ratio