Davenport, FL Investment Properties for Sale
Browse homes for sale and investment properties in Davenport, FL. Refine your search by price, property type, or more.
Best cash flowing properties in Davenport, FL
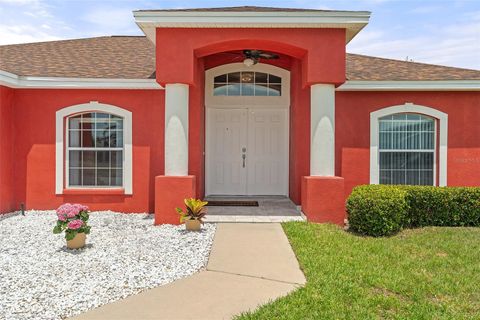
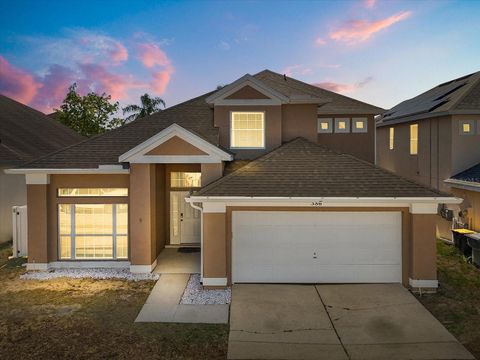
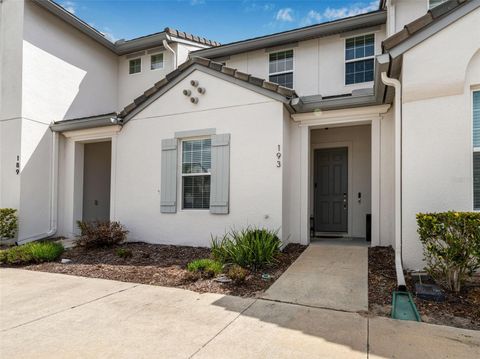
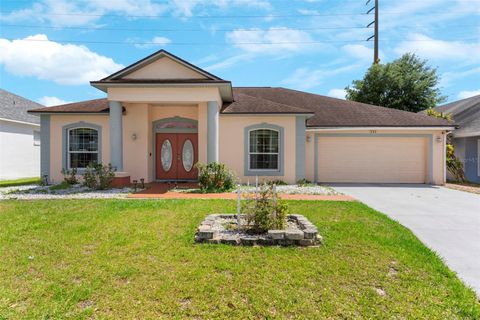
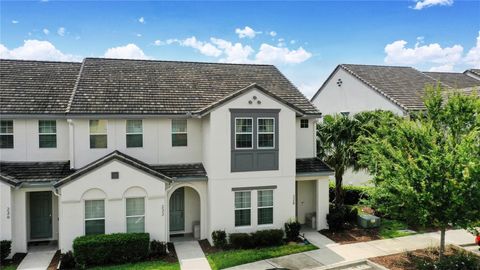
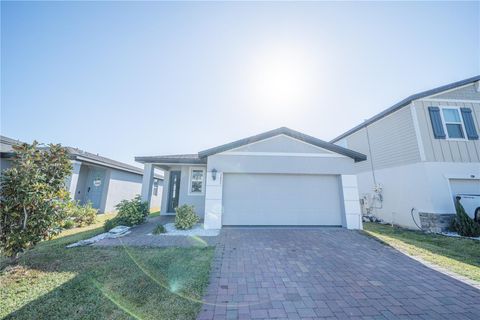
Active
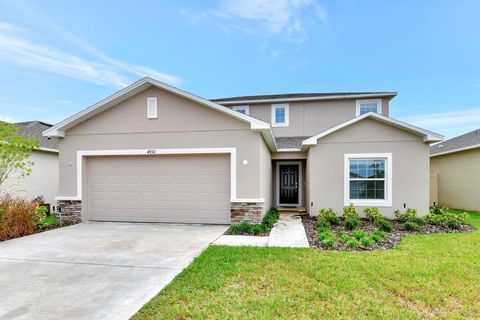
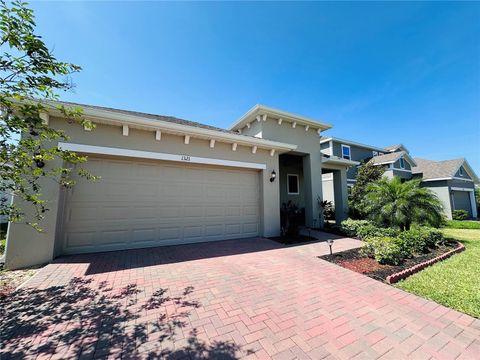
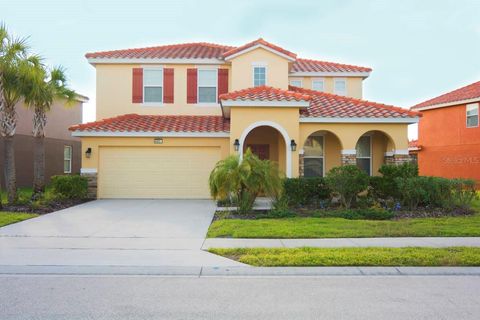
$334,900
4
bds
|
2
ba
|
1,760
sqft
|
built
2013
318 Highland Meadows Dr, Davenport, FL 33837
$-353
Cash flow
-5.5%
Cash-on-Cash Return
4.9%
Cap rate
0.7%
Rent to Value Ratio
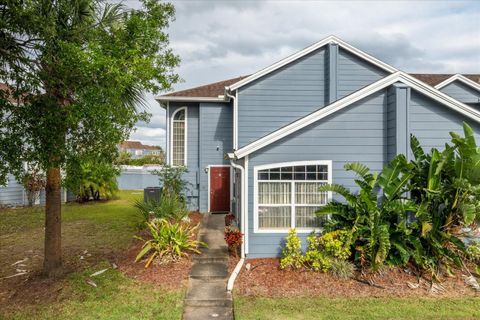
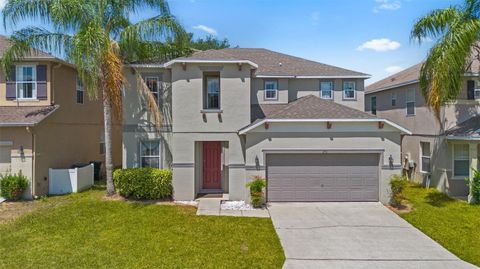
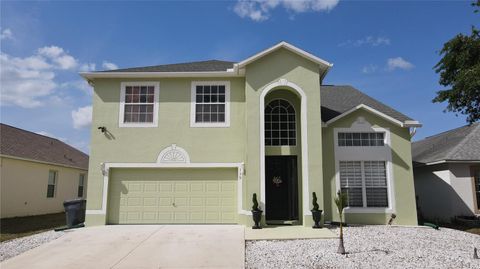
Active
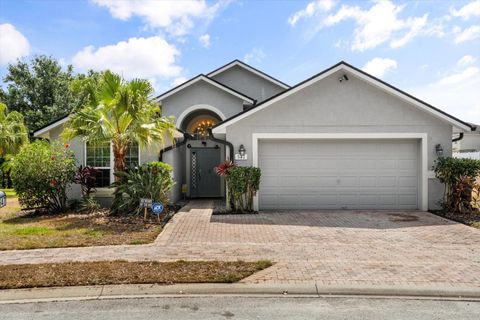
$279,000
4
bds
|
3
ba
|
1,748
sqft
|
built
2002
135 Orchid Dr, Davenport, FL 33897
$-441
Cash flow
-8.2%
Cash-on-Cash Return
4.2%
Cap rate
0.8%
Rent to Value Ratio
804 out of 811 properties for sale in Davenport, FL
Limited Results Shown
Create a free account, or log in to reveal all property listings and enjoy the complete experience.
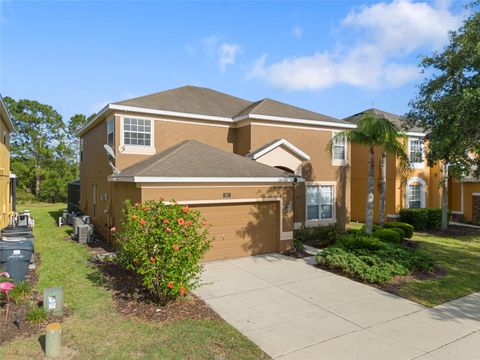
Active
$434,000
4
bds
|
4
ba
|
2,554
sqft
|
built
2008
957 Orange Cosmos Blvd, Davenport, FL 33837
$-962
Cash flow
-11.6%
Cash-on-Cash Return
3.5%
Cap rate
0.7%
Rent to Value Ratio
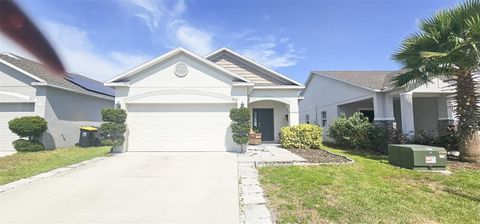
Active
$329,990
3
bds
|
2
ba
|
1,280
sqft
|
built
2021
853 Bocavista Ct, Davenport, FL 33896
$-649
Cash flow
-10.3%
Cash-on-Cash Return
3.8%
Cap rate
0.6%
Rent to Value Ratio
Active
$439,000
5
bds
|
3
ba
|
2,396
sqft
|
built
2022
4792 Vellacito Way, Davenport, FL 33897
$-1,064
Cash flow
-12.6%
Cash-on-Cash Return
3.2%
Cap rate
0.6%
Rent to Value Ratio
Active
$395,000
3
bds
|
2
ba
|
1,787
sqft
|
built
2020
703 Ocean Course Ave, Davenport, FL 33896
$-1,485
Cash flow
-19.6%
Cash-on-Cash Return
1.6%
Cap rate
0.6%
Rent to Value Ratio
Active
$299,990
3
bds
|
3
ba
|
1,692
sqft
|
built
2023
1089 Blue Jay Dr, Davenport, FL 33837
$-658
Cash flow
-11.4%
Cash-on-Cash Return
3.5%
Cap rate
0.7%
Rent to Value Ratio
Active
$408,000
4
bds
|
3
ba
|
1,844
sqft
|
built
2006
147 Bridgewater Dr, Davenport, FL 33897
$-723
Cash flow
-9.2%
Cash-on-Cash Return
4.0%
Cap rate
0.7%
Rent to Value Ratio
Active
$485,000
5
bds
|
4
ba
|
2,269
sqft
|
built
1998
386 Riggs Cir, Davenport, FL 33897
$-953
Cash flow
-10.3%
Cash-on-Cash Return
3.8%
Cap rate
0.6%
Rent to Value Ratio
Active
$283,700
3
bds
|
2
ba
|
1,893
sqft
|
built
2006
1288 Grady Ln, Davenport, FL 33896
$-827
Cash flow
-15.2%
Cash-on-Cash Return
2.6%
Cap rate
0.7%
Rent to Value Ratio
Active
$745,000
8
bds
|
5
ba
|
3,916
sqft
|
built
2019
303 Ocean Course Ave, Davenport, FL 33896
$-2,418
Cash flow
-16.9%
Cash-on-Cash Return
2.3%
Cap rate
0.6%
Rent to Value Ratio

Active
$355,000
4
bds
|
3
ba
|
1,817
sqft
|
built
1955
200 North Blvd W, Davenport, FL 33837
$-504
Cash flow
-7.4%
Cash-on-Cash Return
4.4%
Cap rate
0.6%
Rent to Value Ratio
Active
$495,000
4
bds
|
3
ba
|
2,214
sqft
|
built
2018
274 Brunswick Dr, Davenport, FL 33837
$-1,037
Cash flow
-10.9%
Cash-on-Cash Return
3.6%
Cap rate
0.6%
Rent to Value Ratio
Active
$413,000
3
bds
|
2
ba
|
1,771
sqft
|
built
2018
193 Captiva Dr, Davenport, FL 33896
$-1,252
Cash flow
-15.8%
Cash-on-Cash Return
2.5%
Cap rate
0.6%
Rent to Value Ratio
Active
$420,000
4
bds
|
3
ba
|
2,550
sqft
|
built
2005
253 Aldridge Ln, Davenport, FL 33897
$-634
Cash flow
-7.9%
Cash-on-Cash Return
4.3%
Cap rate
0.7%
Rent to Value Ratio
Active
$374,900
4
bds
|
3
ba
|
1,627
sqft
|
built
2003
314 Saddle Ridge Dr, Davenport, FL 33896
$-614
Cash flow
-8.5%
Cash-on-Cash Return
4.2%
Cap rate
0.7%
Rent to Value Ratio
Active
$469,950
7
bds
|
5
ba
|
2,771
sqft
|
built
2006
209 Rosso Dr, Davenport, FL 33837
$-961
Cash flow
-10.7%
Cash-on-Cash Return
3.7%
Cap rate
0.7%
Rent to Value Ratio
Active
$425,000
4
bds
|
4
ba
|
1,960
sqft
|
built
2016
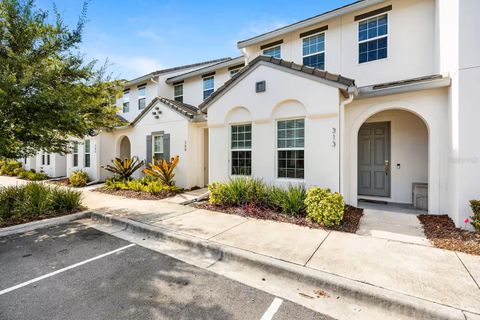
313 Captiva Dr, Davenport, FL 33896
$-1,202
Cash flow
-14.8%
Cash-on-Cash Return
2.8%
Cap rate
0.7%
Rent to Value Ratio
Active
$599,999
6
bds
|
5
ba
|
3,000
sqft
|
built
2020
555 Meadow Bend Dr, Davenport, FL 33837
$-1,533
Cash flow
-13.3%
Cash-on-Cash Return
3.1%
Cap rate
0.5%
Rent to Value Ratio
Active
$334,900
4
bds
|
2
ba
|
1,760
sqft
|
built
2013
318 Highland Meadows Dr, Davenport, FL 33837
$-353
Cash flow
-5.5%
Cash-on-Cash Return
4.9%
Cap rate
0.7%
Rent to Value Ratio
Active
$219,950
2
bds
|
2
ba
|
1,134
sqft
|
built
2007
1375 Tuscana Ln, Davenport, FL 33896
$-813
Cash flow
-19.3%
Cash-on-Cash Return
1.7%
Cap rate
0.8%
Rent to Value Ratio
Active
$524,000
4
bds
|
3
ba
|
2,471
sqft
|
built
2000
242 Prestwick Dr, Davenport, FL 33897
$-1,038
Cash flow
-10.3%
Cash-on-Cash Return
3.8%
Cap rate
0.6%
Rent to Value Ratio
Active
$389,000
4
bds
|
3
ba
|
1,775
sqft
|
built
2021
1321 Yorkdale Rd, Davenport, FL 33837
$-860
Cash flow
-11.5%
Cash-on-Cash Return
3.5%
Cap rate
0.6%
Rent to Value Ratio
Active
$509,900
4
bds
|
4
ba
|
1,888
sqft
|
built
2001
547 Windsor Pl, Davenport, FL 33896
$-1,449
Cash flow
-14.8%
Cash-on-Cash Return
2.7%
Cap rate
0.5%
Rent to Value Ratio
Active
$419,900
4
bds
|
3
ba
|
1,914
sqft
|
built
2019
8993 Cabot Cliffs Dr, Davenport, FL 33896
$-1,038
Cash flow
-12.9%
Cash-on-Cash Return
3.2%
Cap rate
0.7%
Rent to Value Ratio
Active
$850,000
9
bds
|
5
ba
|
3,909
sqft
|
built
2014
1425 Thunderbird Rd, Davenport, FL 33896
$-2,299
Cash flow
-14.1%
Cash-on-Cash Return
2.9%
Cap rate
0.5%
Rent to Value Ratio
Active
$425,000
4
bds
|
3
ba
|
1,876
sqft
|
built
2000
235 Hollingshead Loop, Davenport, FL 33896
$-877
Cash flow
-10.8%
Cash-on-Cash Return
3.7%
Cap rate
0.6%
Rent to Value Ratio

Active
$429,000
4
bds
|
2
ba
|
1,860
sqft
|
built
2015
247 Whispering Pines Way, Davenport, FL 33837
$-1,009
Cash flow
-12.3%
Cash-on-Cash Return
3.3%
Cap rate
0.5%
Rent to Value Ratio
Active
$450,000
4
bds
|
3
ba
|
2,838
sqft
|
built
2018
161 Williamson Dr, Davenport, FL 33897
$-789
Cash flow
-9.1%
Cash-on-Cash Return
4.0%
Cap rate
0.6%
Rent to Value Ratio
Active
$279,000
4
bds
|
3
ba
|
1,748
sqft
|
built
2002
135 Orchid Dr, Davenport, FL 33897
$-441
Cash flow
-8.2%
Cash-on-Cash Return
4.2%
Cap rate
0.8%
Rent to Value Ratio
Active
$324,900
3
bds
|
2
ba
|
1,400
sqft
|
built
2005
212 Regency St, Davenport, FL 33896
$-717
Cash flow
-11.5%
Cash-on-Cash Return
3.5%
Cap rate
0.7%
Rent to Value Ratio
Active
$330,000
4
bds
|
2
ba
|
1,452
sqft
|
built
2001
202 Aylesbury Ln, Davenport, FL 33837
$-523
Cash flow
-8.3%
Cash-on-Cash Return
4.2%
Cap rate
0.7%
Rent to Value Ratio
Active
$439,900
4
bds
|
4
ba
|
2,094
sqft
|
built
2017
228 Captiva Dr, Davenport, FL 33896
$-1,351
Cash flow
-16.0%
Cash-on-Cash Return
2.5%
Cap rate
0.6%
Rent to Value Ratio
Active
$465,000
4
bds
|
3
ba
|
2,341
sqft
|
built
2005
339 Sigmund Loop, Davenport, FL 33837
$-907
Cash flow
-10.2%
Cash-on-Cash Return
3.8%
Cap rate
0.6%
Rent to Value Ratio
Active
$510,000
6
bds
|
6
ba
|
2,876
sqft
|
built
2016
411 Cabello Dr, Davenport, FL 33837
$-1,169
Cash flow
-12.0%
Cash-on-Cash Return
3.4%
Cap rate
0.6%
Rent to Value Ratio
Active
$446,000
5
bds
|
4
ba
|
2,924
sqft
|
built
2017
308 Aberdeen Dr, Davenport, FL 33896
$-780
Cash flow
-9.1%
Cash-on-Cash Return
4.0%
Cap rate
0.6%
Rent to Value Ratio
Active
$359,990
3
bds
|
2
ba
|
1,484
sqft
|
built
2020
3451 Monaco Ln, Davenport, FL 33897
$-771
Cash flow
-11.2%
Cash-on-Cash Return
3.6%
Cap rate
0.6%
Rent to Value Ratio
Active
$399,980
5
bds
|
4
ba
|
2,989
sqft
|
built
2021
871 Fillmore Ct, Davenport, FL 33837
$-907
Cash flow
-11.8%
Cash-on-Cash Return
3.4%
Cap rate
0.7%
Rent to Value Ratio
Active
$549,000
6
bds
|
4
ba
|
3,305
sqft
|
built
2023
358 Hamlet Loop, Davenport, FL 33837
$-1,102
Cash flow
-10.5%
Cash-on-Cash Return
3.7%
Cap rate
0.6%
Rent to Value Ratio
Active
$410,000
4
bds
|
3
ba
|
2,610
sqft
|
built
2005
410 Canna Dr, Davenport, FL 33897
$-529
Cash flow
-6.7%
Cash-on-Cash Return
4.6%
Cap rate
0.7%
Rent to Value Ratio
Active
$570,000
5
bds
|
4
ba
|
2,661
sqft
|
built
2014
4405 Acorn Ct, Davenport, FL 33837
$-1,592
Cash flow
-14.6%
Cash-on-Cash Return
2.8%
Cap rate
0.6%
Rent to Value Ratio
Active
$243,500
3
bds
|
3
ba
|
1,457
sqft
|
built
2004
626 Verona Ave, Davenport, FL 33897
$-677
Cash flow
-14.5%
Cash-on-Cash Return
2.8%
Cap rate
0.9%
Rent to Value Ratio