Davenport, FL Investment Properties for Sale
Browse homes for sale and investment properties in Davenport, FL. Refine your search by price, property type, or more.
Best cash flowing properties in Davenport, FL
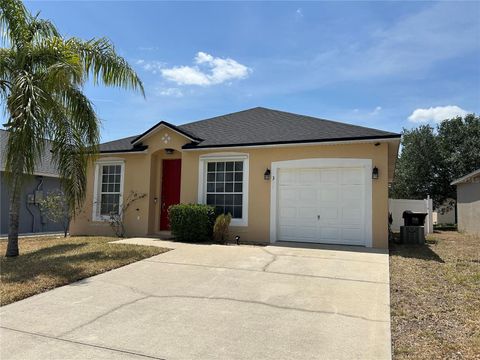
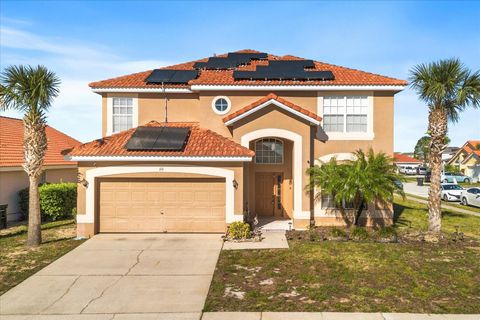
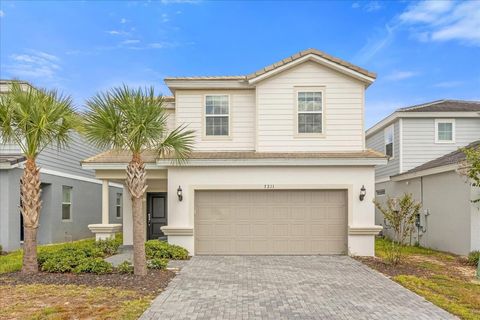
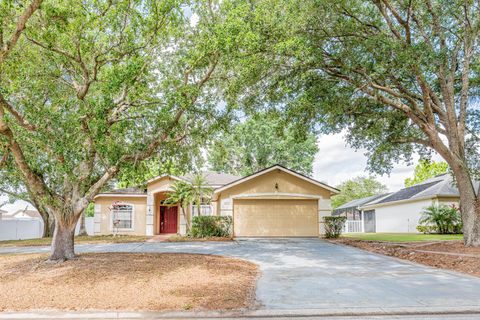
Active
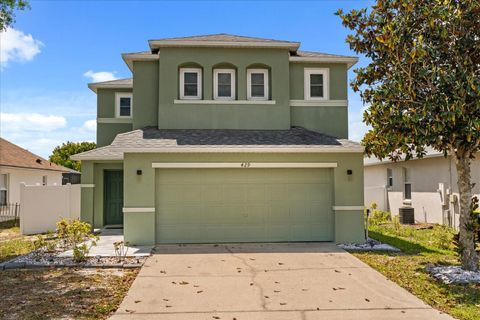
$314,900
3
bds
|
2
ba
|
1,143
sqft
|
built
2003
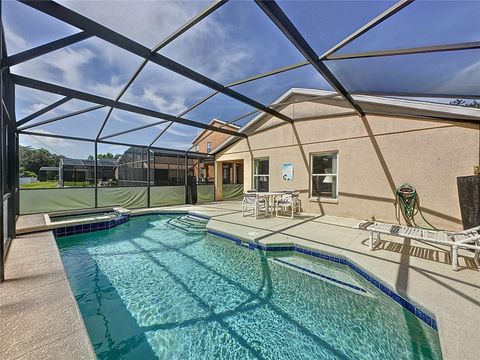
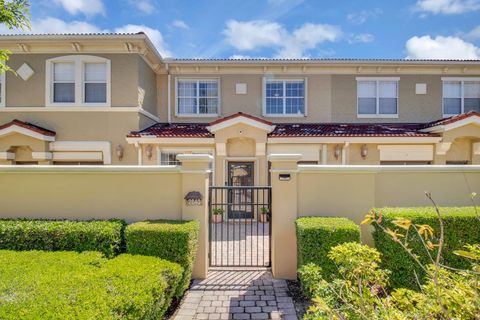
352 Madina Cir, Davenport, FL 33837
$-373
Cash flow
-6.2%
Cash-on-Cash Return
4.7%
Cap rate
0.6%
Rent to Value Ratio

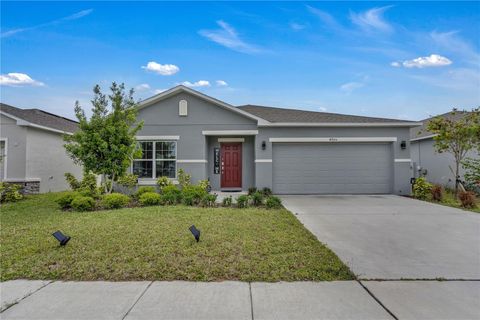
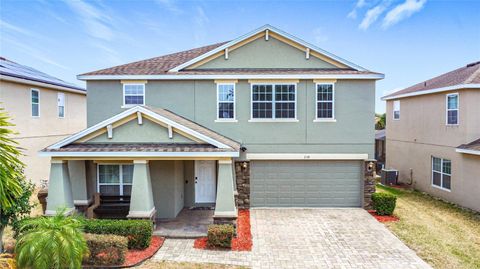
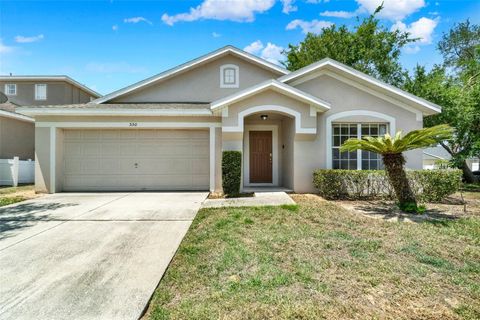
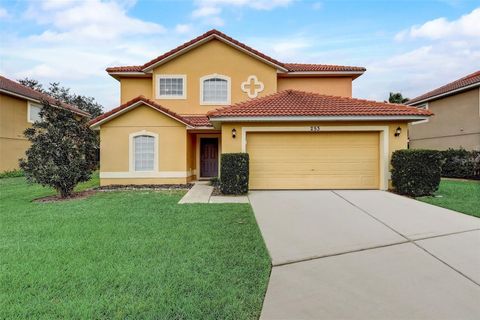
Active
$369,000
3
bds
|
2
ba
|
1,737
sqft
|
built
2002
301 Wingdale Way, Davenport, FL 33897
$-429
Cash flow
-6.1%
Cash-on-Cash Return
4.8%
Cap rate
0.6%
Rent to Value Ratio
804 out of 811 properties for sale in Davenport, FL
Limited Results Shown
Create a free account, or log in to reveal all property listings and enjoy the complete experience.

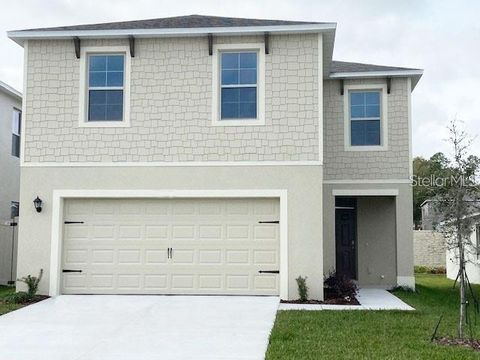
Active
$369,900
4
bds
|
2
ba
|
1,674
sqft
|
built
2001
166 Laurel Ridge Pass, Davenport, FL 33897
$-548
Cash flow
-7.7%
Cash-on-Cash Return
4.4%
Cap rate
0.7%
Rent to Value Ratio
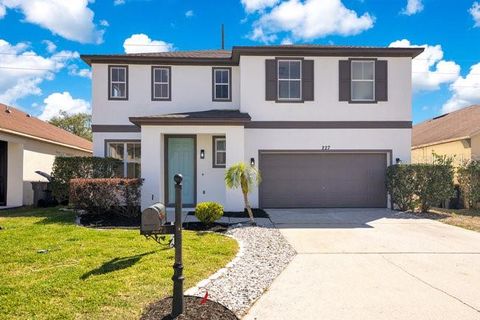
Active
$394,900
4
bds
|
2
ba
|
1,952
sqft
|
built
2022
4905 Vellacito Way, Davenport, FL 33897
$-1,014
Cash flow
-13.4%
Cash-on-Cash Return
3.1%
Cap rate
0.6%
Rent to Value Ratio

Active
$450,000
5
bds
|
2
ba
|
1,894
sqft
|
built
2008
1416 Lexington Ave, Davenport, FL 33837
$-974
Cash flow
-11.3%
Cash-on-Cash Return
3.5%
Cap rate
0.6%
Rent to Value Ratio

Active
$366,000
5
bds
|
3
ba
|
2,522
sqft
|
built
2023
1800 Post Oak Dr, Davenport, FL 33837
$-813
Cash flow
-11.6%
Cash-on-Cash Return
3.5%
Cap rate
0.7%
Rent to Value Ratio
Active
$469,950
7
bds
|
5
ba
|
2,771
sqft
|
built
2006
301 Rosso Dr, Davenport, FL 33837
$-1,018
Cash flow
-11.3%
Cash-on-Cash Return
3.5%
Cap rate
0.7%
Rent to Value Ratio
Active
$379,995
4
bds
|
2
ba
|
1,696
sqft
|
built
2021
1351 Pompay Dr, Davenport, FL 33896
$-694
Cash flow
-9.5%
Cash-on-Cash Return
4.0%
Cap rate
0.7%
Rent to Value Ratio
Active
$440,000
6
bds
|
5
ba
|
2,771
sqft
|
built
2006
101 Stella Pass, Davenport, FL 33837
$-881
Cash flow
-10.4%
Cash-on-Cash Return
3.7%
Cap rate
0.7%
Rent to Value Ratio
Active
$525,000
5
bds
|
3
ba
|
3,358
sqft
|
built
2017
238 Granada Ave, Davenport, FL 33837
$-926
Cash flow
-9.2%
Cash-on-Cash Return
4.0%
Cap rate
0.6%
Rent to Value Ratio
Active
$1,095,000
8
bds
|
5
ba
|
4,019
sqft
|
built
2021
9312 Sommerset Hills Dr, Davenport, FL 33896
$-4,229
Cash flow
-20.2%
Cash-on-Cash Return
1.5%
Cap rate
0.4%
Rent to Value Ratio
Active
$369,000
3
bds
|
2
ba
|
1,737
sqft
|
built
2002
301 Wingdale Way, Davenport, FL 33897
$-429
Cash flow
-6.1%
Cash-on-Cash Return
4.8%
Cap rate
0.6%
Rent to Value Ratio
Active
$314,900
3
bds
|
2
ba
|
1,143
sqft
|
built
2003
352 Madina Cir, Davenport, FL 33837
$-373
Cash flow
-6.2%
Cash-on-Cash Return
4.7%
Cap rate
0.6%
Rent to Value Ratio
Active
$1,095,000
8
bds
|
5
ba
|
4,018
sqft
|
built
2021
9332 Sommerset Hills Dr, Davenport, FL 33896
$-4,152
Cash flow
-19.8%
Cash-on-Cash Return
1.6%
Cap rate
0.4%
Rent to Value Ratio

Active
$858,000
5
bds
|
4
ba
|
4,034
sqft
|
built
2007
2771 Willingam Dr, Davenport, FL 33837
$-2,054
Cash flow
-12.5%
Cash-on-Cash Return
3.3%
Cap rate
0.5%
Rent to Value Ratio
Active
$350,000
4
bds
|
3
ba
|
1,659
sqft
|
built
2005
116 Ridgemont Ct, Davenport, FL 33896
$-666
Cash flow
-9.9%
Cash-on-Cash Return
3.9%
Cap rate
0.7%
Rent to Value Ratio
Active
$399,500
4
bds
|
3
ba
|
1,902
sqft
|
built
2017
9025 Dogleg Dr, Davenport, FL 33896
$-1,060
Cash flow
-13.8%
Cash-on-Cash Return
3.0%
Cap rate
0.7%
Rent to Value Ratio
Active
$600,000
4
bds
|
4
ba
|
3,096
sqft
|
built
2013
1204 Lexington Ave, Davenport, FL 33837
$-1,479
Cash flow
-12.9%
Cash-on-Cash Return
3.2%
Cap rate
0.5%
Rent to Value Ratio

Active
$359,990
3
bds
|
3
ba
|
1,594
sqft
|
built
2005
163 Sundown Ct, Davenport, FL 33896
$-781
Cash flow
-11.3%
Cash-on-Cash Return
3.5%
Cap rate
0.6%
Rent to Value Ratio
Active
$395,000
4
bds
|
3
ba
|
1,833
sqft
|
built
2004
662 Orista Dr, Davenport, FL 33897
$-686
Cash flow
-9.1%
Cash-on-Cash Return
4.1%
Cap rate
0.7%
Rent to Value Ratio

Active
$569,000
6
bds
|
4
ba
|
2,925
sqft
|
built
2008
308 Yellow Snapdragon Dr, Davenport, FL 33837
$-1,267
Cash flow
-11.6%
Cash-on-Cash Return
3.5%
Cap rate
0.7%
Rent to Value Ratio
Active
$730,000
6
bds
|
5
ba
|
3,176
sqft
|
built
2022
7211 Oakmoss Loop, Davenport, FL 33837
$-2,132
Cash flow
-15.2%
Cash-on-Cash Return
2.6%
Cap rate
0.5%
Rent to Value Ratio
Active
$400,000
4
bds
|
2
ba
|
1,488
sqft
|
built
1950
210 Church Rd, Davenport, FL 33896
$-1,005
Cash flow
-13.1%
Cash-on-Cash Return
3.1%
Cap rate
0.4%
Rent to Value Ratio
Active
$374,999
4
bds
|
2
ba
|
1,929
sqft
|
built
2000
550 Castlemain Cir, Davenport, FL 33897
$-657
Cash flow
-9.1%
Cash-on-Cash Return
4.0%
Cap rate
0.7%
Rent to Value Ratio

Active
$522,500
5
bds
|
5
ba
|
2,836
sqft
|
built
2017
5270 Wildwood Way, Davenport, FL 33837
$-1,369
Cash flow
-13.7%
Cash-on-Cash Return
3.0%
Cap rate
0.7%
Rent to Value Ratio
Active
$465,000
4
bds
|
3
ba
|
2,071
sqft
|
built
2004
114 Dolcetto Dr, Davenport, FL 33897
$-911
Cash flow
-10.2%
Cash-on-Cash Return
3.8%
Cap rate
0.6%
Rent to Value Ratio
Active
$245,000
3
bds
|
2
ba
|
1,420
sqft
|
built
2009
2840 Bella Vista Dr, Davenport, FL 33897
$-628
Cash flow
-13.4%
Cash-on-Cash Return
3.1%
Cap rate
0.9%
Rent to Value Ratio
Active
$799,000
9
bds
|
7
ba
|
4,012
sqft
|
built
2018
6108 Broad Oak Dr, Davenport, FL 33837
$-2,660
Cash flow
-17.4%
Cash-on-Cash Return
2.2%
Cap rate
0.5%
Rent to Value Ratio

Active
$389,900
4
bds
|
3
ba
|
1,841
sqft
|
built
2005
643 Orista Dr, Davenport, FL 33897
$-732
Cash flow
-9.8%
Cash-on-Cash Return
3.9%
Cap rate
0.7%
Rent to Value Ratio
Active
$599,000
5
bds
|
3
ba
|
3,282
sqft
|
built
2018
1443 Bunker Dr, Davenport, FL 33896
$-2,048
Cash flow
-17.8%
Cash-on-Cash Return
2.0%
Cap rate
0.6%
Rent to Value Ratio
Active
$390,000
4
bds
|
2
ba
|
1,940
sqft
|
built
2005
119 Hypolita Ave, Davenport, FL 33897
$-1,055
Cash flow
-14.1%
Cash-on-Cash Return
2.9%
Cap rate
0.6%
Rent to Value Ratio
Active
$389,900
4
bds
|
2
ba
|
1,839
sqft
|
built
1996
225 Loma Del Sol Dr, Davenport, FL 33896
$-682
Cash flow
-9.1%
Cash-on-Cash Return
4.0%
Cap rate
0.6%
Rent to Value Ratio
Active
$399,999
4
bds
|
3
ba
|
1,978
sqft
|
built
2006
253 Granada Blvd, Davenport, FL 33837
$-530
Cash flow
-6.9%
Cash-on-Cash Return
4.6%
Cap rate
0.7%
Rent to Value Ratio
Active
$345,000
4
bds
|
3
ba
|
2,078
sqft
|
built
2020
167 Eagleview Loop, Davenport, FL 33837
$-860
Cash flow
-13.0%
Cash-on-Cash Return
3.2%
Cap rate
0.7%
Rent to Value Ratio
Active
$460,000
5
bds
|
5
ba
|
2,204
sqft
|
built
2004
227 Sand Ridge Dr, Davenport, FL 33896
$-857
Cash flow
-9.7%
Cash-on-Cash Return
3.9%
Cap rate
0.5%
Rent to Value Ratio

Active
$235,000
3
bds
|
2
ba
|
1,227
sqft
|
built
2005
702 Gran Bahama Blvd, Davenport, FL 33897
$-642
Cash flow
-14.3%
Cash-on-Cash Return
2.9%
Cap rate
0.9%
Rent to Value Ratio

Active
$500,000
3
bds
|
2
ba
|
1,905
sqft
|
built
2000
334 Grosvenor Loop, Davenport, FL 33897
$-1,308
Cash flow
-13.6%
Cash-on-Cash Return
3.0%
Cap rate
0.5%
Rent to Value Ratio
Active
$390,000
3
bds
|
3
ba
|
1,849
sqft
|
built
2004
429 Rona Ln, Davenport, FL 33897
$-644
Cash flow
-8.6%
Cash-on-Cash Return
4.2%
Cap rate
0.6%
Rent to Value Ratio
Active
$390,000
3
bds
|
2
ba
|
1,750
sqft
|
built
1994
129 Pine Lake View Dr, Davenport, FL 33837
$-689
Cash flow
-9.2%
Cash-on-Cash Return
4.0%
Cap rate
0.6%
Rent to Value Ratio

Active
$410,000
4
bds
|
2
ba
|
1,452
sqft
|
built
2003
217 Herring St, Davenport, FL 33897
$-788
Cash flow
-10.0%
Cash-on-Cash Return
3.8%
Cap rate
0.6%
Rent to Value Ratio
Active
$439,000
4
bds
|
3
ba
|
2,205
sqft
|
built
2022
235 Villa Domani Cir, Davenport, FL 33896
$-804
Cash flow
-9.6%
Cash-on-Cash Return
3.9%
Cap rate
0.7%
Rent to Value Ratio
Active
$205,750
2
bds
|
2
ba
|
1,112
sqft
|
built
2006
1357 Venezia Ct, Davenport, FL 33896
$-868
Cash flow
-22.0%
Cash-on-Cash Return
1.1%
Cap rate
0.9%
Rent to Value Ratio