Davenport, FL Investment Properties for Sale
Browse homes for sale and investment properties in Davenport, FL. Refine your search by price, property type, or more.
Best cash flowing properties in Davenport, FL
Active
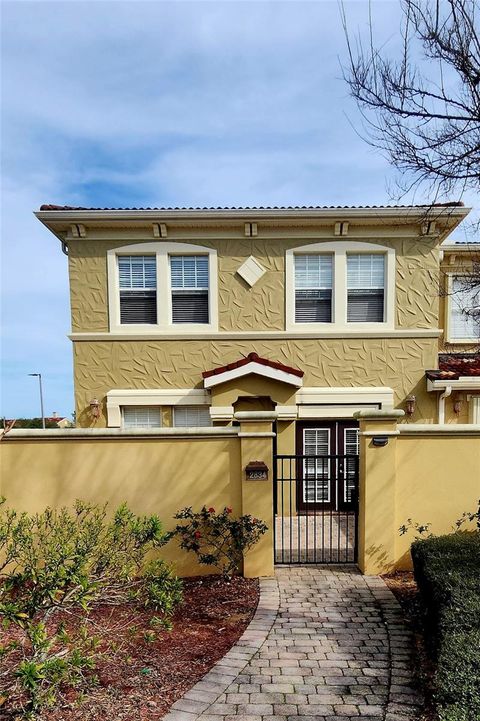
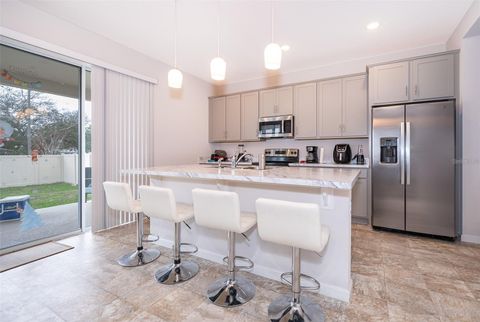
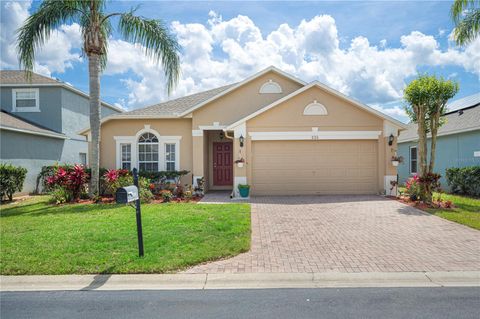
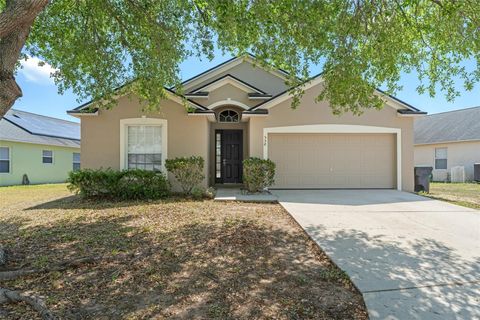
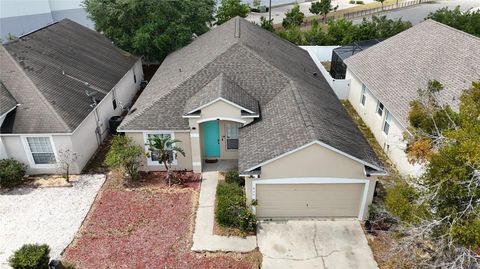
$268,000
4
bds
|
2
ba
|
1,604
sqft
|
built
2009
2834 Bella Vista Dr, Davenport, FL 33897
$-240
Cash flow
-4.7%
Cash-on-Cash Return
5.1%
Cap rate
0.7%
Rent to Value Ratio

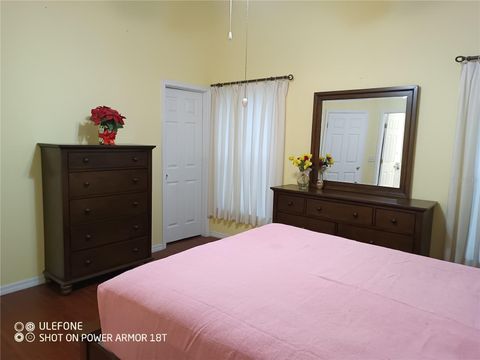
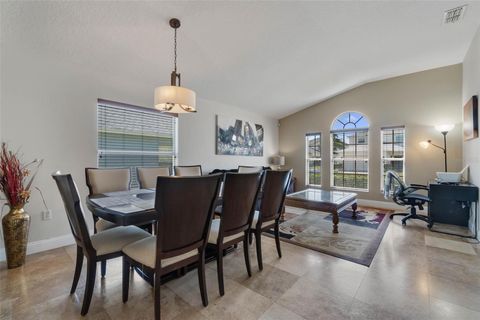
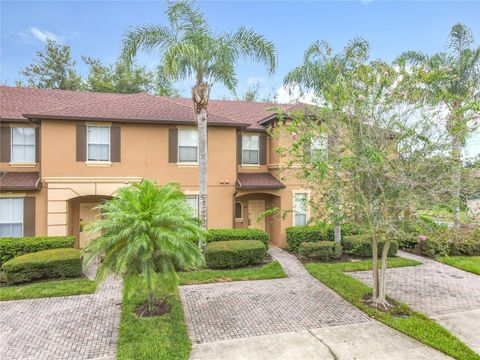
Active
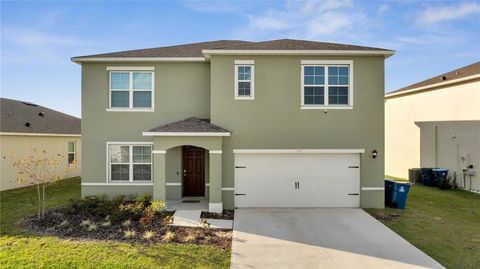
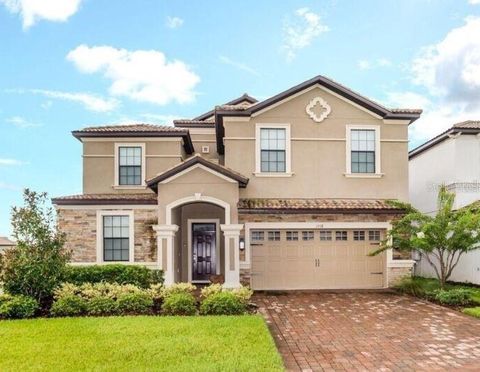
$319,999
3
bds
|
3
ba
|
1,764
sqft
|
built
1981
1016 Gotts Rd, Davenport, FL 33837
$-354
Cash flow
-5.8%
Cash-on-Cash Return
4.8%
Cap rate
0.7%
Rent to Value Ratio
804 out of 811 properties for sale in Davenport, FL
Limited Results Shown
Create a free account, or log in to reveal all property listings and enjoy the complete experience.
Active
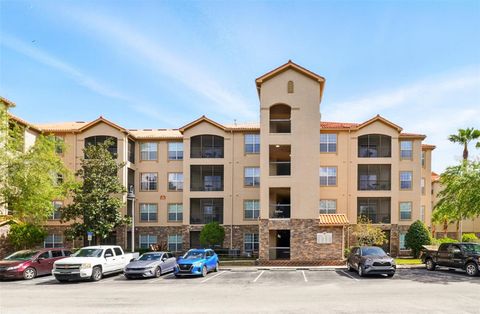
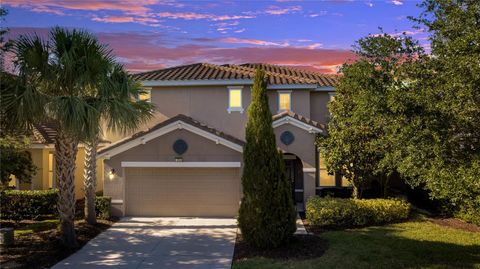
$479,900
5
bds
|
4
ba
|
3,106
sqft
|
built
2022
1092 Sugarwood St, Davenport, FL 33837
$-1,104
Cash flow
-12.0%
Cash-on-Cash Return
3.4%
Cap rate
0.7%
Rent to Value Ratio
Active
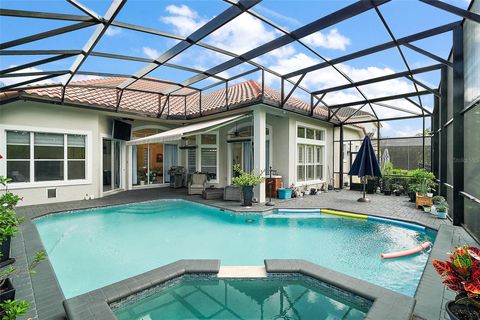
$349,900
3
bds
|
2
ba
|
1,412
sqft
|
built
1999
223 Lady Diana Dr, Davenport, FL 33837
$-515
Cash flow
-7.7%
Cash-on-Cash Return
4.4%
Cap rate
0.6%
Rent to Value Ratio
Active
$432,000
4
bds
|
3
ba
|
1,998
sqft
|
built
2003
838 Kildrummy Dr, Davenport, FL 33896
$-970
Cash flow
-11.7%
Cash-on-Cash Return
3.5%
Cap rate
0.6%
Rent to Value Ratio
Active
$415,000
3
bds
|
3
ba
|
2,174
sqft
|
built
2021
832 Benoi Dr, Davenport, FL 33896
$-1,146
Cash flow
-14.4%
Cash-on-Cash Return
2.8%
Cap rate
0.6%
Rent to Value Ratio
Active
$230,000
3
bds
|
2
ba
|
1,244
sqft
|
built
2007
1370 Tuscan Ter, Davenport, FL 33896
$-777
Cash flow
-17.6%
Cash-on-Cash Return
2.1%
Cap rate
0.9%
Rent to Value Ratio
Active
$375,000
3
bds
|
2
ba
|
1,706
sqft
|
built
2017
488 Nova Dr, Davenport, FL 33837
$-565
Cash flow
-7.9%
Cash-on-Cash Return
4.3%
Cap rate
0.6%
Rent to Value Ratio
Active
$484,000
5
bds
|
5
ba
|
2,076
sqft
|
built
2019
4582 Terrasonesta Dr, Davenport, FL 33837
$-1,405
Cash flow
-15.1%
Cash-on-Cash Return
2.7%
Cap rate
0.7%
Rent to Value Ratio
Active
$400,000
3
bds
|
2
ba
|
1,748
sqft
|
built
2005
225 Highgate Park Blvd, Davenport, FL 33897
$-759
Cash flow
-9.9%
Cash-on-Cash Return
3.9%
Cap rate
0.6%
Rent to Value Ratio

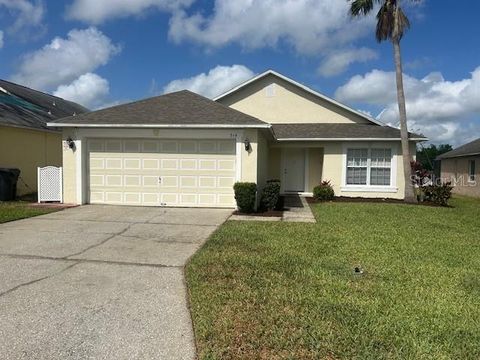
Active
$379,000
4
bds
|
2
ba
|
1,922
sqft
|
built
1999
319 Bailey Cir, Davenport, FL 33897
$-639
Cash flow
-8.8%
Cash-on-Cash Return
4.1%
Cap rate
0.7%
Rent to Value Ratio
Active
$430,000
5
bds
|
3
ba
|
2,696
sqft
|
built
2023
417 Noble Ave, Davenport, FL 33837
$-990
Cash flow
-12.0%
Cash-on-Cash Return
3.4%
Cap rate
0.7%
Rent to Value Ratio
Active
$195,000
2
bds
|
2
ba
|
1,134
sqft
|
built
2007
1351 Tuscan Ter, Davenport, FL 33896
$-658
Cash flow
-17.6%
Cash-on-Cash Return
2.1%
Cap rate
0.9%
Rent to Value Ratio
Active
$795,000
5
bds
|
4
ba
|
3,448
sqft
|
built
2007
2497 Heritage Green Ave, Davenport, FL 33837
$-2,140
Cash flow
-14.0%
Cash-on-Cash Return
2.9%
Cap rate
0.5%
Rent to Value Ratio
Active
$339,000
3
bds
|
2
ba
|
1,168
sqft
|
built
2000
314 Casterton Cir, Davenport, FL 33897
$-588
Cash flow
-9.0%
Cash-on-Cash Return
4.1%
Cap rate
0.6%
Rent to Value Ratio
Active
$333,000
4
bds
|
2
ba
|
1,796
sqft
|
built
2000
640 Lady Diana Dr, Davenport, FL 33837
$-354
Cash flow
-5.5%
Cash-on-Cash Return
4.9%
Cap rate
0.7%
Rent to Value Ratio

Active
$314,999
4
bds
|
4
ba
|
1,856
sqft
|
built
2005
130 Palermo St, Davenport, FL 33897
$-871
Cash flow
-14.4%
Cash-on-Cash Return
2.8%
Cap rate
0.8%
Rent to Value Ratio
Active
$740,000
6
bds
|
5
ba
|
3,404
sqft
|
built
2015
5416 Solterra Cir, Davenport, FL 33837
$-2,947
Cash flow
-20.8%
Cash-on-Cash Return
1.4%
Cap rate
0.5%
Rent to Value Ratio
Active
$285,000
3
bds
|
3
ba
|
1,421
sqft
|
built
2022
1116 Merrill St, Davenport, FL 33837
$-632
Cash flow
-11.6%
Cash-on-Cash Return
3.5%
Cap rate
0.7%
Rent to Value Ratio
Active
$360,000
4
bds
|
2
ba
|
1,468
sqft
|
built
1997
720 Belvoir Dr, Davenport, FL 33837
$-663
Cash flow
-9.6%
Cash-on-Cash Return
3.9%
Cap rate
0.6%
Rent to Value Ratio
Active
$329,000
3
bds
|
2
ba
|
1,650
sqft
|
built
2004
558 Knollwood Dr, Davenport, FL 33837
$-665
Cash flow
-10.5%
Cash-on-Cash Return
3.7%
Cap rate
0.6%
Rent to Value Ratio
Active
$890,000
8
bds
|
5
ba
|
3,909
sqft
|
built
2015
1518 Rolling Fairway Dr, Davenport, FL 33896
$-3,314
Cash flow
-19.4%
Cash-on-Cash Return
1.7%
Cap rate
0.4%
Rent to Value Ratio
Active
$639,000
6
bds
|
5
ba
|
3,032
sqft
|
built
2015
4328 Acorn Ct, Davenport, FL 33837
$-1,489
Cash flow
-12.2%
Cash-on-Cash Return
3.4%
Cap rate
0.6%
Rent to Value Ratio
Active
$389,990
5
bds
|
3
ba
|
1,863
sqft
|
built
2004
635 Knollwood Dr, Davenport, FL 33837
$-566
Cash flow
-7.6%
Cash-on-Cash Return
4.4%
Cap rate
0.7%
Rent to Value Ratio
Active
$548,999
5
bds
|
5
ba
|
2,842
sqft
|
built
2013
1424 Moon Valley Dr, Davenport, FL 33896
$-1,519
Cash flow
-14.4%
Cash-on-Cash Return
2.8%
Cap rate
0.6%
Rent to Value Ratio
Active
$439,000
4
bds
|
3
ba
|
1,914
sqft
|
built
2021
1188 Challenger Ave, Davenport, FL 33897
$-1,398
Cash flow
-16.6%
Cash-on-Cash Return
2.3%
Cap rate
0.6%
Rent to Value Ratio
Active
$268,000
4
bds
|
2
ba
|
1,604
sqft
|
built
2009
2834 Bella Vista Dr, Davenport, FL 33897
$-240
Cash flow
-4.7%
Cash-on-Cash Return
5.1%
Cap rate
0.7%
Rent to Value Ratio
Active
$259,000
4
bds
|
3
ba
|
1,492
sqft
|
built
2004
347 Cambria Ave, Davenport, FL 33897
$-647
Cash flow
-13.0%
Cash-on-Cash Return
3.2%
Cap rate
0.9%
Rent to Value Ratio
Active
$489,900
5
bds
|
5
ba
|
2,281
sqft
|
built
2020
7487 Oakmoss Loop, Davenport, FL 33837
$-1,069
Cash flow
-11.4%
Cash-on-Cash Return
3.5%
Cap rate
0.7%
Rent to Value Ratio
Active
$295,000
3
bds
|
3
ba
|
1,525
sqft
|
built
2010
1010 Chelsea Dr, Davenport, FL 33897
$-394
Cash flow
-7.0%
Cash-on-Cash Return
4.5%
Cap rate
0.7%
Rent to Value Ratio
Active
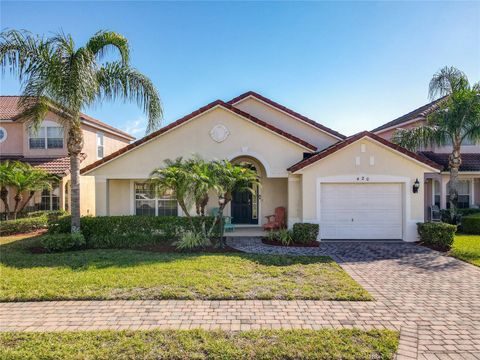
$379,000
4
bds
|
3
ba
|
1,700
sqft
|
built
2005
420 Robin Rd, Davenport, FL 33896
$-719
Cash flow
-9.9%
Cash-on-Cash Return
3.9%
Cap rate
0.7%
Rent to Value Ratio

Active
$479,950
7
bds
|
5
ba
|
3,471
sqft
|
built
2005
326 Mc Fee Dr, Davenport, FL 33897
$-884
Cash flow
-9.6%
Cash-on-Cash Return
3.9%
Cap rate
0.7%
Rent to Value Ratio
Active
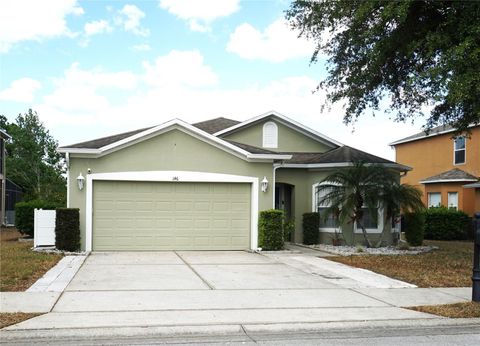
$435,000
4
bds
|
3
ba
|
1,839
sqft
|
built
2008
146 Essex Pl, Davenport, FL 33896
$-1,191
Cash flow
-14.3%
Cash-on-Cash Return
2.9%
Cap rate
0.6%
Rent to Value Ratio
Active
$498,500
5
bds
|
4
ba
|
2,200
sqft
|
built
2007
650 Tuscan Hills Blvd, Davenport, FL 33897
$-1,078
Cash flow
-11.3%
Cash-on-Cash Return
3.6%
Cap rate
0.6%
Rent to Value Ratio
Active
$408,000
4
bds
|
3
ba
|
1,940
sqft
|
built
2005
1102 Solana Cir, Davenport, FL 33897
$-965
Cash flow
-12.3%
Cash-on-Cash Return
3.3%
Cap rate
0.6%
Rent to Value Ratio
Active
$495,000
4
bds
|
2
ba
|
1,921
sqft
|
built
1997
141 Craen Dr, Davenport, FL 33897
$-870
Cash flow
-9.2%
Cash-on-Cash Return
4.0%
Cap rate
0.6%
Rent to Value Ratio

Active
$130,999
2
bds
|
2
ba
|
1,039
sqft
|
built
2008
906 Charo Pkwy, Davenport, FL 33897
$-684
Cash flow
-27.2%
Cash-on-Cash Return
-0.1%
Cap rate
1.4%
Rent to Value Ratio
Active
$424,000
4
bds
|
3
ba
|
2,027
sqft
|
built
2019
3053 Brook Stone Ter, Davenport, FL 33837
$-943
Cash flow
-11.6%
Cash-on-Cash Return
3.5%
Cap rate
0.6%
Rent to Value Ratio
Active
$525,000
5
bds
|
4
ba
|
3,212
sqft
|
built
2022
609 Fortuna Dr, Davenport, FL 33837
$-1,013
Cash flow
-10.1%
Cash-on-Cash Return
3.8%
Cap rate
0.6%
Rent to Value Ratio
Active
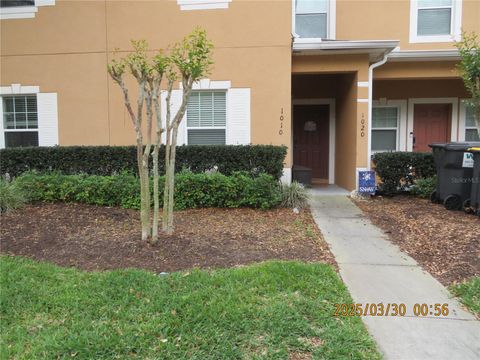
$319,999
3
bds
|
3
ba
|
1,764
sqft
|
built
1981
1016 Gotts Rd, Davenport, FL 33837
$-354
Cash flow
-5.8%
Cash-on-Cash Return
4.8%
Cap rate
0.7%
Rent to Value Ratio
Active
$475,000
5
bds
|
4
ba
|
2,611
sqft
|
built
2004
423 Corvina Dr, Davenport, FL 33897
$-895
Cash flow
-9.8%
Cash-on-Cash Return
3.9%
Cap rate
0.6%
Rent to Value Ratio
Active
$410,000
4
bds
|
4
ba
|
1,768
sqft
|
built
2005
178 Hammock Ct, Davenport, FL 33896
$-652
Cash flow
-8.3%
Cash-on-Cash Return
4.2%
Cap rate
0.7%
Rent to Value Ratio