Davenport, FL Investment Properties for Sale
Browse homes for sale and investment properties in Davenport, FL. Refine your search by price, property type, or more.
Best cash flowing properties in Davenport, FL

Active
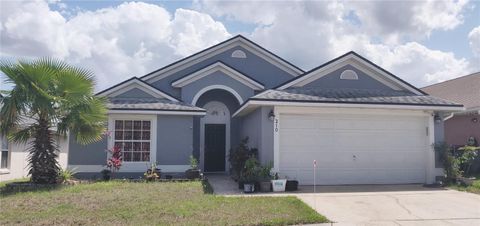
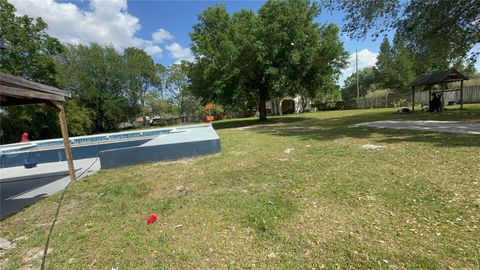
$280,000
3
bds
|
2
ba
|
1,160
sqft
|
built
1959
217 E Bay St, Davenport, FL 33837
$-173
Cash flow
-3.2%
Cash-on-Cash Return
5.4%
Cap rate
0.7%
Rent to Value Ratio
Active
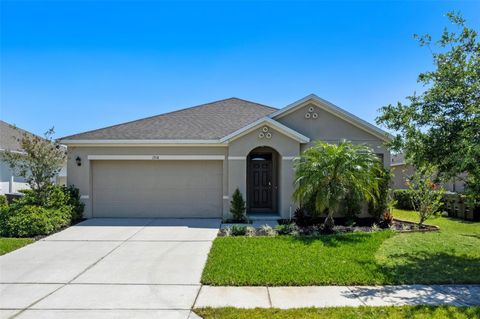
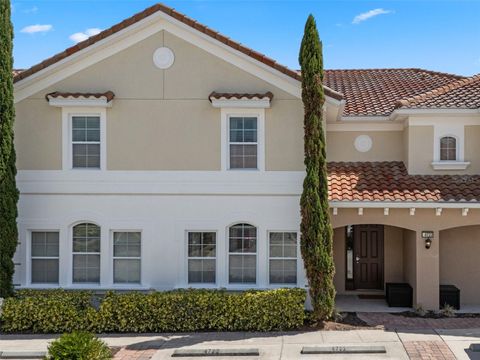
$339,900
3
bds
|
2
ba
|
1,503
sqft
|
built
2005
210 Cheshire Way, Davenport, FL 33897
$-423
Cash flow
-6.5%
Cash-on-Cash Return
4.7%
Cap rate
0.7%
Rent to Value Ratio
804 out of 811 properties for sale in Davenport, FL
Limited Results Shown
Create a free account, or log in to reveal all property listings and enjoy the complete experience.
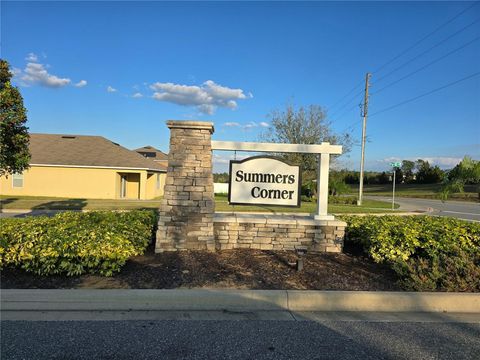
Active
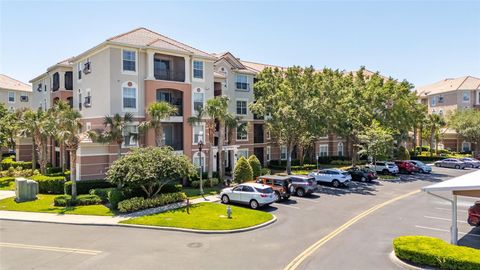
$326,950
3
bds
|
2
ba
|
1,690
sqft
|
built
2016
1918 Marabou Dr, Davenport, FL 33896
$-653
Cash flow
-10.4%
Cash-on-Cash Return
3.8%
Cap rate
0.7%
Rent to Value Ratio
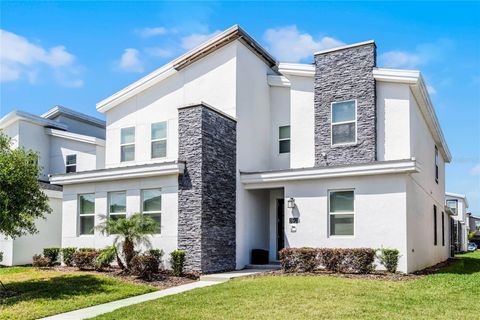
Active
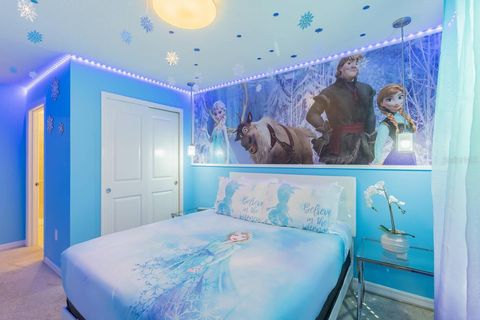
$225,000
3
bds
|
2
ba
|
1,384
sqft
|
built
2008
8296 Portofino Dr, Davenport, FL 33896
$-892
Cash flow
-20.7%
Cash-on-Cash Return
1.4%
Cap rate
0.8%
Rent to Value Ratio
Active
$519,000
5
bds
|
5
ba
|
2,283
sqft
|
built
2020
136 Jetty Way, Davenport, FL 33897
$-1,578
Cash flow
-15.9%
Cash-on-Cash Return
2.5%
Cap rate
0.7%
Rent to Value Ratio
Active
$390,000
3
bds
|
1
ba
|
2,250
sqft
|
built
1973
434 Diamond Acres Rd, Davenport, FL 33837
$-729
Cash flow
-9.8%
Cash-on-Cash Return
3.9%
Cap rate
0.6%
Rent to Value Ratio
Active
$420,000
4
bds
|
4
ba
|
2,184
sqft
|
built
2017
4722 Terrasonesta Dr, Davenport, FL 33837
$-1,360
Cash flow
-16.9%
Cash-on-Cash Return
2.3%
Cap rate
0.7%
Rent to Value Ratio

Active
$645,000
7
bds
|
5
ba
|
3,604
sqft
|
built
2013
1405 Thunderbird Rd, Davenport, FL 33896
$-2,027
Cash flow
-16.4%
Cash-on-Cash Return
2.4%
Cap rate
0.6%
Rent to Value Ratio
Active
$364,900
4
bds
|
2
ba
|
1,868
sqft
|
built
2017
320 Aberdeen Dr, Davenport, FL 33896
$-784
Cash flow
-11.2%
Cash-on-Cash Return
3.6%
Cap rate
0.6%
Rent to Value Ratio
Active
$619,900
7
bds
|
7
ba
|
3,850
sqft
|
built
2020
690 Drop Shot Dr, Davenport, FL 33896
$-1,687
Cash flow
-14.2%
Cash-on-Cash Return
2.9%
Cap rate
0.6%
Rent to Value Ratio
Active
$425,000
4
bds
|
3
ba
|
1,937
sqft
|
built
2015
2142 Victoria Dr, Davenport, FL 33837
$-841
Cash flow
-10.3%
Cash-on-Cash Return
3.8%
Cap rate
0.7%
Rent to Value Ratio
Active
$255,000
3
bds
|
2
ba
|
1,210
sqft
|
built
2007
1375 Tuscana Ln, Davenport, FL 33896
$-1,063
Cash flow
-21.7%
Cash-on-Cash Return
1.1%
Cap rate
0.7%
Rent to Value Ratio
Active
$280,000
3
bds
|
2
ba
|
1,160
sqft
|
built
1959
217 E Bay St, Davenport, FL 33837
$-173
Cash flow
-3.2%
Cash-on-Cash Return
5.4%
Cap rate
0.7%
Rent to Value Ratio

Active
$349,900
4
bds
|
2
ba
|
1,654
sqft
|
built
2003
230 Halstead Dr, Davenport, FL 33897
$-423
Cash flow
-6.3%
Cash-on-Cash Return
4.7%
Cap rate
0.6%
Rent to Value Ratio
Active
$333,000
4
bds
|
4
ba
|
1,856
sqft
|
built
2004
309 Verona Pl, Davenport, FL 33897
$-1,061
Cash flow
-16.6%
Cash-on-Cash Return
2.3%
Cap rate
0.7%
Rent to Value Ratio
Active
$280,000
4
bds
|
4
ba
|
1,950
sqft
|
built
2015
2550 Bella Vista Dr, Davenport, FL 33897
$-777
Cash flow
-14.5%
Cash-on-Cash Return
2.8%
Cap rate
0.8%
Rent to Value Ratio
Active
$305,000
3
bds
|
2
ba
|
1,529
sqft
|
built
2020
156 Eagleview Loop, Davenport, FL 33837
$-835
Cash flow
-14.3%
Cash-on-Cash Return
2.9%
Cap rate
0.7%
Rent to Value Ratio
Active
$650,000
6
bds
|
5
ba
|
3,291
sqft
|
built
2021
1013 Leader St, Davenport, FL 33896
$-2,264
Cash flow
-18.2%
Cash-on-Cash Return
2.0%
Cap rate
0.6%
Rent to Value Ratio
Active
$410,000
3
bds
|
2
ba
|
1,403
sqft
|
built
1993
133 Grovepark Dr, Davenport, FL 33837
$-891
Cash flow
-11.3%
Cash-on-Cash Return
3.5%
Cap rate
0.6%
Rent to Value Ratio

Active
$365,000
4
bds
|
2
ba
|
1,855
sqft
|
built
2001
252 Elgin Blvd, Davenport, FL 33897
$-430
Cash flow
-6.1%
Cash-on-Cash Return
4.7%
Cap rate
0.6%
Rent to Value Ratio
Active
$360,000
3
bds
|
3
ba
|
1,624
sqft
|
built
2022
1425 Discovery St, Davenport, FL 33896
$-1,184
Cash flow
-17.2%
Cash-on-Cash Return
2.2%
Cap rate
0.6%
Rent to Value Ratio
Active
$699,000
3
bds
|
2
ba
|
1,768
sqft
|
built
2021
6344 Old Lake Wilson Rd, Davenport, FL 33896
$-1,784
Cash flow
-13.3%
Cash-on-Cash Return
3.1%
Cap rate
0.4%
Rent to Value Ratio

Active
$325,000
4
bds
|
3
ba
|
2,007
sqft
|
built
2022
715 Chinoy Rd, Davenport, FL 33837
$-589
Cash flow
-9.5%
Cash-on-Cash Return
4.0%
Cap rate
0.8%
Rent to Value Ratio
Active
$455,000
3
bds
|
3
ba
|
2,174
sqft
|
built
2022
1868 Sanibel Dr, Davenport, FL 33896
$-1,233
Cash flow
-14.1%
Cash-on-Cash Return
2.9%
Cap rate
0.6%
Rent to Value Ratio
Active
$315,000
3
bds
|
3
ba
|
1,741
sqft
|
built
2017
8549 Zoeller Hills Dr, Davenport, FL 33896
$-977
Cash flow
-16.2%
Cash-on-Cash Return
2.4%
Cap rate
0.7%
Rent to Value Ratio
Active
$599,999
8
bds
|
4
ba
|
4,416
sqft
|
built
1998
5524 Loma Vista Loop, Davenport, FL 33896
$-681
Cash flow
-5.9%
Cash-on-Cash Return
4.8%
Cap rate
0.7%
Rent to Value Ratio
Active
$424,500
4
bds
|
3
ba
|
2,408
sqft
|
built
2021
1317 Yorkdale Rd, Davenport, FL 33837
$-594
Cash flow
-7.3%
Cash-on-Cash Return
4.5%
Cap rate
0.7%
Rent to Value Ratio
Active
$290,000
3
bds
|
3
ba
|
1,404
sqft
|
built
2021
597 Madison Dr, Davenport, FL 33837
$-657
Cash flow
-11.8%
Cash-on-Cash Return
3.4%
Cap rate
0.7%
Rent to Value Ratio
Active
$339,900
3
bds
|
2
ba
|
1,503
sqft
|
built
2005
210 Cheshire Way, Davenport, FL 33897
$-423
Cash flow
-6.5%
Cash-on-Cash Return
4.7%
Cap rate
0.7%
Rent to Value Ratio
Active
$450,000
4
bds
|
3
ba
|
1,902
sqft
|
built
2017
9075 Dogleg Dr, Davenport, FL 33896
$-1,399
Cash flow
-16.2%
Cash-on-Cash Return
2.4%
Cap rate
0.6%
Rent to Value Ratio

Active
$435,000
3
bds
|
2
ba
|
1,809
sqft
|
built
1995
566 Montana Ave, Davenport, FL 33897
$-878
Cash flow
-10.5%
Cash-on-Cash Return
3.7%
Cap rate
0.6%
Rent to Value Ratio
Active
$345,000
4
bds
|
2
ba
|
1,864
sqft
|
built
2015
528 Bridgeford Crossing Blvd, Davenport, FL 33837
$-660
Cash flow
-10.0%
Cash-on-Cash Return
3.9%
Cap rate
0.7%
Rent to Value Ratio
Active
$570,000
4
bds
|
3
ba
|
2,172
sqft
|
built
2013
4072 Oaktree Dr, Davenport, FL 33837
$-1,693
Cash flow
-15.5%
Cash-on-Cash Return
2.6%
Cap rate
0.6%
Rent to Value Ratio
Active
$424,999
5
bds
|
3
ba
|
2,170
sqft
|
built
2006
320 Mockingbird Rd, Davenport, FL 33896
$-758
Cash flow
-9.3%
Cash-on-Cash Return
4.0%
Cap rate
0.7%
Rent to Value Ratio
Active
$379,900
4
bds
|
2
ba
|
1,658
sqft
|
built
1998
156 Greeley Loop, Davenport, FL 33897
$-592
Cash flow
-8.1%
Cash-on-Cash Return
4.3%
Cap rate
0.7%
Rent to Value Ratio
Active
$350,000
4
bds
|
2
ba
|
1,864
sqft
|
built
2014
457 Bridgeford Crossing Blvd, Davenport, FL 33837
$-776
Cash flow
-11.6%
Cash-on-Cash Return
3.5%
Cap rate
0.7%
Rent to Value Ratio
Active
$579,000
6
bds
|
5
ba
|
3,291
sqft
|
built
2017
1577 Mulligan Blvd, Davenport, FL 33896
$-1,716
Cash flow
-15.5%
Cash-on-Cash Return
2.6%
Cap rate
0.6%
Rent to Value Ratio
Active
$195,000
2
bds
|
2
ba
|
1,173
sqft
|
built
2005
107 Rum Run, Davenport, FL 33897
$-458
Cash flow
-12.3%
Cash-on-Cash Return
3.3%
Cap rate
0.9%
Rent to Value Ratio
Active
$450,000
4
bds
|
3
ba
|
2,109
sqft
|
built
2018
195 Preston Ave, Davenport, FL 33837
$-866
Cash flow
-10.0%
Cash-on-Cash Return
3.8%
Cap rate
0.6%
Rent to Value Ratio
Active
$450,000
4
bds
|
3
ba
|
2,555
sqft
|
built
2021
2613 Camden Park Loop, Davenport, FL 33837
$-710
Cash flow
-8.2%
Cash-on-Cash Return
4.3%
Cap rate
0.7%
Rent to Value Ratio
Active
$349,800
3
bds
|
2
ba
|
1,519
sqft
|
built
2020
1415 Oak Marsh St, Davenport, FL 33837
$-1,058
Cash flow
-15.8%
Cash-on-Cash Return
2.5%
Cap rate
0.6%
Rent to Value Ratio

Active
$499,900
4
bds
|
3
ba
|
2,393
sqft
|
built
2018
1821 Benoit Ter, Davenport, FL 33837
$-1,029
Cash flow
-10.7%
Cash-on-Cash Return
3.7%
Cap rate
0.6%
Rent to Value Ratio