Davenport, FL Investment Properties for Sale
Browse homes for sale and investment properties in Davenport, FL. Refine your search by price, property type, or more.
Best cash flowing properties in Davenport, FL
Active
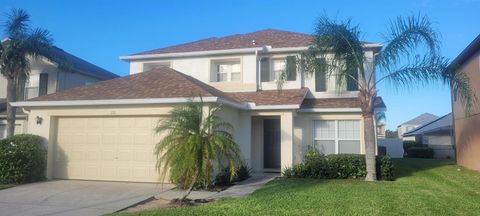
$203,000
3
bds
|
3
ba
|
1,217
sqft
|
built
2008
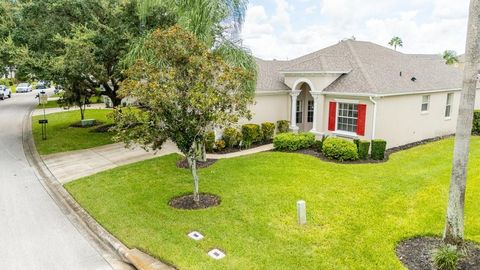
902 Charo Pkwy, Davenport, FL 33897
$-24
Cash flow
-0.6%
Cash-on-Cash Return
6.0%
Cap rate
0.9%
Rent to Value Ratio
Active
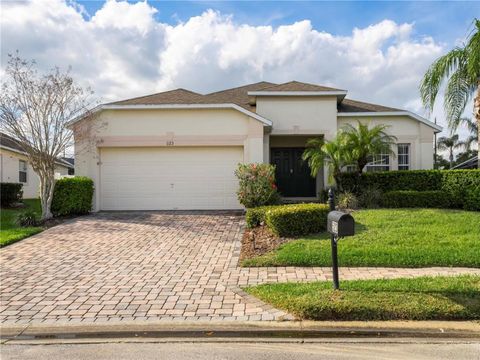
$365,000
3
bds
|
2
ba
|
1,560
sqft
|
built
2023
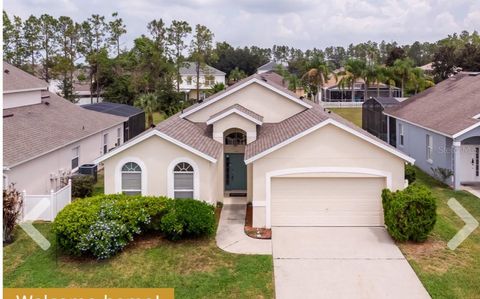
656 Daring Dr, Davenport, FL 33837
$-400
Cash flow
-5.7%
Cash-on-Cash Return
4.8%
Cap rate
0.7%
Rent to Value Ratio
690 out of 697 properties for sale in Davenport, FL
Limited Results Shown
Create a free account, or log in to reveal all property listings and enjoy the complete experience.
Active
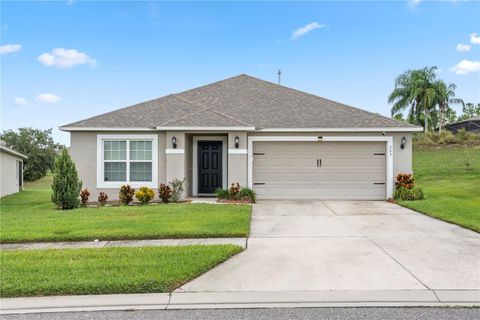
$560,000
5
bds
|
5
ba
|
2,836
sqft
|
built
2017
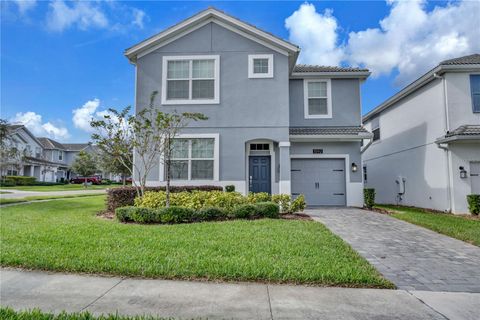
5295 Wildwood Way, Davenport, FL 33837
$-1,383
Cash flow
-12.9%
Cash-on-Cash Return
3.2%
Cap rate
0.6%
Rent to Value Ratio
Active
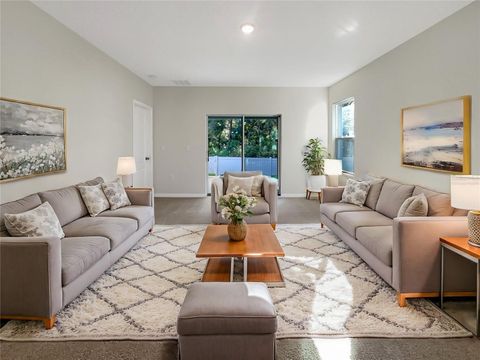
$344,900
3
bds
|
3
ba
|
1,771
sqft
|
built
2016
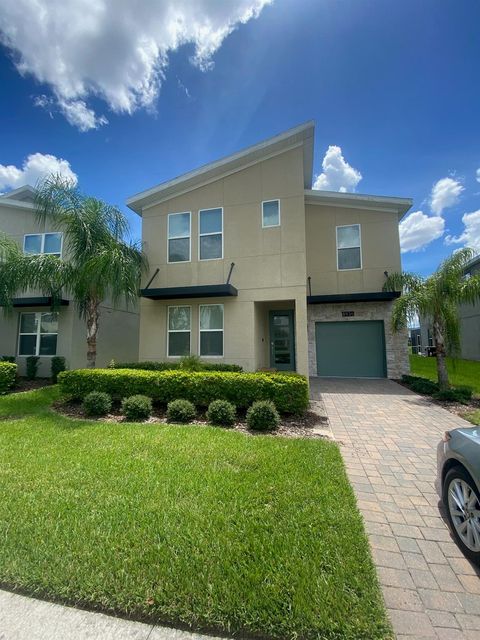
314 Captiva Dr, Davenport, FL 33896
$-820
Cash flow
-12.4%
Cash-on-Cash Return
3.3%
Cap rate
0.7%
Rent to Value Ratio
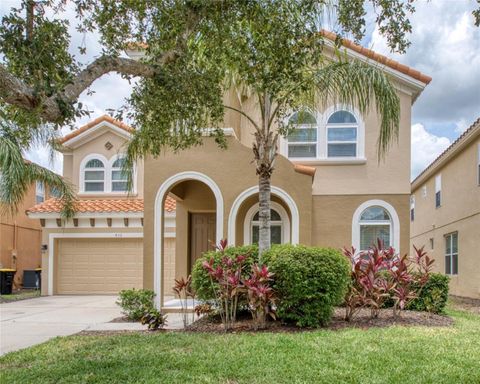
Active
$470,000
6
bds
|
4
ba
|
3,245
sqft
|
built
2005
115 Canna Dr, Davenport, FL 33897
$-682
Cash flow
-7.6%
Cash-on-Cash Return
4.4%
Cap rate
0.7%
Rent to Value Ratio
Active
$429,000
4
bds
|
3
ba
|
1,836
sqft
|
built
2002
523 Balmoral Dr, Davenport, FL 33896
$-881
Cash flow
-10.7%
Cash-on-Cash Return
3.7%
Cap rate
0.7%
Rent to Value Ratio
Active
$380,000
4
bds
|
2
ba
|
2,150
sqft
|
built
2018
205 Bella Verano Way, Davenport, FL 33897
$-535
Cash flow
-7.3%
Cash-on-Cash Return
4.5%
Cap rate
0.7%
Rent to Value Ratio
Active
$299,000
3
bds
|
2
ba
|
1,625
sqft
|
built
2022
309 Gina Ln, Davenport, FL 33837
$-591
Cash flow
-10.3%
Cash-on-Cash Return
3.8%
Cap rate
0.8%
Rent to Value Ratio
Active
$417,000
4
bds
|
2
ba
|
2,044
sqft
|
built
2022
872 Sydney St, Davenport, FL 33837
$-870
Cash flow
-10.9%
Cash-on-Cash Return
3.6%
Cap rate
0.6%
Rent to Value Ratio
Active
$165,000
2
bds
|
2
ba
|
1,039
sqft
|
built
2008
901 Charo Pkwy, Davenport, FL 33897
$-881
Cash flow
-27.9%
Cash-on-Cash Return
-0.3%
Cap rate
1.1%
Rent to Value Ratio
Active
$699,990
8
bds
|
5
ba
|
3,909
sqft
|
built
2015
1427 Rolling Fairway Dr, Davenport, FL 33896
$-2,265
Cash flow
-16.9%
Cash-on-Cash Return
2.3%
Cap rate
0.6%
Rent to Value Ratio
Active
$699,000
8
bds
|
5
ba
|
3,909
sqft
|
built
2016
9099 Hazard St, Davenport, FL 33896
$-1,908
Cash flow
-14.2%
Cash-on-Cash Return
2.9%
Cap rate
0.6%
Rent to Value Ratio
Active
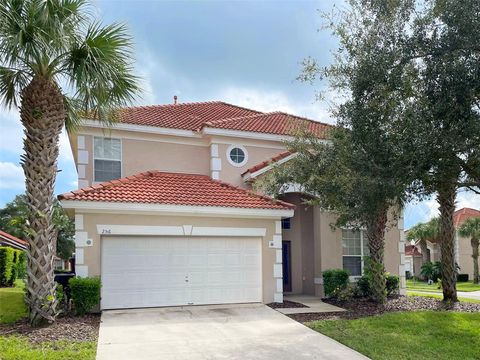
$439,000
6
bds
|
5
ba
|
2,771
sqft
|
built
2005
256 Sevilla Ave, Davenport, FL 33897
$-613
Cash flow
-7.3%
Cash-on-Cash Return
4.5%
Cap rate
0.8%
Rent to Value Ratio
Active
$529,000
6
bds
|
7
ba
|
3,619
sqft
|
built
2017
416 Orange Cosmos Blvd, Davenport, FL 33837
$-1,391
Cash flow
-13.7%
Cash-on-Cash Return
3.0%
Cap rate
0.7%
Rent to Value Ratio
Active
$367,500
3
bds
|
2
ba
|
1,388
sqft
|
built
2002
503 Balmoral Dr, Davenport, FL 33896
$-750
Cash flow
-10.6%
Cash-on-Cash Return
3.7%
Cap rate
0.7%
Rent to Value Ratio

Active
$459,000
4
bds
|
3
ba
|
1,825
sqft
|
built
2000
145 Cork Way, Davenport, FL 33897
$-600
Cash flow
-6.8%
Cash-on-Cash Return
4.6%
Cap rate
0.7%
Rent to Value Ratio
Active
$775,000
5
bds
|
3
ba
|
3,241
sqft
|
built
2014
8920 Dove Valley Way, Davenport, FL 33896
$-2,468
Cash flow
-16.6%
Cash-on-Cash Return
2.3%
Cap rate
0.6%
Rent to Value Ratio

Active
$425,000
3
bds
|
3
ba
|
1,589
sqft
|
built
2005
188 Ridgemont Ct, Davenport, FL 33896
$-1,113
Cash flow
-13.7%
Cash-on-Cash Return
3.0%
Cap rate
0.5%
Rent to Value Ratio

Active
$525,000
5
bds
|
3
ba
|
2,338
sqft
|
built
2000
139 Belfry Dr, Davenport, FL 33897
$-760
Cash flow
-7.6%
Cash-on-Cash Return
4.4%
Cap rate
0.7%
Rent to Value Ratio
Active
$425,000
5
bds
|
6
ba
|
2,460
sqft
|
built
2015
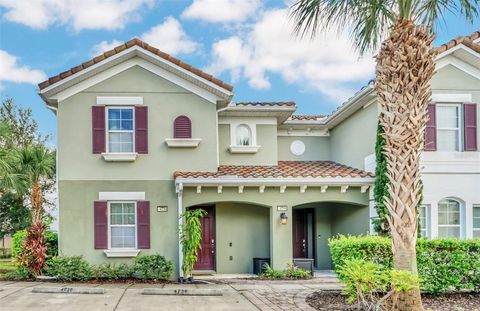
4738 Terrasonesta Dr, Davenport, FL 33837
$-1,206
Cash flow
-14.8%
Cash-on-Cash Return
2.7%
Cap rate
0.7%
Rent to Value Ratio
Active
$279,000
3
bds
|
2
ba
|
1,227
sqft
|
built
2002
703 Lucaya Loop, Davenport, FL 33897
$-555
Cash flow
-10.4%
Cash-on-Cash Return
3.8%
Cap rate
0.8%
Rent to Value Ratio
Active
$349,000
3
bds
|
2
ba
|
2,014
sqft
|
built
2005
621 Knightsbridge Cir, Davenport, FL 33896
$-636
Cash flow
-9.5%
Cash-on-Cash Return
4.0%
Cap rate
0.7%
Rent to Value Ratio
Active
$570,800
5
bds
|
3
ba
|
2,772
sqft
|
built
2002
1740 N Hampton Dr, Davenport, FL 33897
$-759
Cash flow
-6.9%
Cash-on-Cash Return
4.6%
Cap rate
0.7%
Rent to Value Ratio
Active
$520,000
6
bds
|
6
ba
|
3,579
sqft
|
built
2014
436 Orange Cosmos Blvd, Davenport, FL 33837
$-1,286
Cash flow
-12.9%
Cash-on-Cash Return
3.2%
Cap rate
0.7%
Rent to Value Ratio
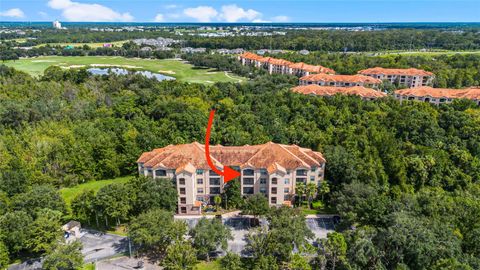
Active
$185,000
2
bds
|
2
ba
|
1,134
sqft
|
built
2008
1301 Tuscan Ter, Davenport, FL 33896
$-602
Cash flow
-17.0%
Cash-on-Cash Return
2.2%
Cap rate
1.0%
Rent to Value Ratio

Active
$919,000
9
bds
|
5
ba
|
3,909
sqft
|
built
2013
1435 Moon Valley Dr, Davenport, FL 33896
$-2,397
Cash flow
-13.6%
Cash-on-Cash Return
3.0%
Cap rate
0.6%
Rent to Value Ratio
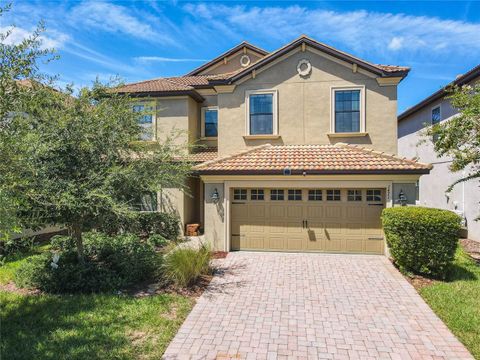
Active
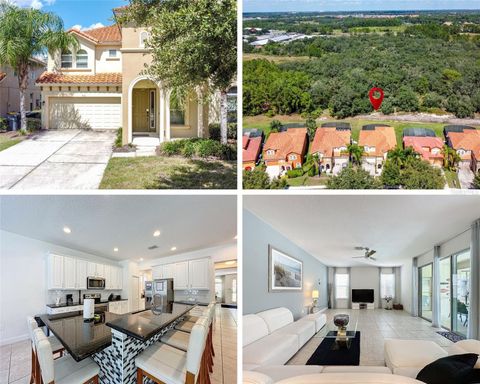
$387,200
4
bds
|
4
ba
|
2,094
sqft
|
built
2017
274 Captiva Dr, Davenport, FL 33896
$-918
Cash flow
-12.4%
Cash-on-Cash Return
3.3%
Cap rate
0.7%
Rent to Value Ratio
Active
$625,000
6
bds
|
6
ba
|
3,339
sqft
|
built
2015
1471 Rolling Fairway Dr, Davenport, FL 33896
$-1,728
Cash flow
-14.4%
Cash-on-Cash Return
2.8%
Cap rate
0.6%
Rent to Value Ratio
Active
$429,900
4
bds
|
3
ba
|
1,903
sqft
|
built
2003
441 Montara Dr, Davenport, FL 33897
$-821
Cash flow
-10.0%
Cash-on-Cash Return
3.9%
Cap rate
0.7%
Rent to Value Ratio
Active
$399,999
4
bds
|
3
ba
|
1,992
sqft
|
built
2001
443 Corvina Dr, Davenport, FL 33897
$-476
Cash flow
-6.2%
Cash-on-Cash Return
4.7%
Cap rate
0.7%
Rent to Value Ratio
Active
$670,000
6
bds
|
5
ba
|
3,291
sqft
|
built
2017
1592 Flange Dr, Davenport, FL 33896
$-1,907
Cash flow
-14.9%
Cash-on-Cash Return
2.7%
Cap rate
0.6%
Rent to Value Ratio
Active
$645,000
6
bds
|
5
ba
|
3,291
sqft
|
built
2019
8936 Cabot Cliffs Dr, Davenport, FL 33896
$-1,994
Cash flow
-16.1%
Cash-on-Cash Return
2.4%
Cap rate
0.6%
Rent to Value Ratio
Active
$515,000
5
bds
|
4
ba
|
2,487
sqft
|
built
2002
476 Calabay Parc Blvd, Davenport, FL 33897
$-1,189
Cash flow
-12.0%
Cash-on-Cash Return
3.4%
Cap rate
0.6%
Rent to Value Ratio
Active
$510,000
4
bds
|
4
ba
|
2,083
sqft
|
built
2015
2654 Rosemont Cir, Davenport, FL 33837
$-942
Cash flow
-9.6%
Cash-on-Cash Return
3.9%
Cap rate
0.6%
Rent to Value Ratio

Active
$700,000
7
bds
|
5
ba
|
3,604
sqft
|
built
2013
9101 El Caro Ln, Davenport, FL 33896
$-2,090
Cash flow
-15.6%
Cash-on-Cash Return
2.6%
Cap rate
0.6%
Rent to Value Ratio
Active
$498,900
6
bds
|
6
ba
|
2,876
sqft
|
built
2016
401 Cabello Dr, Davenport, FL 33837
$-1,168
Cash flow
-12.2%
Cash-on-Cash Return
3.3%
Cap rate
0.6%
Rent to Value Ratio

Active
$299,000
3
bds
|
3
ba
|
1,632
sqft
|
built
2015
8110 Roseville Blvd, Davenport, FL 33896
$-954
Cash flow
-16.6%
Cash-on-Cash Return
2.3%
Cap rate
0.7%
Rent to Value Ratio

Active
$392,500
5
bds
|
3
ba
|
2,522
sqft
|
built
2020
117 Eagleview Loop, Davenport, FL 33837
$-807
Cash flow
-10.7%
Cash-on-Cash Return
3.7%
Cap rate
0.7%
Rent to Value Ratio

Active
$1,145,000
6
bds
|
3
ba
|
2,850
sqft
|
built
1975
222 Rod Ln, Davenport, FL 33837
$-3,573
Cash flow
-16.3%
Cash-on-Cash Return
2.4%
Cap rate
0.3%
Rent to Value Ratio
Active
$490,000
5
bds
|
5
ba
|
2,554
sqft
|
built
2008
1038 Orange Cosmos Blvd, Davenport, FL 33837
$-1,226
Cash flow
-13.1%
Cash-on-Cash Return
3.1%
Cap rate
0.7%
Rent to Value Ratio