Davenport, IA Investment Properties for Sale
Browse homes for sale and investment properties in Davenport, IA. Refine your search by price, property type, or more.
Best cash flowing properties in Davenport, IA
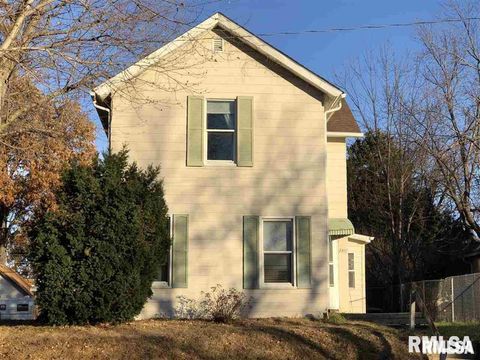
Active
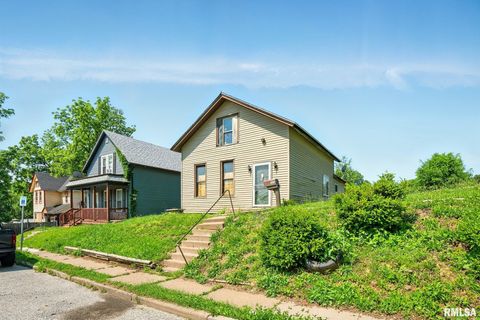
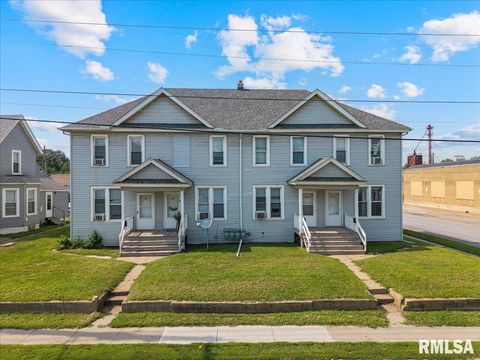
$65,000
2
bds
|
2
ba
|
1,288
sqft
|
built
1914
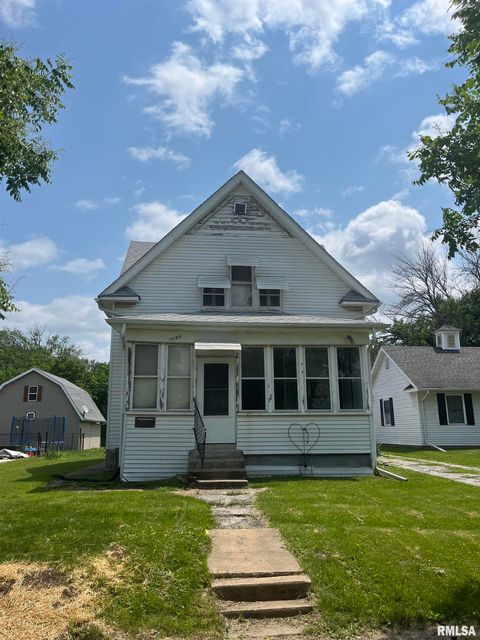
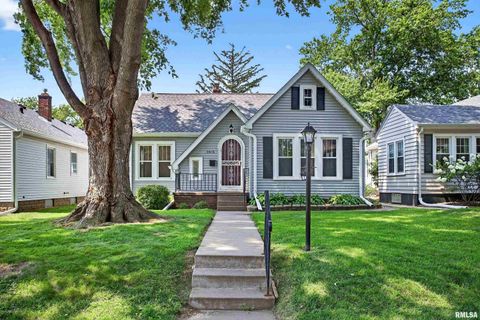
1109 S Michigan Ave, Davenport, IA 52802
$735
Cash flow
13.2%
Cash-on-Cash Return
13.6%
Cap rate
2.0%
Rent to Value Ratio
Active
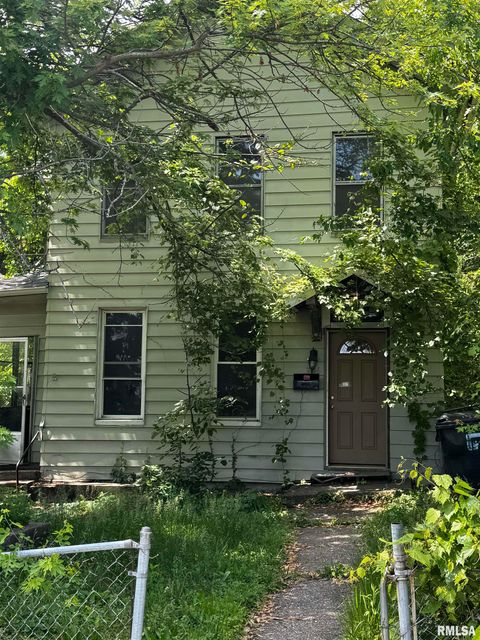
$42,500
4
bds
|
0
ba
|
0
sqft
|
built
1900
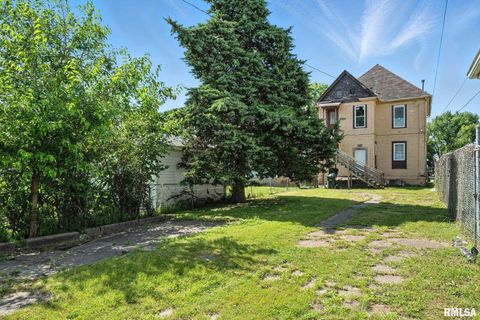
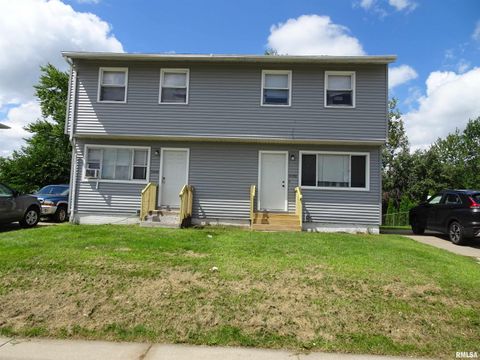
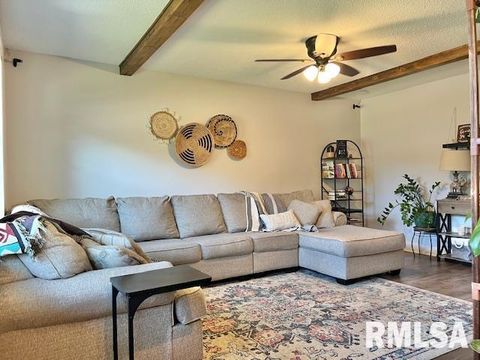
1614 W 3rd St, Davenport, IA 52802
$627
Cash flow
17.2%
Cash-on-Cash Return
17.7%
Cap rate
2.4%
Rent to Value Ratio
113 out of 142 properties for sale in Davenport, IA
Limited Results Shown
Create a free account, or log in to reveal all property listings and enjoy the complete experience.
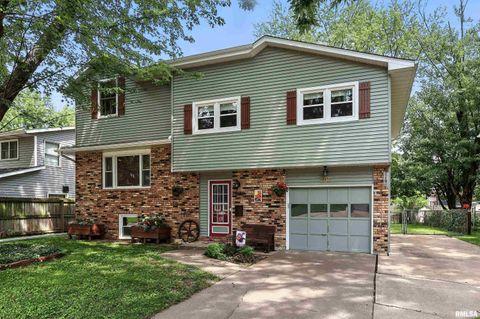
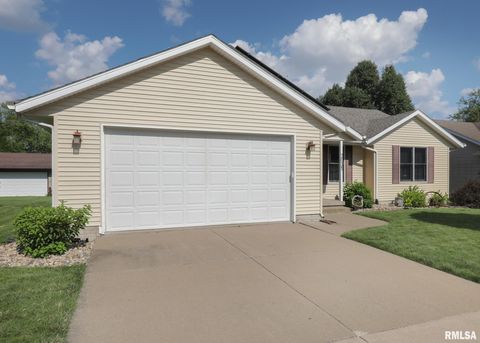
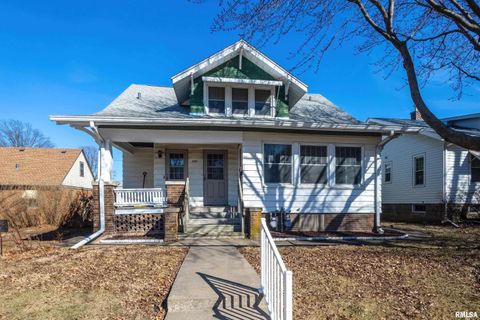
Active
$192,000
3
bds
|
2
ba
|
1,506
sqft
|
built
1942
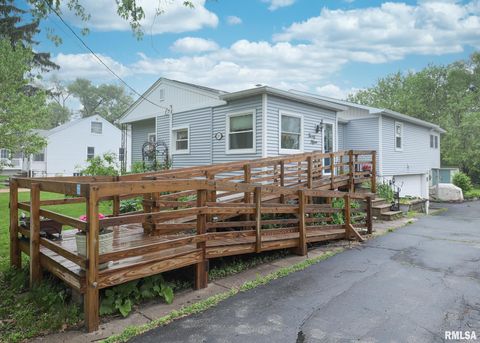
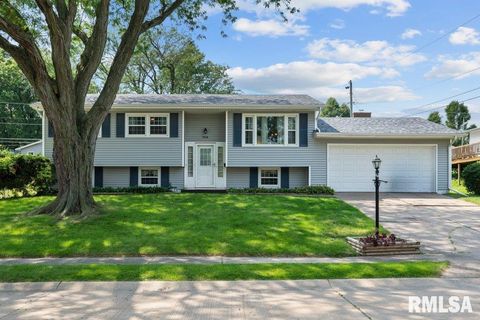
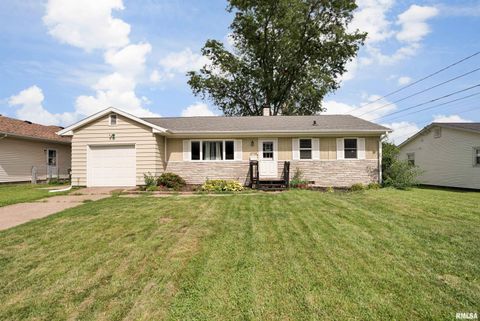
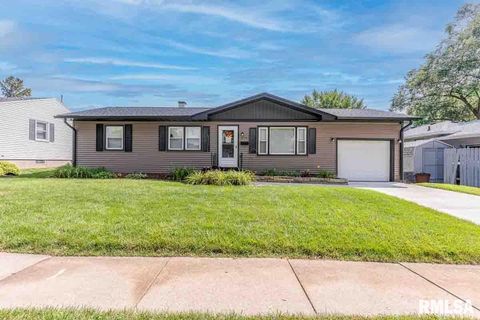
2015 N Zenith Ave, Davenport, IA 52804
$-46
Cash flow
-1.3%
Cash-on-Cash Return
5.4%
Cap rate
0.8%
Rent to Value Ratio

Active
$465,000
bds
|
0
ba
|
0
sqft
|
built
1976
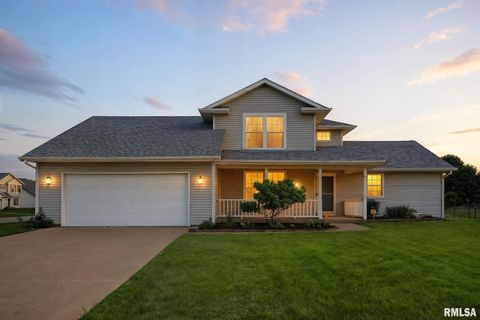
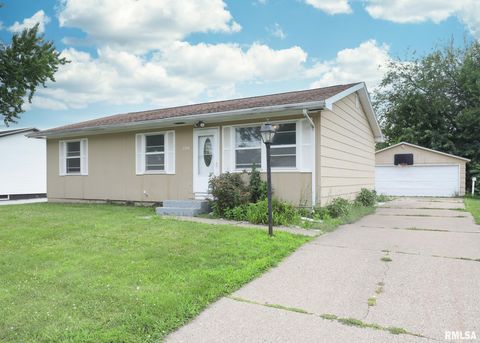
2705 N Lincoln Ave, Davenport, IA 52804
$-1,500
Cash flow
-16.8%
Cash-on-Cash Return
1.8%
Cap rate
0.4%
Rent to Value Ratio
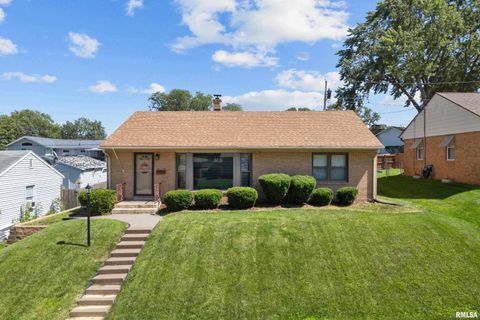
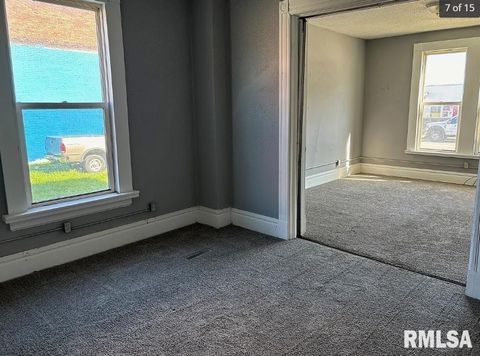
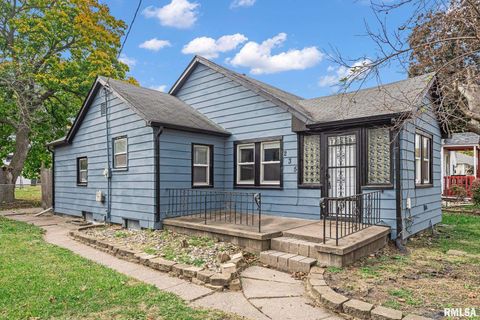
Active
$115,000
3
bds
|
1
ba
|
1,440
sqft
|
built
1900
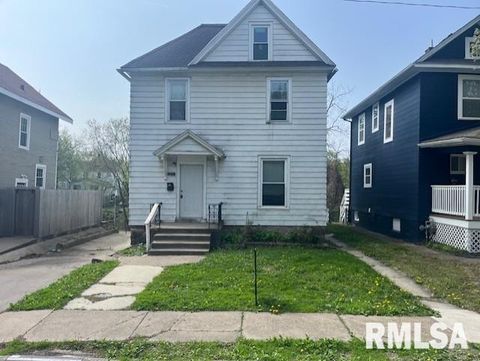
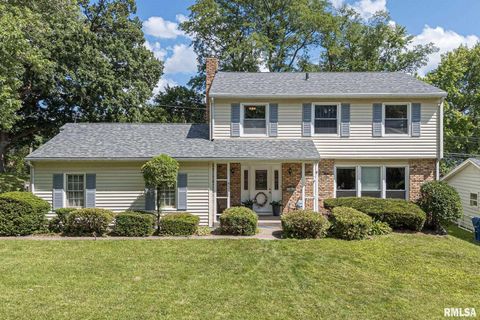
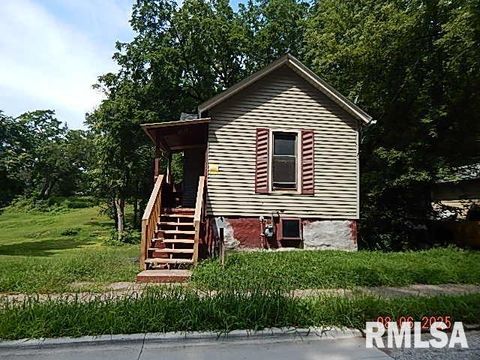
1015 Arlington Ct, Davenport, IA 52803
$61
Cash flow
2.8%
Cash-on-Cash Return
6.3%
Cap rate
1.0%
Rent to Value Ratio
Active
$379,900
bds
|
0
ba
|
0
sqft
|
built
1976
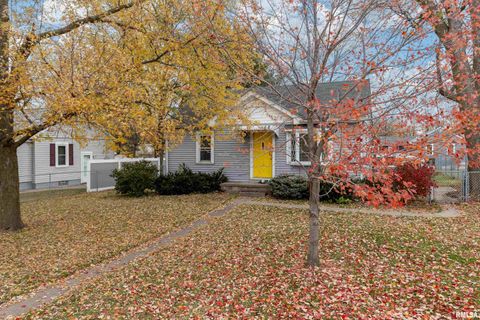
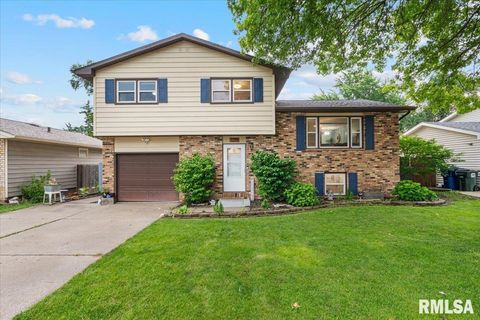
3536 Heatherton Dr, Davenport, IA 52804
$-1,017
Cash flow
-14.0%
Cash-on-Cash Return
2.5%
Cap rate
0.4%
Rent to Value Ratio
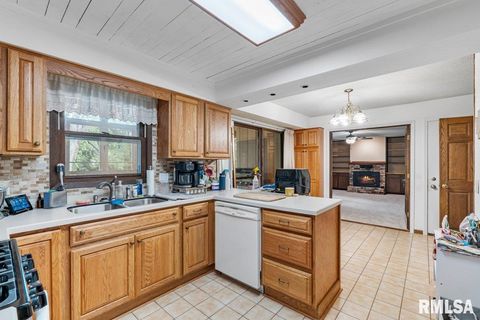
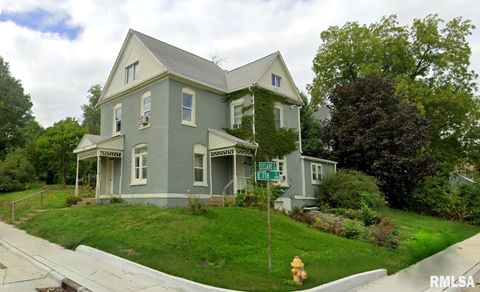
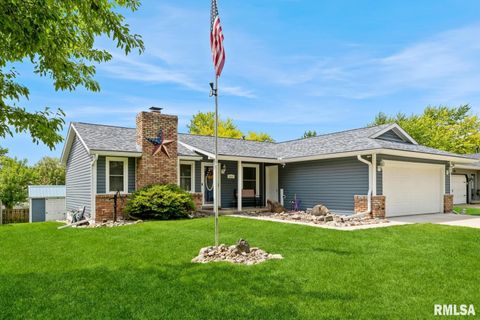
Active
$289,000
3
bds
|
3
ba
|
2,314
sqft
|
built
2000
2521 W 63rd St, Davenport, IA 52806
$-356
Cash flow
-6.4%
Cash-on-Cash Return
4.2%
Cap rate
0.7%
Rent to Value Ratio
Active
$190,000
3
bds
|
2
ba
|
1,446
sqft
|
built
1925
2704 E High St, Davenport, IA 52803
$0
Cash flow
0.0%
Cash-on-Cash Return
5.7%
Cap rate
0.8%
Rent to Value Ratio
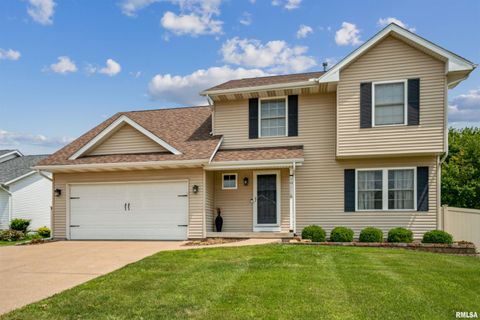
Active
$404,999
4
bds
|
4
ba
|
2,935
sqft
|
built
1957
4919 Lorton Ave, Davenport, IA 52807
$-759
Cash flow
-9.8%
Cash-on-Cash Return
3.4%
Cap rate
0.6%
Rent to Value Ratio
Active
$269,900
4
bds
|
3
ba
|
1,916
sqft
|
built
1974
3011 N Pine St, Davenport, IA 52804
$-326
Cash flow
-6.3%
Cash-on-Cash Return
4.2%
Cap rate
0.7%
Rent to Value Ratio
Active
$222,000
3
bds
|
2
ba
|
2,033
sqft
|
built
1954
2827 Fillmore Ln, Davenport, IA 52804
$-82
Cash flow
-1.9%
Cash-on-Cash Return
5.2%
Cap rate
0.8%
Rent to Value Ratio
Active
$259,900
4
bds
|
3
ba
|
2,252
sqft
|
built
1975
3615 N Elmwood Ave, Davenport, IA 52806
$-181
Cash flow
-3.6%
Cash-on-Cash Return
4.8%
Cap rate
0.8%
Rent to Value Ratio
Active
$443,000
4
bds
|
4
ba
|
2,779
sqft
|
built
2004
5811 Duggleby Ave, Davenport, IA 52807
$-468
Cash flow
-5.5%
Cash-on-Cash Return
4.4%
Cap rate
0.7%
Rent to Value Ratio
Active
$195,000
6
bds
|
0
ba
|
0
sqft
|
built
1974
5436 N Division St, Davenport, IA 52806
$-250
Cash flow
-6.7%
Cash-on-Cash Return
4.1%
Cap rate
0.7%
Rent to Value Ratio
Active
$225,000
3
bds
|
2
ba
|
1,826
sqft
|
built
1966
5018 N Harrison St, Davenport, IA 52806
$-150
Cash flow
-3.5%
Cash-on-Cash Return
4.9%
Cap rate
0.8%
Rent to Value Ratio
Active
$294,900
4
bds
|
3
ba
|
2,119
sqft
|
built
1967
4311 Wittman Dr, Davenport, IA 52806
$-226
Cash flow
-4.0%
Cash-on-Cash Return
4.8%
Cap rate
0.7%
Rent to Value Ratio
Active
$129,900
2
bds
|
1
ba
|
1,052
sqft
|
built
1944
5109 N Pine St, Davenport, IA 52806
$206
Cash flow
8.3%
Cash-on-Cash Return
7.6%
Cap rate
1.1%
Rent to Value Ratio
Active
$284,500
3
bds
|
3
ba
|
1,622
sqft
|
built
1975
2149 W 30th St, Davenport, IA 52804
$-297
Cash flow
-5.4%
Cash-on-Cash Return
4.4%
Cap rate
0.7%
Rent to Value Ratio
Active
$27,000
2
bds
|
1
ba
|
1,256
sqft
|
built
1886
1108 Brown St, Davenport, IA 52804
$578
Cash flow
24.9%
Cash-on-Cash Return
25.7%
Cap rate
3.3%
Rent to Value Ratio
Active
$190,000
3
bds
|
1
ba
|
1,294
sqft
|
built
1960
6127 Fair Ave, Davenport, IA 52806
$66
Cash flow
1.8%
Cash-on-Cash Return
6.1%
Cap rate
0.9%
Rent to Value Ratio
Active
$22,500
3
bds
|
2
ba
|
1,888
sqft
|
built
1920
706 Farnam St, Davenport, IA 52803
$606
Cash flow
31.4%
Cash-on-Cash Return
32.3%
Cap rate
4.4%
Rent to Value Ratio
Active
$174,900
3
bds
|
2
ba
|
2,140
sqft
|
built
1935
3016 Arlington Ave, Davenport, IA 52803
$179
Cash flow
5.3%
Cash-on-Cash Return
6.9%
Cap rate
1.0%
Rent to Value Ratio
Active
$269,900
3
bds
|
3
ba
|
1,544
sqft
|
built
1967
2504 W 43rd St, Davenport, IA 52806
$-131
Cash flow
-2.5%
Cash-on-Cash Return
5.1%
Cap rate
0.8%
Rent to Value Ratio
Active
$195,000
3
bds
|
2
ba
|
1,152
sqft
|
built
1956
3719 Wilkes Ave, Davenport, IA 52806
$82
Cash flow
2.2%
Cash-on-Cash Return
6.2%
Cap rate
0.9%
Rent to Value Ratio
Active
$325,000
3
bds
|
3
ba
|
1,640
sqft
|
built
2001
4511 Ruehmann Ct, Davenport, IA 52806
$-408
Cash flow
-6.5%
Cash-on-Cash Return
4.2%
Cap rate
0.7%
Rent to Value Ratio
Active
$187,500
3
bds
|
2
ba
|
1,532
sqft
|
built
1959
3119 W Lombard St, Davenport, IA 52804
$46
Cash flow
1.3%
Cash-on-Cash Return
6.0%
Cap rate
0.9%
Rent to Value Ratio
Active
$177,600
5
bds
|
2
ba
|
1,720
sqft
|
built
1971
1310 Calvin St, Davenport, IA 52804
$-27
Cash flow
-0.8%
Cash-on-Cash Return
5.5%
Cap rate
0.8%
Rent to Value Ratio
Active
$28,000
1
bds
|
1
ba
|
1,080
sqft
|
built
1900
1504 Christie St, Davenport, IA 52803
$486
Cash flow
20.2%
Cash-on-Cash Return
20.8%
Cap rate
2.9%
Rent to Value Ratio
Active
$239,000
3
bds
|
2
ba
|
1,488
sqft
|
built
1974
1215 Calvin St, Davenport, IA 52804
$-218
Cash flow
-4.8%
Cash-on-Cash Return
4.6%
Cap rate
0.7%
Rent to Value Ratio
Active
$250,000
bds
|
0
ba
|
0
sqft
|
built
1904
2502 Rockingham Rd, Davenport, IA 52802
$-393
Cash flow
-8.2%
Cash-on-Cash Return
3.8%
Cap rate
0.6%
Rent to Value Ratio
Active
$305,000
3
bds
|
3
ba
|
1,670
sqft
|
built
2003
2035 N Gayman Ave, Davenport, IA 52804
$-402
Cash flow
-6.9%
Cash-on-Cash Return
4.1%
Cap rate
0.7%
Rent to Value Ratio
Active
$239,000
bds
|
0
ba
|
0
sqft
|
built
1900
910 W 3rd St, Davenport, IA 52802
$-394
Cash flow
-8.6%
Cash-on-Cash Return
3.7%
Cap rate
0.6%
Rent to Value Ratio
Active
$217,500
4
bds
|
0
ba
|
0
sqft
|
built
1890
430 E 7th St, Davenport, IA 52803
$-311
Cash flow
-7.5%
Cash-on-Cash Return
4.0%
Cap rate
0.6%
Rent to Value Ratio
Active
$125,000
3
bds
|
2
ba
|
1,444
sqft
|
built
1879
2307 Farnam St, Davenport, IA 52803
$-7
Cash flow
-0.3%
Cash-on-Cash Return
5.6%
Cap rate
0.9%
Rent to Value Ratio
Active
$129,900
3
bds
|
0
ba
|
0
sqft
|
built
1920
2329 Pershing Ave, Davenport, IA 52803
$103
Cash flow
4.1%
Cash-on-Cash Return
6.6%
Cap rate
1.0%
Rent to Value Ratio
Active
$158,000
2
bds
|
1
ba
|
1,049
sqft
|
built
1940
235 W 32nd St, Davenport, IA 52803
$210
Cash flow
6.9%
Cash-on-Cash Return
7.3%
Cap rate
1.0%
Rent to Value Ratio
Active
$274,900
3
bds
|
2
ba
|
1,604
sqft
|
built
1981
1511 W 48th St, Davenport, IA 52806
$-335
Cash flow
-6.4%
Cash-on-Cash Return
4.2%
Cap rate
0.7%
Rent to Value Ratio
Active
$1,590,000
7
bds
|
6
ba
|
5,578
sqft
|
built
1997
2320 Cromwell Cir, Davenport, IA 52807
$-6,222
Cash flow
-20.4%
Cash-on-Cash Return
1.0%
Cap rate
0.2%
Rent to Value Ratio
Active
$514,900
5
bds
|
3
ba
|
3,087
sqft
|
built
2008
6111 Judson Cir, Davenport, IA 52807
$-1,305
Cash flow
-13.2%
Cash-on-Cash Return
2.6%
Cap rate
0.5%
Rent to Value Ratio
Active
$199,000
3
bds
|
1
ba
|
1,792
sqft
|
built
1942
807 Spalding Blvd, Davenport, IA 52804
$16
Cash flow
0.4%
Cash-on-Cash Return
5.8%
Cap rate
0.9%
Rent to Value Ratio