Davenport, IA Investment Properties for Sale
Browse homes for sale and investment properties in Davenport, IA. Refine your search by price, property type, or more.
Best cash flowing properties in Davenport, IA
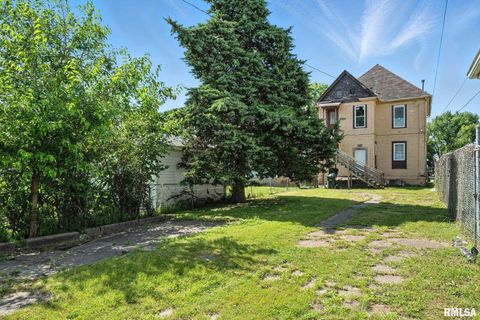
Active
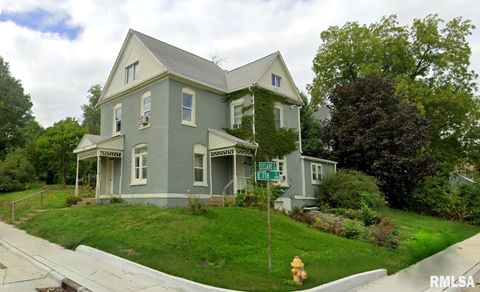
$50,000
4
bds
|
0
ba
|
0
sqft
|
built
1900
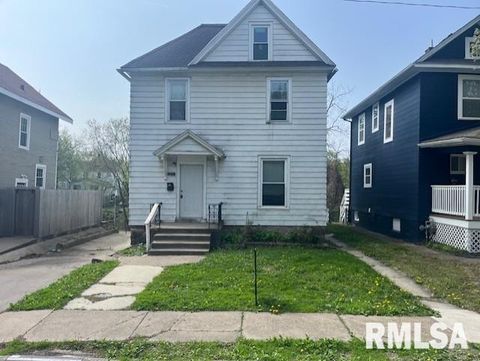
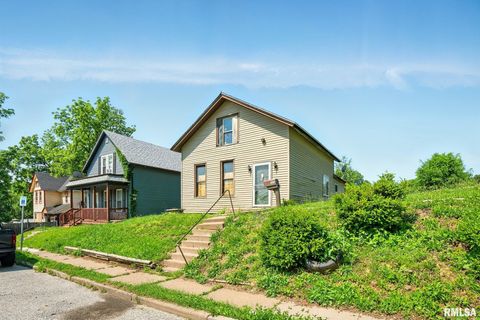
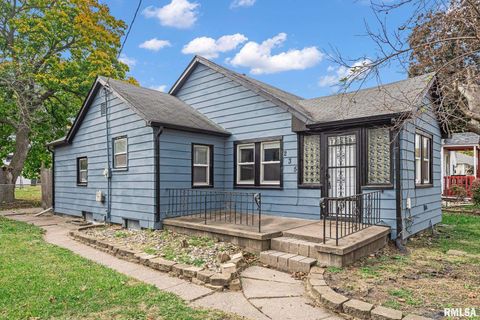
1614 W 3rd St, Davenport, IA 52802
$627
Cash flow
14.6%
Cash-on-Cash Return
15.0%
Cap rate
2.0%
Rent to Value Ratio
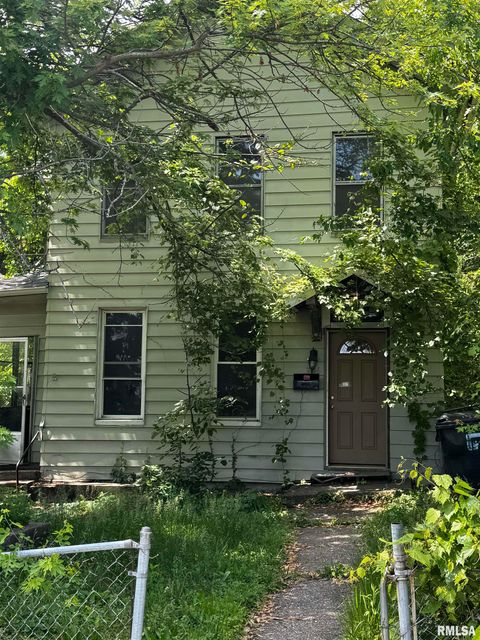
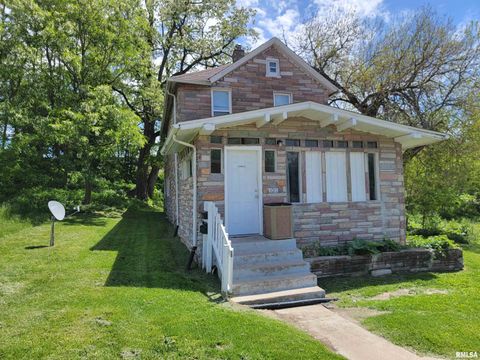
Active
$27,500
3
bds
|
2
ba
|
1,888
sqft
|
built
1920
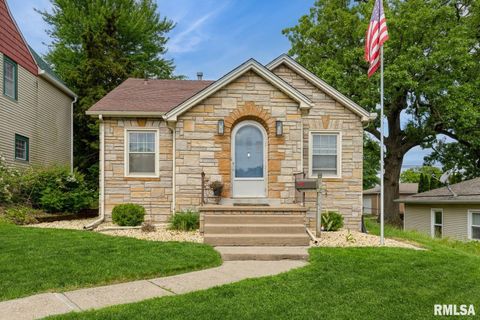
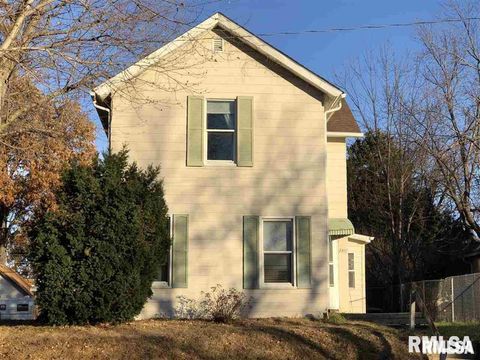
706 Farnam St, Davenport, IA 52803
$606
Cash flow
25.7%
Cash-on-Cash Return
26.4%
Cap rate
3.6%
Rent to Value Ratio
98 out of 120 properties for sale in Davenport, IA
Limited Results Shown
Create a free account, or log in to reveal all property listings and enjoy the complete experience.

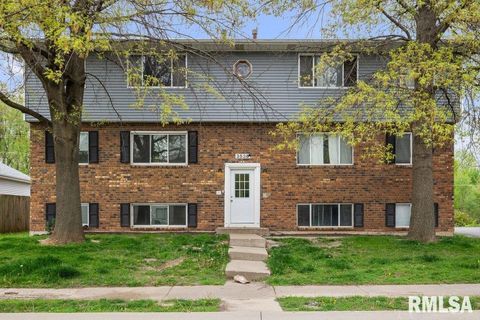
Active
$289,000
3
bds
|
3
ba
|
2,314
sqft
|
built
2000
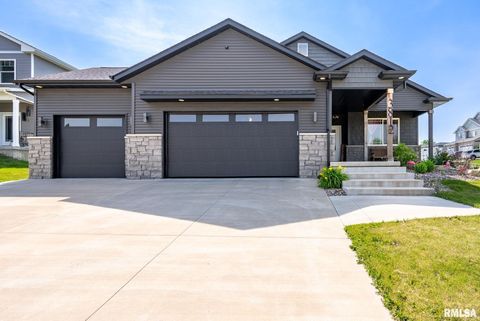
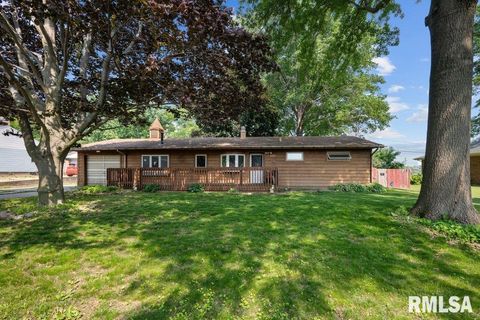
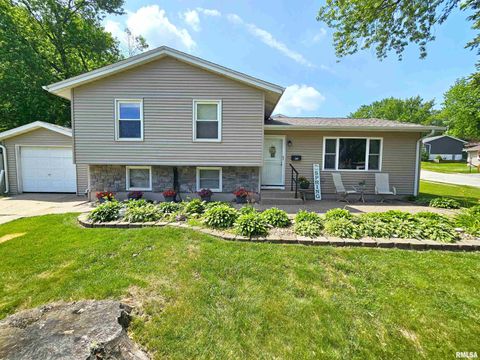
2521 W 63rd St, Davenport, IA 52806
$-497
Cash flow
-9.0%
Cash-on-Cash Return
4.2%
Cap rate
0.7%
Rent to Value Ratio
Active
$390,000
bds
|
0
ba
|
0
sqft
|
built
1976
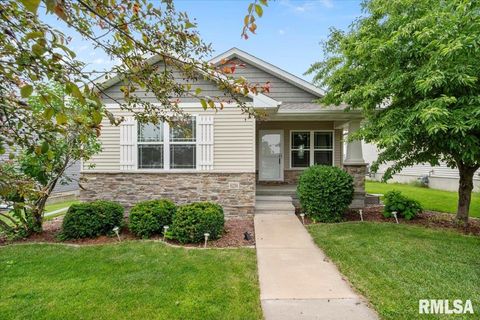
3536 Heatherton Dr, Davenport, IA 52804
$-1,255
Cash flow
-16.8%
Cash-on-Cash Return
2.4%
Cap rate
0.4%
Rent to Value Ratio

Active
$375,000
5
bds
|
4
ba
|
3,245
sqft
|
built
1978
5833 Taylor St, Davenport, IA 52806
$-613
Cash flow
-8.5%
Cash-on-Cash Return
4.3%
Cap rate
0.7%
Rent to Value Ratio

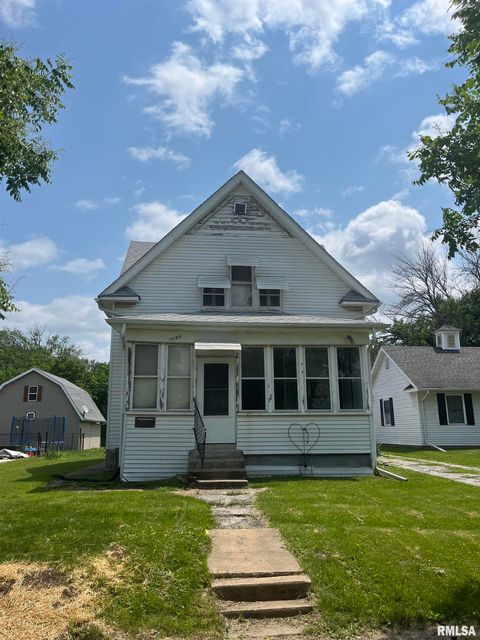
Active
$47,900
3
bds
|
1
ba
|
1,345
sqft
|
built
1914
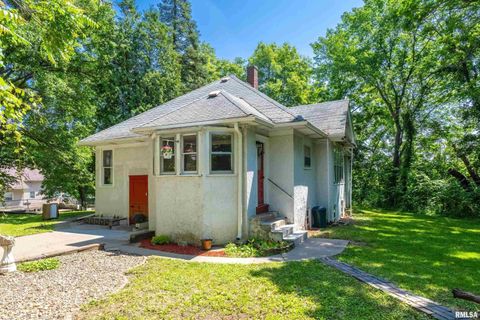
2120 Telegraph Rd, Davenport, IA 52804
$555
Cash flow
13.5%
Cash-on-Cash Return
13.9%
Cap rate
2.1%
Rent to Value Ratio

Active
$192,000
3
bds
|
2
ba
|
1,506
sqft
|
built
1942
2015 N Zenith Ave, Davenport, IA 52804
$-139
Cash flow
-3.8%
Cash-on-Cash Return
5.4%
Cap rate
0.8%
Rent to Value Ratio

Active
$290,000
4
bds
|
2
ba
|
2,190
sqft
|
built
1976
3246 Woodland Ct, Davenport, IA 52807
$-445
Cash flow
-8.0%
Cash-on-Cash Return
4.4%
Cap rate
0.7%
Rent to Value Ratio

Active
$465,000
bds
|
0
ba
|
0
sqft
|
built
1976
2705 N Lincoln Ave, Davenport, IA 52804
$-1,727
Cash flow
-19.4%
Cash-on-Cash Return
1.8%
Cap rate
0.4%
Rent to Value Ratio
Active
$75,000
2
bds
|
2
ba
|
1,288
sqft
|
built
1914
1109 S Michigan Ave, Davenport, IA 52802
$380
Cash flow
26.4%
Cash-on-Cash Return
11.8%
Cap rate
1.7%
Rent to Value Ratio

Active
$439,900
4
bds
|
4
ba
|
3,495
sqft
|
built
1996
4622 E 49th Ct, Davenport, IA 52807
$-542
Cash flow
-6.4%
Cash-on-Cash Return
4.2%
Cap rate
0.7%
Rent to Value Ratio
Active
$119,000
3
bds
|
1
ba
|
1,440
sqft
|
built
1900
1015 Arlington Ct, Davenport, IA 52803
$42
Cash flow
1.8%
Cash-on-Cash Return
6.1%
Cap rate
0.9%
Rent to Value Ratio

Active
$89,900
2
bds
|
0
ba
|
0
sqft
|
built
1920
1101 N Gaines St, Davenport, IA 52804
$153
Cash flow
8.9%
Cash-on-Cash Return
8.3%
Cap rate
1.1%
Rent to Value Ratio
Active
$445,000
3
bds
|
4
ba
|
1,953
sqft
|
built
2022
3812 Joyce Ln, Davenport, IA 52806
$-88
Cash flow
-1.0%
Cash-on-Cash Return
5.4%
Cap rate
0.7%
Rent to Value Ratio
Active
$155,000
2
bds
|
2
ba
|
2,058
sqft
|
built
1910
3123 Commodore St, Davenport, IA 52802
$19
Cash flow
0.6%
Cash-on-Cash Return
5.8%
Cap rate
0.8%
Rent to Value Ratio

Active
$134,900
3
bds
|
2
ba
|
1,925
sqft
|
built
1887
232 E 13th St, Davenport, IA 52803
$267
Cash flow
10.3%
Cash-on-Cash Return
8.1%
Cap rate
1.2%
Rent to Value Ratio

Active
$114,900
2
bds
|
1
ba
|
816
sqft
|
built
1953
2116 W 68th St, Davenport, IA 52806
$-96
Cash flow
-4.4%
Cash-on-Cash Return
5.3%
Cap rate
0.8%
Rent to Value Ratio

Active
$649,900
bds
|
0
ba
|
0
sqft
|
built
1966
3567 Kimberly Downs Rd, Davenport, IA 52807
$-3,857
Cash flow
-31.0%
Cash-on-Cash Return
-0.9%
Cap rate
0.2%
Rent to Value Ratio
Active
$287,500
3
bds
|
3
ba
|
1,622
sqft
|
built
1975
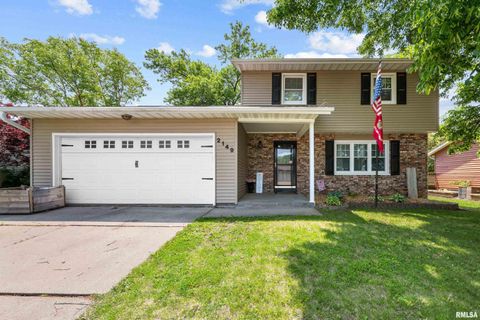
2149 W 30th St, Davenport, IA 52804
$-443
Cash flow
-8.0%
Cash-on-Cash Return
4.4%
Cap rate
0.7%
Rent to Value Ratio
Active
$30,000
2
bds
|
1
ba
|
1,256
sqft
|
built
1886
1108 Brown St, Davenport, IA 52804
$578
Cash flow
22.4%
Cash-on-Cash Return
23.1%
Cap rate
3.0%
Rent to Value Ratio
Active
$190,000
2
bds
|
1
ba
|
965
sqft
|
built
1947
2220 Warren St, Davenport, IA 52804
$-233
Cash flow
-6.4%
Cash-on-Cash Return
4.8%
Cap rate
0.7%
Rent to Value Ratio

Active
$187,900
6
bds
|
0
ba
|
0
sqft
|
built
1914
1812 Pershing Ave, Davenport, IA 52803
$-577
Cash flow
-16.0%
Cash-on-Cash Return
2.6%
Cap rate
0.5%
Rent to Value Ratio

Active
$165,000
4
bds
|
0
ba
|
0
sqft
|
built
1900
1012 Bridge Ave, Davenport, IA 52803
$-289
Cash flow
-9.1%
Cash-on-Cash Return
4.2%
Cap rate
0.7%
Rent to Value Ratio

Active
$230,000
6
bds
|
0
ba
|
0
sqft
|
built
1900
1421 Grand Ave, Davenport, IA 52803
$-534
Cash flow
-12.1%
Cash-on-Cash Return
3.5%
Cap rate
0.6%
Rent to Value Ratio
Active
$225,000
3
bds
|
1
ba
|
1,294
sqft
|
built
1960
6127 Fair Ave, Davenport, IA 52806
$-210
Cash flow
-4.9%
Cash-on-Cash Return
5.1%
Cap rate
0.8%
Rent to Value Ratio

Active
$82,500
2
bds
|
1
ba
|
1,344
sqft
|
built
1905
1931 W 4th St, Davenport, IA 52802
$366
Cash flow
23.1%
Cash-on-Cash Return
11.6%
Cap rate
1.6%
Rent to Value Ratio

Active
$414,000
bds
|
0
ba
|
0
sqft
|
built
1981
3920 W 13th St, Davenport, IA 52804
$-1,488
Cash flow
-18.8%
Cash-on-Cash Return
2.0%
Cap rate
0.3%
Rent to Value Ratio
Active
$339,900
3
bds
|
3
ba
|
1,780
sqft
|
built
2013
6234 Mississippi Ave, Davenport, IA 52807
$-556
Cash flow
-8.5%
Cash-on-Cash Return
3.7%
Cap rate
0.6%
Rent to Value Ratio
Active
$194,900
3
bds
|
1
ba
|
1,276
sqft
|
built
1966
315 Colony Dr, Davenport, IA 52806
$-17
Cash flow
-0.5%
Cash-on-Cash Return
5.6%
Cap rate
0.8%
Rent to Value Ratio
Active
$158,000
2
bds
|
1
ba
|
1,049
sqft
|
built
1940
235 W 32nd St, Davenport, IA 52803
$133
Cash flow
4.4%
Cash-on-Cash Return
7.3%
Cap rate
1.0%
Rent to Value Ratio

Active
$399,900
8
bds
|
8
ba
|
4,124
sqft
|
built
1895
817 W 7th St, Davenport, IA 52802
$-497
Cash flow
-6.5%
Cash-on-Cash Return
4.8%
Cap rate
0.7%
Rent to Value Ratio

Active
$499,900
3
bds
|
2
ba
|
1,910
sqft
|
built
2019
6113 Christie Ct, Davenport, IA 52807
$-1,124
Cash flow
-11.7%
Cash-on-Cash Return
3.6%
Cap rate
0.6%
Rent to Value Ratio
Active
$239,000
bds
|
0
ba
|
0
sqft
|
built
1900
910 W 3rd St, Davenport, IA 52802
$-511
Cash flow
-11.2%
Cash-on-Cash Return
3.7%
Cap rate
0.6%
Rent to Value Ratio

Active
$827,500
bds
|
0
ba
|
0
sqft
|
built
1905
515 N Ripley St, Davenport, IA 52803
$-4,412
Cash flow
-27.8%
Cash-on-Cash Return
-0.1%
Cap rate
0.1%
Rent to Value Ratio

Active
$89,900
3
bds
|
1
ba
|
1,092
sqft
|
built
1978
614 W 64th St, Davenport, IA 52806
$232
Cash flow
13.5%
Cash-on-Cash Return
9.4%
Cap rate
1.4%
Rent to Value Ratio
Active
$125,000
3
bds
|
2
ba
|
1,444
sqft
|
built
1879
2307 Farnam St, Davenport, IA 52803
$-68
Cash flow
-2.8%
Cash-on-Cash Return
5.6%
Cap rate
0.9%
Rent to Value Ratio

Active
$599,999
3
bds
|
3
ba
|
3,300
sqft
|
built
2016
11669 131st Street Ct, Davenport, IA 52804
$-1,291
Cash flow
-11.2%
Cash-on-Cash Return
3.7%
Cap rate
0.6%
Rent to Value Ratio
Active
$223,000
4
bds
|
0
ba
|
0
sqft
|
built
1890
430 E 7th St, Davenport, IA 52803
$-440
Cash flow
-10.3%
Cash-on-Cash Return
3.9%
Cap rate
0.6%
Rent to Value Ratio

Active
$83,500
4
bds
|
1
ba
|
1,578
sqft
|
built
1900
616 E 6th St, Davenport, IA 52803
$363
Cash flow
22.7%
Cash-on-Cash Return
11.5%
Cap rate
1.7%
Rent to Value Ratio
Active
$105,000
4
bds
|
0
ba
|
0
sqft
|
built
1900
1011 N Ripley St, Davenport, IA 52803
$87
Cash flow
4.3%
Cash-on-Cash Return
6.7%
Cap rate
1.0%
Rent to Value Ratio