Davenport, IA Investment Properties for Sale
Browse homes for sale and investment properties in Davenport, IA. Refine your search by price, property type, or more.
Best cash flowing properties in Davenport, IA
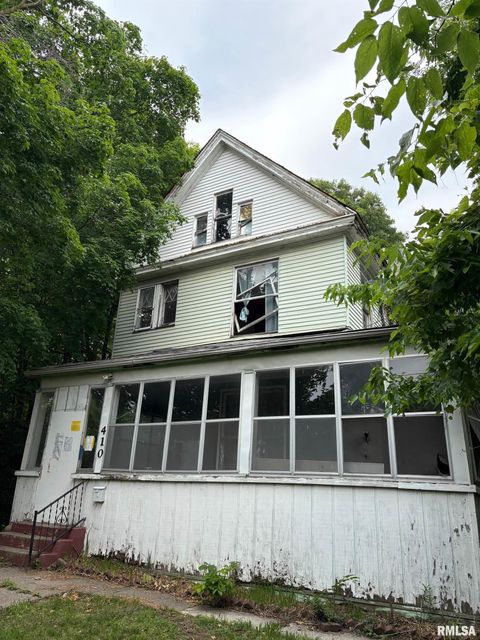
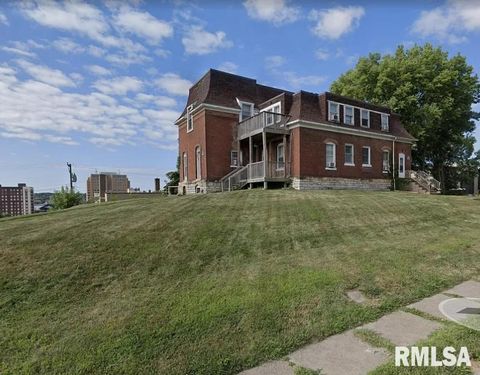
Active
$30,000
3
bds
|
2
ba
|
3,310
sqft
|
built
1910
410 W 8th St, Davenport, IA 52803
$960
Cash flow
37.3%
Cash-on-Cash Return
38.4%
Cap rate
5.3%
Rent to Value Ratio

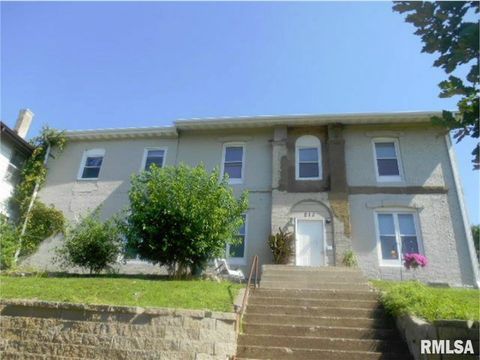
Active
$45,000
2
bds
|
2
ba
|
1,162
sqft
|
built
1864
2208 E Locust St, Davenport, IA 52803
$602
Cash flow
15.6%
Cash-on-Cash Return
16.1%
Cap rate
2.4%
Rent to Value Ratio
104 out of 165 properties for sale in Davenport, IA
Limited Results Shown
Create a free account, or log in to reveal all property listings and enjoy the complete experience.

Active
$399,900
8
bds
|
8
ba
|
4,124
sqft
|
built
1895
817 W 7th St, Davenport, IA 52802
$-497
Cash flow
-6.5%
Cash-on-Cash Return
4.8%
Cap rate
0.7%
Rent to Value Ratio

Active
$550,000
4
bds
|
4
ba
|
3,166
sqft
|
built
2014
9932 123rd St, Davenport, IA 52804
$-1,132
Cash flow
-10.7%
Cash-on-Cash Return
3.8%
Cap rate
0.6%
Rent to Value Ratio

Active
$152,500
3
bds
|
2
ba
|
2,026
sqft
|
built
1920
2329 Pershing Ave, Davenport, IA 52803
$-4
Cash flow
-0.1%
Cash-on-Cash Return
5.6%
Cap rate
0.9%
Rent to Value Ratio
Active
$45,000
2
bds
|
2
ba
|
1,162
sqft
|
built
1864
2208 E Locust St, Davenport, IA 52803
$602
Cash flow
15.6%
Cash-on-Cash Return
16.1%
Cap rate
2.4%
Rent to Value Ratio
Active
$105,000
2
bds
|
0
ba
|
0
sqft
|
built
1920
2349 W 2nd St, Davenport, IA 52802
$-111
Cash flow
-5.5%
Cash-on-Cash Return
4.4%
Cap rate
0.7%
Rent to Value Ratio
Active
$199,900
bds
|
0
ba
|
0
sqft
|
built
1900
1703 Brady St, Davenport, IA 52803
$-264
Cash flow
-6.9%
Cash-on-Cash Return
4.1%
Cap rate
0.7%
Rent to Value Ratio
Active
$159,900
4
bds
|
2
ba
|
1,226
sqft
|
built
1971
4125 Cresthill Dr, Davenport, IA 52806
$97
Cash flow
3.2%
Cash-on-Cash Return
7.0%
Cap rate
1.1%
Rent to Value Ratio
Active
$490,000
4
bds
|
0
ba
|
0
sqft
|
built
1920
620 N Perry St, Davenport, IA 52803
$-1,792
Cash flow
-19.1%
Cash-on-Cash Return
1.9%
Cap rate
0.4%
Rent to Value Ratio

Active
$750,000
4
bds
|
3
ba
|
3,617
sqft
|
built
2017
1335 N Utah Ave, Davenport, IA 52804
$-2,809
Cash flow
-19.5%
Cash-on-Cash Return
1.8%
Cap rate
0.4%
Rent to Value Ratio

Active
$149,000
3
bds
|
1
ba
|
1,020
sqft
|
built
1900
2025 W 3rd St, Davenport, IA 52802
$-198
Cash flow
-6.9%
Cash-on-Cash Return
4.7%
Cap rate
0.7%
Rent to Value Ratio

Active
$215,000
4
bds
|
2
ba
|
2,154
sqft
|
built
1920
2505 Iowa St, Davenport, IA 52803
$-61
Cash flow
-1.5%
Cash-on-Cash Return
5.9%
Cap rate
0.9%
Rent to Value Ratio

Active
$239,900
3
bds
|
2
ba
|
1,661
sqft
|
built
1954
2845 Washington Ln, Davenport, IA 52804
$-389
Cash flow
-8.5%
Cash-on-Cash Return
4.3%
Cap rate
0.7%
Rent to Value Ratio

Active
$280,000
4
bds
|
3
ba
|
2,052
sqft
|
built
1978
5721 Taylor St, Davenport, IA 52806
$-390
Cash flow
-7.3%
Cash-on-Cash Return
4.6%
Cap rate
0.7%
Rent to Value Ratio
Active
$450,000
bds
|
0
ba
|
0
sqft
|
built
1900
212 E 6th St, Davenport, IA 52803
$-1,941
Cash flow
-22.5%
Cash-on-Cash Return
1.1%
Cap rate
0.4%
Rent to Value Ratio

Active
$99,900
4
bds
|
2
ba
|
1,790
sqft
|
built
1907
1032 Kirkwood Blvd, Davenport, IA 52803
$128
Cash flow
6.7%
Cash-on-Cash Return
7.8%
Cap rate
1.2%
Rent to Value Ratio

Active
$245,000
2
bds
|
0
ba
|
0
sqft
|
built
1921
2107 N Marquette St, Davenport, IA 52804
$-494
Cash flow
-10.5%
Cash-on-Cash Return
3.8%
Cap rate
0.6%
Rent to Value Ratio

Active
$194,500
2
bds
|
2
ba
|
1,390
sqft
|
built
1951
2610 N Division St, Davenport, IA 52804
$-259
Cash flow
-6.9%
Cash-on-Cash Return
4.7%
Cap rate
0.7%
Rent to Value Ratio

Active
$149,900
3
bds
|
1
ba
|
1,196
sqft
|
built
1920
1122 E Colorado St, Davenport, IA 52803
$-20
Cash flow
-0.7%
Cash-on-Cash Return
6.1%
Cap rate
0.9%
Rent to Value Ratio
Active
$249,999
3
bds
|
2
ba
|
2,240
sqft
|
built
1957
3430 W Locust St, Davenport, IA 52804
$-186
Cash flow
-3.9%
Cash-on-Cash Return
5.4%
Cap rate
0.8%
Rent to Value Ratio
Active
$275,000
3
bds
|
2
ba
|
2,306
sqft
|
built
1969
3816 Woodland Ct, Davenport, IA 52807
$-238
Cash flow
-4.5%
Cash-on-Cash Return
5.2%
Cap rate
0.8%
Rent to Value Ratio
Active
$359,000
4
bds
|
3
ba
|
2,650
sqft
|
built
1992
4612 Marquette St, Davenport, IA 52806
$-587
Cash flow
-8.5%
Cash-on-Cash Return
4.3%
Cap rate
0.7%
Rent to Value Ratio
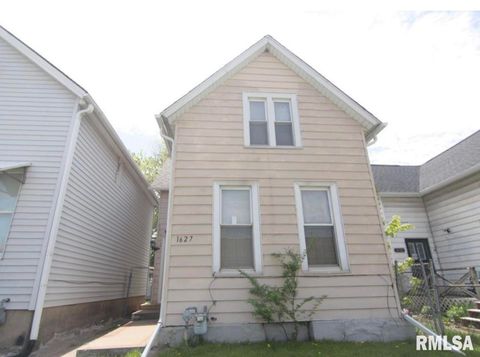
Active
$95,000
2
bds
|
1
ba
|
988
sqft
|
built
1900
1627 W 4th St, Davenport, IA 52802
$123
Cash flow
6.8%
Cash-on-Cash Return
7.8%
Cap rate
1.1%
Rent to Value Ratio
Active
$30,000
3
bds
|
2
ba
|
3,310
sqft
|
built
1910
410 W 8th St, Davenport, IA 52803
$960
Cash flow
37.3%
Cash-on-Cash Return
38.4%
Cap rate
5.3%
Rent to Value Ratio
Active
$103,000
3
bds
|
0
ba
|
0
sqft
|
built
1880
415 E 7th St, Davenport, IA 52803
$23
Cash flow
1.2%
Cash-on-Cash Return
6.5%
Cap rate
1.0%
Rent to Value Ratio

Active
$93,500
3
bds
|
1
ba
|
1,174
sqft
|
built
1900
1519 W 7th St, Davenport, IA 52802
$178
Cash flow
9.9%
Cash-on-Cash Return
8.5%
Cap rate
1.2%
Rent to Value Ratio

Active
$215,000
2
bds
|
2
ba
|
2,400
sqft
|
built
1981
2531 E 51st St, Davenport, IA 52807
$-283
Cash flow
-6.9%
Cash-on-Cash Return
4.1%
Cap rate
0.7%
Rent to Value Ratio
Active
$220,000
4
bds
|
0
ba
|
0
sqft
|
built
1900
705 Brady St, Davenport, IA 52803
$-315
Cash flow
-7.5%
Cash-on-Cash Return
4.0%
Cap rate
0.7%
Rent to Value Ratio

Active
$299,900
3
bds
|
2
ba
|
2,110
sqft
|
built
1954
1 Kenwood Ave, Davenport, IA 52803
$-242
Cash flow
-4.2%
Cash-on-Cash Return
5.3%
Cap rate
0.8%
Rent to Value Ratio

Active
$120,000
2
bds
|
1
ba
|
934
sqft
|
built
1983
3807 Spring St, Davenport, IA 52807
$10
Cash flow
0.4%
Cash-on-Cash Return
6.4%
Cap rate
0.9%
Rent to Value Ratio

Active
$125,000
4
bds
|
1
ba
|
1,820
sqft
|
built
1900
1207 Tremont Ave, Davenport, IA 52803
$158
Cash flow
6.6%
Cash-on-Cash Return
7.8%
Cap rate
1.1%
Rent to Value Ratio

Active
$189,000
3
bds
|
2
ba
|
1,490
sqft
|
built
1975
3110 N Pine St, Davenport, IA 52804
$-242
Cash flow
-6.7%
Cash-on-Cash Return
4.7%
Cap rate
0.7%
Rent to Value Ratio

Active
$107,900
4
bds
|
1
ba
|
1,772
sqft
|
built
1900
1127 N Ripley St, Davenport, IA 52803
$170
Cash flow
8.2%
Cash-on-Cash Return
8.2%
Cap rate
1.1%
Rent to Value Ratio
Active
$112,500
5
bds
|
2
ba
|
1,752
sqft
|
built
1902
1607 W 8th St, Davenport, IA 52802
$32
Cash flow
1.5%
Cash-on-Cash Return
6.6%
Cap rate
1.0%
Rent to Value Ratio

Active
$285,000
4
bds
|
2
ba
|
1,414
sqft
|
built
2019
1719 Carson Dr, Davenport, IA 52804
$-563
Cash flow
-10.3%
Cash-on-Cash Return
3.9%
Cap rate
0.6%
Rent to Value Ratio

Active
$369,900
4
bds
|
3
ba
|
2,852
sqft
|
built
1997
3217 Arlington Cir, Davenport, IA 52803
$-650
Cash flow
-9.2%
Cash-on-Cash Return
4.2%
Cap rate
0.7%
Rent to Value Ratio
Active
$159,000
3
bds
|
2
ba
|
1,704
sqft
|
built
1910
1201 W 17th St, Davenport, IA 52804
$36
Cash flow
1.2%
Cash-on-Cash Return
6.5%
Cap rate
0.9%
Rent to Value Ratio

Active
$89,900
3
bds
|
2
ba
|
1,548
sqft
|
built
1900
229 Washington St, Davenport, IA 52802
$287
Cash flow
16.7%
Cash-on-Cash Return
10.1%
Cap rate
1.4%
Rent to Value Ratio
Active
$75,000
bds
|
0
ba
|
0
sqft
|
built
1900
2024 W 6th St, Davenport, IA 52802
$258
Cash flow
17.9%
Cash-on-Cash Return
9.8%
Cap rate
1.7%
Rent to Value Ratio

Active
$313,900
3
bds
|
3
ba
|
2,305
sqft
|
built
1984
1425 W 48th St, Davenport, IA 52806
$-448
Cash flow
-7.4%
Cash-on-Cash Return
4.0%
Cap rate
0.6%
Rent to Value Ratio

Active
$229,900
5
bds
|
2
ba
|
1,981
sqft
|
built
1920
2302 Western Ave, Davenport, IA 52803
$-240
Cash flow
-5.4%
Cash-on-Cash Return
4.4%
Cap rate
0.7%
Rent to Value Ratio