Davenport, IA Investment Properties for Sale
Browse homes for sale and investment properties in Davenport, IA. Refine your search by price, property type, or more.
Best cash flowing properties in Davenport, IA

Pending
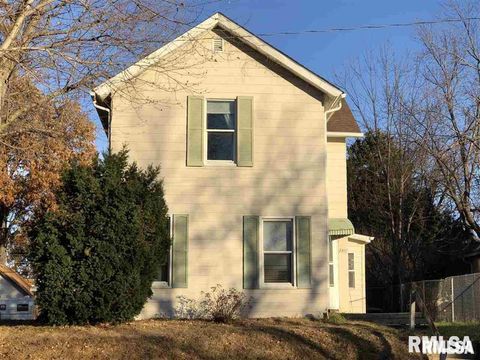
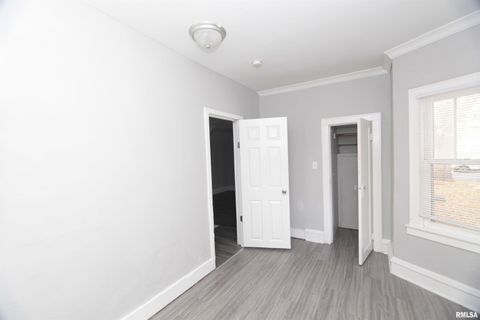
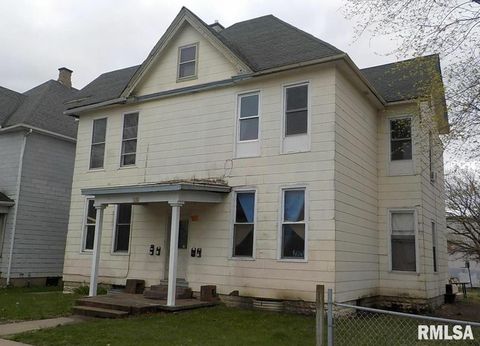
$11,500
2
bds
|
1
ba
|
1,094
sqft
|
built
1900
1401 W 10th St, Davenport, IA 52804
$698
Cash flow
70.7%
Cash-on-Cash Return
72.8%
Cap rate
9.6%
Rent to Value Ratio

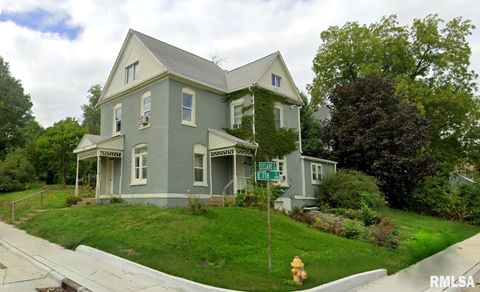
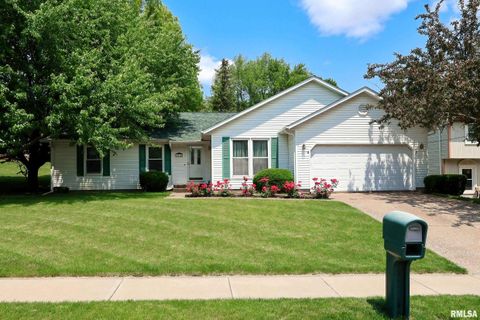
Active
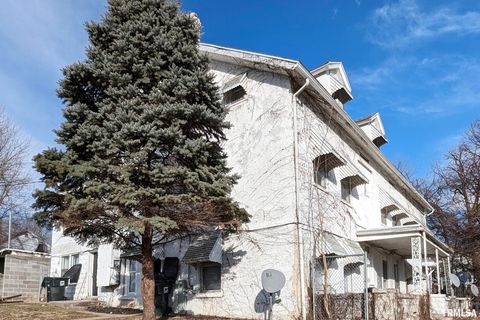
$62,000
2
bds
|
0
ba
|
0
sqft
|
built
1910
1213 N Ripley St, Davenport, IA 52803
$594
Cash flow
11.2%
Cash-on-Cash Return
11.5%
Cap rate
1.6%
Rent to Value Ratio
132 out of 162 properties for sale in Davenport, IA
Limited Results Shown
Create a free account, or log in to reveal all property listings and enjoy the complete experience.

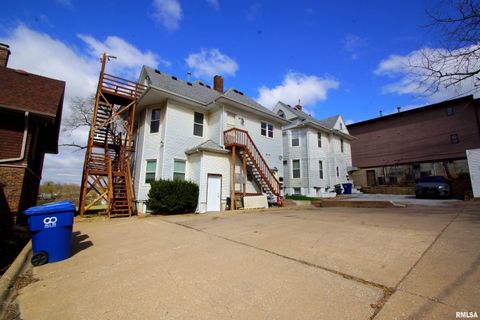
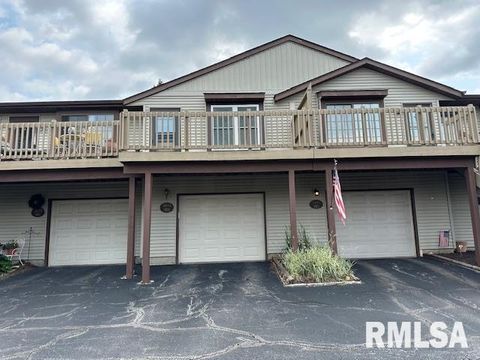
Pending
$265,000
3
bds
|
1
ba
|
1,710
sqft
|
built
1940
2544 East St, Davenport, IA 52803
$-272
Cash flow
-5.4%
Cash-on-Cash Return
5.0%
Cap rate
0.8%
Rent to Value Ratio

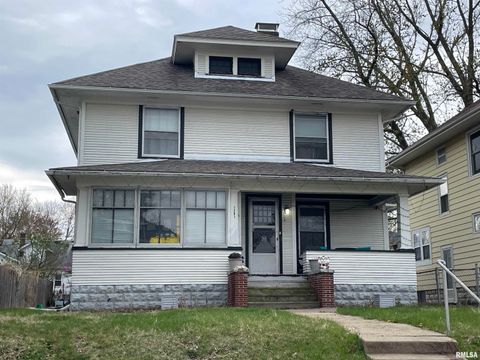
Active
$137,900
4
bds
|
2
ba
|
1,584
sqft
|
built
1910
1617 Scott St, Davenport, IA 52803
$-73
Cash flow
-2.8%
Cash-on-Cash Return
5.6%
Cap rate
0.8%
Rent to Value Ratio

Active
$550,000
4
bds
|
4
ba
|
3,166
sqft
|
built
2014
9932 123rd St, Davenport, IA 52804
$-1,132
Cash flow
-10.7%
Cash-on-Cash Return
3.8%
Cap rate
0.6%
Rent to Value Ratio

Active
$259,000
bds
|
0
ba
|
0
sqft
|
built
1879
511 W 6th St, Davenport, IA 52803
$-751
Cash flow
-15.1%
Cash-on-Cash Return
2.8%
Cap rate
0.5%
Rent to Value Ratio

Active
$83,500
4
bds
|
1
ba
|
1,578
sqft
|
built
1900
616 E 6th St, Davenport, IA 52803
$363
Cash flow
22.7%
Cash-on-Cash Return
11.5%
Cap rate
1.7%
Rent to Value Ratio

Pending
$149,900
2
bds
|
1
ba
|
1,248
sqft
|
built
1917
308 E Central Park Ave, Davenport, IA 52803
$-8
Cash flow
-0.3%
Cash-on-Cash Return
6.2%
Cap rate
0.9%
Rent to Value Ratio

Active
$152,500
3
bds
|
2
ba
|
2,026
sqft
|
built
1920
2329 Pershing Ave, Davenport, IA 52803
$-78
Cash flow
-2.7%
Cash-on-Cash Return
5.6%
Cap rate
0.9%
Rent to Value Ratio

Active under contract
$179,000
4
bds
|
2
ba
|
1,835
sqft
|
built
1900
1312 N Ripley St, Davenport, IA 52803
$-224
Cash flow
-6.5%
Cash-on-Cash Return
4.8%
Cap rate
0.7%
Rent to Value Ratio

Active
$827,500
bds
|
0
ba
|
0
sqft
|
built
1905
515 N Ripley St, Davenport, IA 52803
$-4,412
Cash flow
-27.8%
Cash-on-Cash Return
-0.1%
Cap rate
0.1%
Rent to Value Ratio
Active
$125,000
3
bds
|
2
ba
|
1,444
sqft
|
built
1879
2307 Farnam St, Davenport, IA 52803
$-68
Cash flow
-2.8%
Cash-on-Cash Return
5.6%
Cap rate
0.9%
Rent to Value Ratio

Active
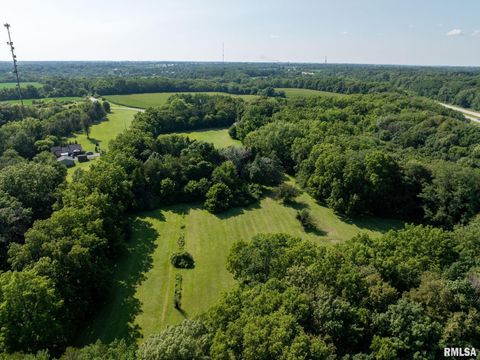
$499,900
3
bds
|
2
ba
|
1,910
sqft
|
built
2019
6113 Christie Ct, Davenport, IA 52807
$-1,124
Cash flow
-11.7%
Cash-on-Cash Return
3.6%
Cap rate
0.6%
Rent to Value Ratio

Active
$599,999
3
bds
|
3
ba
|
3,300
sqft
|
built
2016
11669 131st Street Ct, Davenport, IA 52804
$-1,291
Cash flow
-11.2%
Cash-on-Cash Return
3.7%
Cap rate
0.6%
Rent to Value Ratio
Active
$223,000
4
bds
|
0
ba
|
0
sqft
|
built
1890
430 E 7th St, Davenport, IA 52803
$-440
Cash flow
-10.3%
Cash-on-Cash Return
3.9%
Cap rate
0.6%
Rent to Value Ratio

Active
$330,000
3
bds
|
3
ba
|
2,008
sqft
|
built
1977
1415 W 59th St, Davenport, IA 52806
$-650
Cash flow
-10.3%
Cash-on-Cash Return
3.9%
Cap rate
0.6%
Rent to Value Ratio
Pending
$11,500
2
bds
|
1
ba
|
1,094
sqft
|
built
1900
1401 W 10th St, Davenport, IA 52804
$698
Cash flow
70.7%
Cash-on-Cash Return
72.8%
Cap rate
9.6%
Rent to Value Ratio
Active
$220,000
4
bds
|
0
ba
|
0
sqft
|
built
1900
705 Brady St, Davenport, IA 52803
$-423
Cash flow
-10.0%
Cash-on-Cash Return
4.0%
Cap rate
0.7%
Rent to Value Ratio
Active
$159,000
3
bds
|
2
ba
|
1,704
sqft
|
built
1910
1201 W 17th St, Davenport, IA 52804
$36
Cash flow
1.2%
Cash-on-Cash Return
6.5%
Cap rate
0.9%
Rent to Value Ratio

Pending
$314,900
4
bds
|
3
ba
|
2,009
sqft
|
built
2019
1708 Westport Dr, Davenport, IA 52804
$-509
Cash flow
-8.4%
Cash-on-Cash Return
4.3%
Cap rate
0.7%
Rent to Value Ratio

Active
$125,000
4
bds
|
1
ba
|
1,820
sqft
|
built
1900
1207 Tremont Ave, Davenport, IA 52803
$158
Cash flow
6.6%
Cash-on-Cash Return
7.8%
Cap rate
1.1%
Rent to Value Ratio

Active
$369,900
4
bds
|
3
ba
|
2,852
sqft
|
built
1997
3217 Arlington Cir, Davenport, IA 52803
$-650
Cash flow
-9.2%
Cash-on-Cash Return
4.2%
Cap rate
0.7%
Rent to Value Ratio

Active
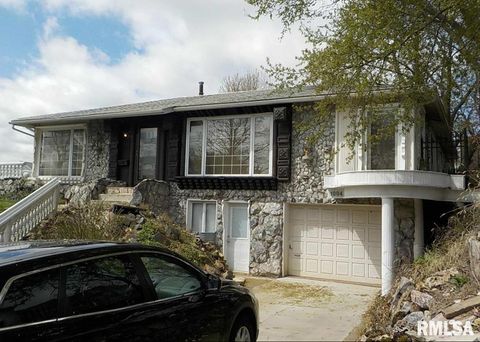
$299,900
3
bds
|
2
ba
|
2,110
sqft
|
built
1954
1 Kenwood Ave, Davenport, IA 52803
$-242
Cash flow
-4.2%
Cash-on-Cash Return
5.3%
Cap rate
0.8%
Rent to Value Ratio

Active
$120,000
2
bds
|
1
ba
|
934
sqft
|
built
1983
3807 Spring St, Davenport, IA 52807
$10
Cash flow
0.4%
Cash-on-Cash Return
6.4%
Cap rate
0.9%
Rent to Value Ratio

Active
$107,900
4
bds
|
1
ba
|
1,772
sqft
|
built
1900
1127 N Ripley St, Davenport, IA 52803
$170
Cash flow
8.2%
Cash-on-Cash Return
8.2%
Cap rate
1.1%
Rent to Value Ratio
Active
$112,500
5
bds
|
2
ba
|
1,752
sqft
|
built
1902
1607 W 8th St, Davenport, IA 52802
$32
Cash flow
1.5%
Cash-on-Cash Return
6.6%
Cap rate
1.0%
Rent to Value Ratio

Active
$89,900
3
bds
|
2
ba
|
1,548
sqft
|
built
1900
229 Washington St, Davenport, IA 52802
$287
Cash flow
16.7%
Cash-on-Cash Return
10.1%
Cap rate
1.4%
Rent to Value Ratio

Active
$189,000
3
bds
|
2
ba
|
1,490
sqft
|
built
1975
3110 N Pine St, Davenport, IA 52804
$-242
Cash flow
-6.7%
Cash-on-Cash Return
4.7%
Cap rate
0.7%
Rent to Value Ratio

Active
$215,000
2
bds
|
2
ba
|
2,400
sqft
|
built
1981
2531 E 51st St, Davenport, IA 52807
$-388
Cash flow
-9.4%
Cash-on-Cash Return
4.1%
Cap rate
0.7%
Rent to Value Ratio

Active
$285,000
4
bds
|
2
ba
|
1,414
sqft
|
built
2019
1719 Carson Dr, Davenport, IA 52804
$-563
Cash flow
-10.3%
Cash-on-Cash Return
3.9%
Cap rate
0.6%
Rent to Value Ratio

Pending
$195,000
3
bds
|
2
ba
|
2,553
sqft
|
built
1925
2216 N Sturdevant St, Davenport, IA 52804
$-498
Cash flow
-13.3%
Cash-on-Cash Return
3.2%
Cap rate
0.5%
Rent to Value Ratio
Active
$62,000
2
bds
|
0
ba
|
0
sqft
|
built
1910
1213 N Ripley St, Davenport, IA 52803
$594
Cash flow
11.2%
Cash-on-Cash Return
11.5%
Cap rate
1.6%
Rent to Value Ratio
Active
$225,000
10
bds
|
0
ba
|
0
sqft
|
built
1861
832 W 8th St, Davenport, IA 52802
$-457
Cash flow
-10.6%
Cash-on-Cash Return
3.8%
Cap rate
0.6%
Rent to Value Ratio
Active
$1,200,000
5
bds
|
3
ba
|
3,244
sqft
|
built
1910
5418 Chapel Hill Rd, Davenport, IA 52802
$-4,302
Cash flow
-18.7%
Cash-on-Cash Return
2.0%
Cap rate
0.3%
Rent to Value Ratio

Active
$75,000
3
bds
|
1
ba
|
1,492
sqft
|
built
1866
1916 E 13th St, Davenport, IA 52803
$335
Cash flow
23.3%
Cash-on-Cash Return
11.6%
Cap rate
1.6%
Rent to Value Ratio
Active
$449,000
3
bds
|
0
ba
|
0
sqft
|
built
1950
1004 College Ave, Davenport, IA 52803
$-1,770
Cash flow
-20.6%
Cash-on-Cash Return
1.5%
Cap rate
0.4%
Rent to Value Ratio

Pending
$239,900
3
bds
|
3
ba
|
1,474
sqft
|
built
1971
2510 W 44th St, Davenport, IA 52806
$-121
Cash flow
-2.6%
Cash-on-Cash Return
5.7%
Cap rate
0.8%
Rent to Value Ratio

Active
$220,500
3
bds
|
2
ba
|
1,573
sqft
|
built
1945
1608 Elmore Ave, Davenport, IA 52803
$-156
Cash flow
-3.7%
Cash-on-Cash Return
5.4%
Cap rate
0.8%
Rent to Value Ratio
Active
$170,000
4
bds
|
0
ba
|
0
sqft
|
built
1940
1819 W 3rd St, Davenport, IA 52802
$-61
Cash flow
-1.9%
Cash-on-Cash Return
5.8%
Cap rate
0.8%
Rent to Value Ratio

Active
$255,000
3
bds
|
2
ba
|
1,525
sqft
|
built
1967
237 Colony Dr, Davenport, IA 52806
$-336
Cash flow
-6.9%
Cash-on-Cash Return
4.7%
Cap rate
0.7%
Rent to Value Ratio
Active
$309,900
3
bds
|
3
ba
|
2,929
sqft
|
built
1976
2814 E 39th St, Davenport, IA 52807
$-300
Cash flow
-5.1%
Cash-on-Cash Return
5.1%
Cap rate
0.8%
Rent to Value Ratio
Active
$129,700
2
bds
|
2
ba
|
960
sqft
|
built
1983
4015 Lillie Ave, Davenport, IA 52806
$-128
Cash flow
-5.1%
Cash-on-Cash Return
5.1%
Cap rate
0.8%
Rent to Value Ratio