Davenport, IA Investment Properties for Sale
Browse homes for sale and investment properties in Davenport, IA. Refine your search by price, property type, or more.
Best cash flowing properties in Davenport, IA
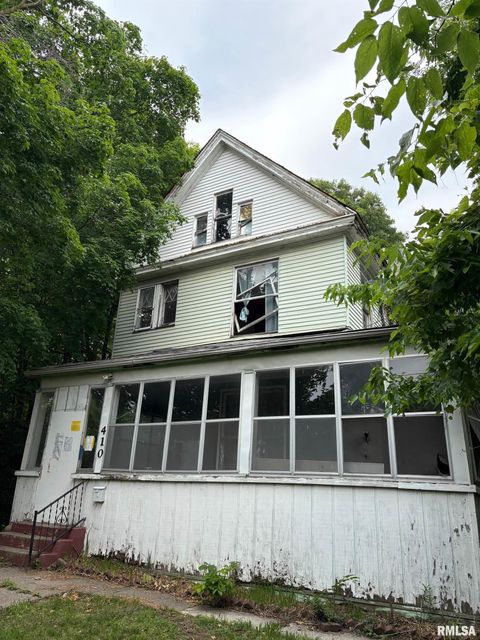
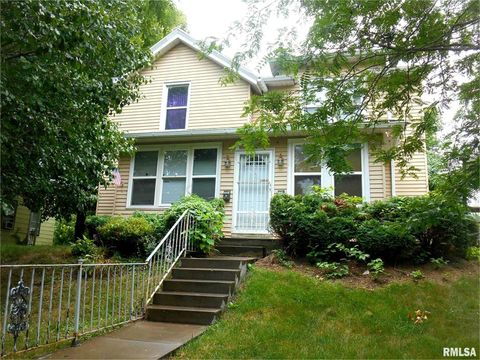
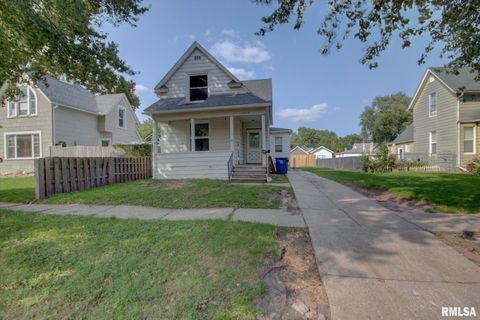
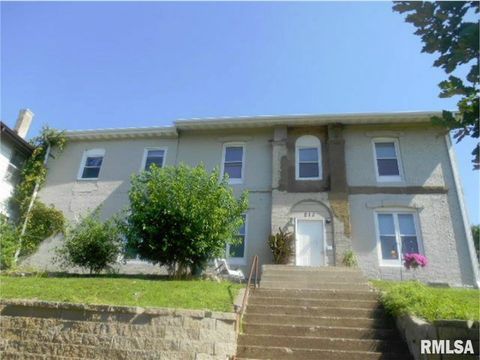
Active
$30,000
3
bds
|
2
ba
|
3,310
sqft
|
built
1910
410 W 8th St, Davenport, IA 52803
$960
Cash flow
37.3%
Cash-on-Cash Return
38.4%
Cap rate
5.3%
Rent to Value Ratio

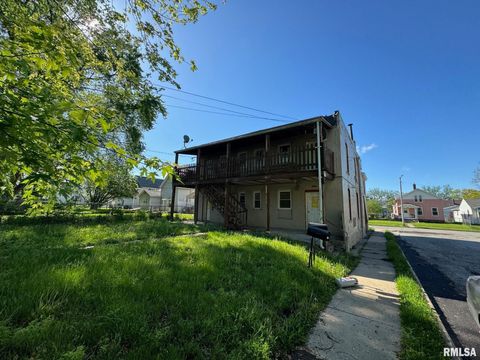
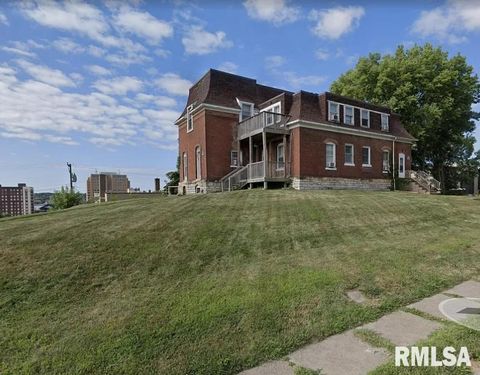
Pending
$60,000
4
bds
|
0
ba
|
0
sqft
|
built
1900
1454 W 3rd St, Davenport, IA 52802
$627
Cash flow
12.2%
Cash-on-Cash Return
12.5%
Cap rate
1.7%
Rent to Value Ratio
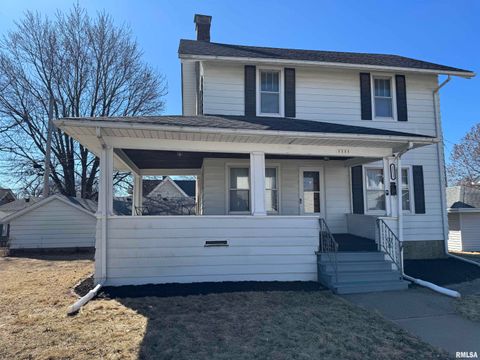
132 out of 162 properties for sale in Davenport, IA
Limited Results Shown
Create a free account, or log in to reveal all property listings and enjoy the complete experience.
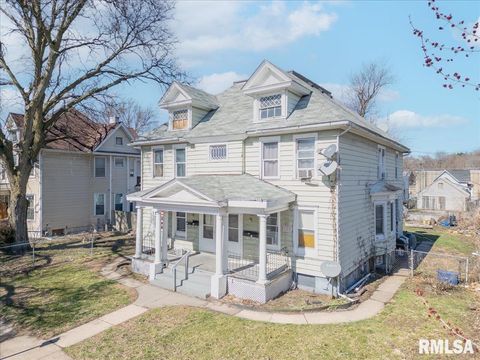
Active under contract
$219,900
4
bds
|
3
ba
|
1,769
sqft
|
built
1962
1820 W Hayes St, Davenport, IA 52804
$-192
Cash flow
-4.6%
Cash-on-Cash Return
4.6%
Cap rate
0.7%
Rent to Value Ratio
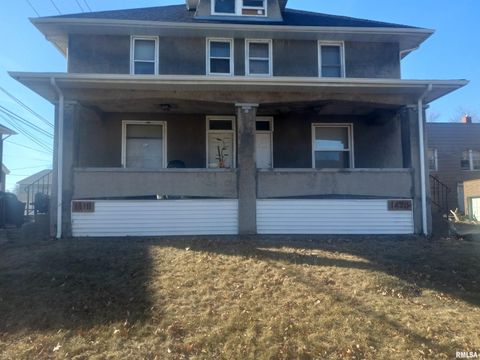
Active under contract
$167,500
4
bds
|
2
ba
|
2,138
sqft
|
built
1905
2141 W 4th St, Davenport, IA 52802
$24
Cash flow
0.7%
Cash-on-Cash Return
5.9%
Cap rate
0.8%
Rent to Value Ratio

Active
$194,500
2
bds
|
2
ba
|
1,390
sqft
|
built
1951
2610 N Division St, Davenport, IA 52804
$-164
Cash flow
-4.4%
Cash-on-Cash Return
4.7%
Cap rate
0.7%
Rent to Value Ratio
Pending
$155,000
4
bds
|
0
ba
|
0
sqft
|
built
1965
1617 W 43rd St, Davenport, IA 52806
$-223
Cash flow
-7.5%
Cash-on-Cash Return
4.0%
Cap rate
0.6%
Rent to Value Ratio

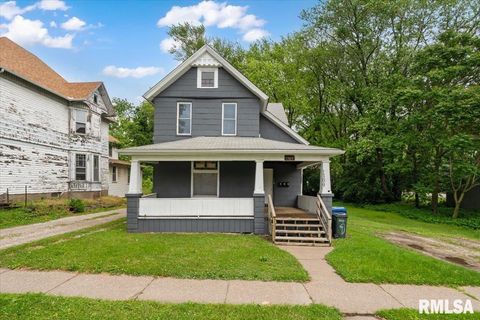
Active
$93,500
3
bds
|
1
ba
|
1,174
sqft
|
built
1900
1519 W 7th St, Davenport, IA 52802
$224
Cash flow
12.5%
Cash-on-Cash Return
8.5%
Cap rate
1.2%
Rent to Value Ratio
Active
$275,000
3
bds
|
2
ba
|
2,306
sqft
|
built
1969
3816 Woodland Ct, Davenport, IA 52807
$-103
Cash flow
-2.0%
Cash-on-Cash Return
5.2%
Cap rate
0.8%
Rent to Value Ratio
Active
$95,000
2
bds
|
1
ba
|
988
sqft
|
built
1900
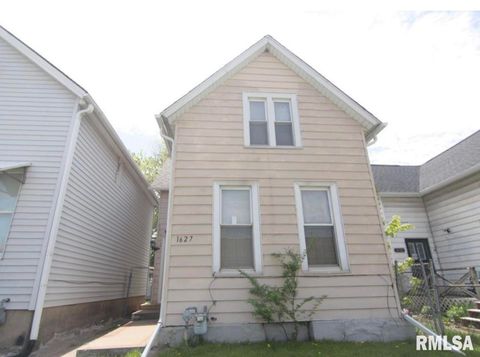
1627 W 4th St, Davenport, IA 52802
$169
Cash flow
9.3%
Cash-on-Cash Return
7.8%
Cap rate
1.1%
Rent to Value Ratio
Active
$249,999
3
bds
|
2
ba
|
2,240
sqft
|
built
1957
3430 W Locust St, Davenport, IA 52804
$-64
Cash flow
-1.3%
Cash-on-Cash Return
5.4%
Cap rate
0.8%
Rent to Value Ratio

Active
$245,000
2
bds
|
0
ba
|
0
sqft
|
built
1921
2107 N Marquette St, Davenport, IA 52804
$-374
Cash flow
-8.0%
Cash-on-Cash Return
3.8%
Cap rate
0.6%
Rent to Value Ratio

Active
$149,900
3
bds
|
1
ba
|
1,196
sqft
|
built
1920
1122 E Colorado St, Davenport, IA 52803
$54
Cash flow
1.9%
Cash-on-Cash Return
6.1%
Cap rate
0.9%
Rent to Value Ratio
Active
$30,000
3
bds
|
2
ba
|
3,310
sqft
|
built
1910
410 W 8th St, Davenport, IA 52803
$960
Cash flow
37.3%
Cash-on-Cash Return
38.4%
Cap rate
5.3%
Rent to Value Ratio
Active
$359,000
4
bds
|
3
ba
|
2,650
sqft
|
built
1992
4612 Marquette St, Davenport, IA 52806
$-412
Cash flow
-6.0%
Cash-on-Cash Return
4.3%
Cap rate
0.7%
Rent to Value Ratio
Active
$103,000
3
bds
|
0
ba
|
0
sqft
|
built
1880
415 E 7th St, Davenport, IA 52803
$74
Cash flow
3.7%
Cash-on-Cash Return
6.5%
Cap rate
1.0%
Rent to Value Ratio

Pending
$249,000
3
bds
|
3
ba
|
1,842
sqft
|
built
1965
3231 W 15th St, Davenport, IA 52804
$-313
Cash flow
-6.6%
Cash-on-Cash Return
4.2%
Cap rate
0.6%
Rent to Value Ratio

Active
$99,900
4
bds
|
2
ba
|
1,790
sqft
|
built
1907
1032 Kirkwood Blvd, Davenport, IA 52803
$177
Cash flow
9.2%
Cash-on-Cash Return
7.8%
Cap rate
1.2%
Rent to Value Ratio

Active
$162,000
3
bds
|
0
ba
|
0
sqft
|
built
1910
1321 N Main St, Davenport, IA 52803
$-46
Cash flow
-1.5%
Cash-on-Cash Return
5.3%
Cap rate
0.9%
Rent to Value Ratio
Pending
$60,000
4
bds
|
0
ba
|
0
sqft
|
built
1900
1454 W 3rd St, Davenport, IA 52802
$627
Cash flow
12.2%
Cash-on-Cash Return
12.5%
Cap rate
1.7%
Rent to Value Ratio

Active
$313,900
3
bds
|
3
ba
|
2,305
sqft
|
built
1984
1425 W 48th St, Davenport, IA 52806
$-448
Cash flow
-7.4%
Cash-on-Cash Return
4.0%
Cap rate
0.6%
Rent to Value Ratio
Active
$75,000
bds
|
0
ba
|
0
sqft
|
built
1900
2024 W 6th St, Davenport, IA 52802
$258
Cash flow
17.9%
Cash-on-Cash Return
9.8%
Cap rate
1.7%
Rent to Value Ratio

Active
$168,000
4
bds
|
0
ba
|
0
sqft
|
built
1910
421 E 7th St, Davenport, IA 52803
$-78
Cash flow
-2.4%
Cash-on-Cash Return
5.1%
Cap rate
0.8%
Rent to Value Ratio

Active
$175,000
2
bds
|
2
ba
|
960
sqft
|
built
1981
3115 W 63rd St, Davenport, IA 52806
$-87
Cash flow
-2.6%
Cash-on-Cash Return
5.1%
Cap rate
0.8%
Rent to Value Ratio

Pending
$470,000
4
bds
|
3
ba
|
3,204
sqft
|
built
1978
4122 W Rusholme St, Davenport, IA 52804
$-305
Cash flow
-3.4%
Cash-on-Cash Return
4.9%
Cap rate
0.8%
Rent to Value Ratio

Active
$180,500
2
bds
|
2
ba
|
1,102
sqft
|
built
1924
2320 E High St, Davenport, IA 52803
$-314
Cash flow
-9.1%
Cash-on-Cash Return
3.6%
Cap rate
0.6%
Rent to Value Ratio

Pending
$134,900
3
bds
|
1
ba
|
864
sqft
|
built
1956
2228 N Fairmount St, Davenport, IA 52804
$97
Cash flow
3.8%
Cash-on-Cash Return
6.5%
Cap rate
1.0%
Rent to Value Ratio

Active
$324,000
3
bds
|
3
ba
|
2,566
sqft
|
built
1920
2707 Grand Ave, Davenport, IA 52803
$-450
Cash flow
-7.2%
Cash-on-Cash Return
4.0%
Cap rate
0.6%
Rent to Value Ratio

Closed
$372,900
3
bds
|
3
ba
|
2,203
sqft
|
built
2017
1609 Parkview Ln, Davenport, IA 52807
$-311
Cash flow
-4.4%
Cash-on-Cash Return
4.7%
Cap rate
0.7%
Rent to Value Ratio
Active
$149,900
3
bds
|
1
ba
|
1,144
sqft
|
built
1920
1111 E Colorado St, Davenport, IA 52803
$223
Cash flow
7.8%
Cash-on-Cash Return
7.5%
Cap rate
1.1%
Rent to Value Ratio
Active
$160,000
4
bds
|
0
ba
|
0
sqft
|
built
1900
1335 W 13th St, Davenport, IA 52804
$-23
Cash flow
-0.8%
Cash-on-Cash Return
5.5%
Cap rate
0.8%
Rent to Value Ratio
Active
$130,000
3
bds
|
2
ba
|
1,324
sqft
|
built
1894
2312 W 1st St, Davenport, IA 52802
$230
Cash flow
9.2%
Cash-on-Cash Return
7.8%
Cap rate
1.1%
Rent to Value Ratio
Active
$165,000
4
bds
|
0
ba
|
0
sqft
|
built
1900
1636 W 3rd St, Davenport, IA 52802
$80
Cash flow
2.5%
Cash-on-Cash Return
6.3%
Cap rate
0.9%
Rent to Value Ratio

Active
$179,900
4
bds
|
2
ba
|
1,614
sqft
|
built
1971
325 W 64th St, Davenport, IA 52806
$67
Cash flow
1.9%
Cash-on-Cash Return
6.1%
Cap rate
0.9%
Rent to Value Ratio
Active
$137,900
6
bds
|
0
ba
|
0
sqft
|
built
1910
1418 Iowa St, Davenport, IA 52803
$-156
Cash flow
-5.9%
Cash-on-Cash Return
4.3%
Cap rate
0.7%
Rent to Value Ratio

Active
$85,000
5
bds
|
2
ba
|
2,116
sqft
|
built
1900
711 W 9th St, Davenport, IA 52804
$247
Cash flow
15.2%
Cash-on-Cash Return
9.2%
Cap rate
1.4%
Rent to Value Ratio

Active
$89,900
4
bds
|
2
ba
|
1,681
sqft
|
built
1900
728 W 14th St, Davenport, IA 52804
$223
Cash flow
12.9%
Cash-on-Cash Return
8.6%
Cap rate
1.2%
Rent to Value Ratio

Active
$229,900
5
bds
|
2
ba
|
1,981
sqft
|
built
1920
2302 Western Ave, Davenport, IA 52803
$-240
Cash flow
-5.4%
Cash-on-Cash Return
4.4%
Cap rate
0.7%
Rent to Value Ratio

Active
$389,000
4
bds
|
3
ba
|
2,829
sqft
|
built
2019
3112 W 34th St, Davenport, IA 52806
$-388
Cash flow
-5.2%
Cash-on-Cash Return
4.5%
Cap rate
0.7%
Rent to Value Ratio
Pending
$110,000
4
bds
|
0
ba
|
0
sqft
|
built
1910
1309 N Perry St, Davenport, IA 52803
$105
Cash flow
5.0%
Cash-on-Cash Return
6.8%
Cap rate
1.0%
Rent to Value Ratio

Active under contract
$265,000
3
bds
|
2
ba
|
2,140
sqft
|
built
1985
5117 Woodland Ave, Davenport, IA 52807
$-244
Cash flow
-4.8%
Cash-on-Cash Return
4.6%
Cap rate
0.8%
Rent to Value Ratio
Active
$450,000
bds
|
0
ba
|
0
sqft
|
built
1900
212 E 6th St, Davenport, IA 52803
$-1,722
Cash flow
-20.0%
Cash-on-Cash Return
1.1%
Cap rate
0.4%
Rent to Value Ratio
Active
$490,000
4
bds
|
0
ba
|
0
sqft
|
built
1920
620 N Perry St, Davenport, IA 52803
$-1,553
Cash flow
-16.5%
Cash-on-Cash Return
1.9%
Cap rate
0.4%
Rent to Value Ratio