Dedham, MA Investment Properties for Sale
Browse homes for sale and investment properties in Dedham, MA. Refine your search by price, property type, or more.
Best cash flowing properties in Dedham, MA

Active
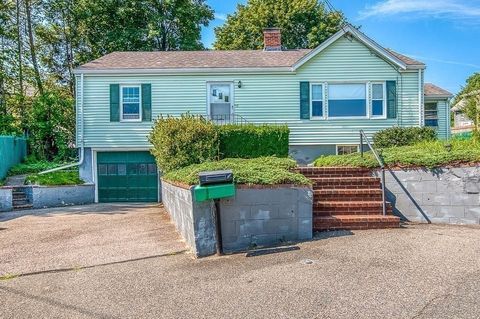
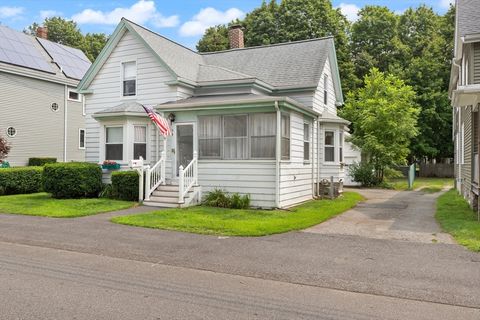
$525,000
3
bds
|
1
ba
|
1,352
sqft
|
built
1890
108 High St, Dedham, MA 02026
$-598
Cash flow
-5.9%
Cash-on-Cash Return
4.3%
Cap rate
0.7%
Rent to Value Ratio
Active
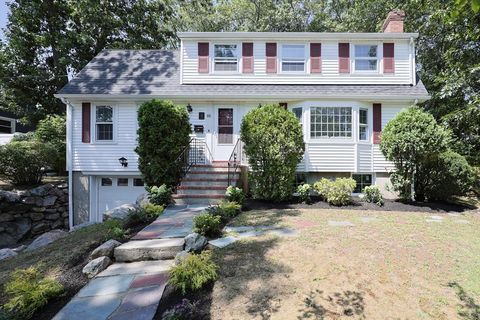
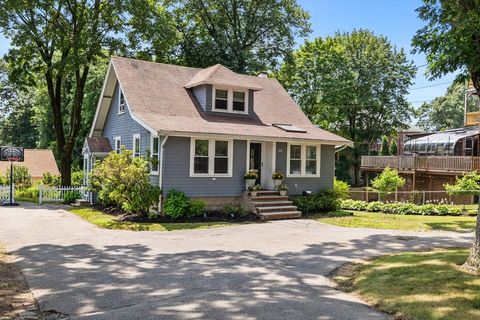
$599,000
3
bds
|
2
ba
|
1,280
sqft
|
built
1953
12 Juniper Ter, Dedham, MA 02026
$-921
Cash flow
-8.0%
Cash-on-Cash Return
3.8%
Cap rate
0.6%
Rent to Value Ratio
17 out of 27 properties for sale in Dedham, MA
Limited Results Shown
Create a free account, or log in to reveal all property listings and enjoy the complete experience.
Active
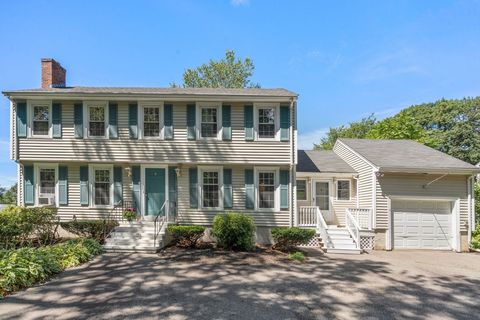
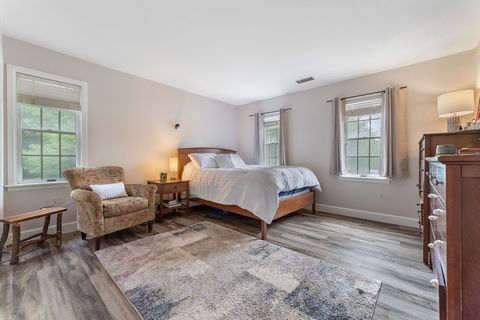
$849,000
4
bds
|
2
ba
|
2,344
sqft
|
built
1958
88 Fox Meadow Ln, Dedham, MA 02026
$-2,371
Cash flow
-14.6%
Cash-on-Cash Return
2.3%
Cap rate
0.4%
Rent to Value Ratio
Active
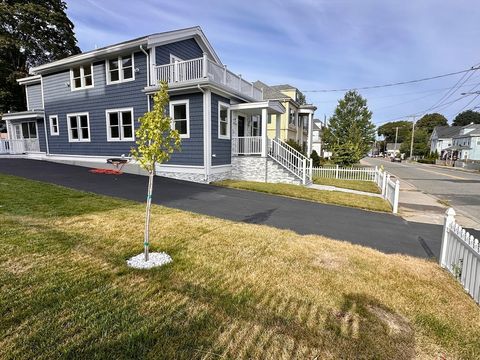
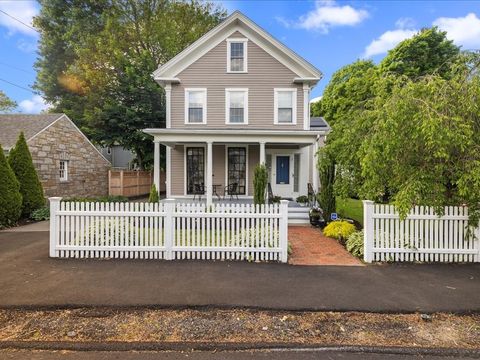
$879,000
5
bds
|
2
ba
|
2,052
sqft
|
built
1985
5 Hope Ln, Dedham, MA 02026
$-1,637
Cash flow
-9.7%
Cash-on-Cash Return
3.4%
Cap rate
0.6%
Rent to Value Ratio
Active
$1,749,900
4
bds
|
4
ba
|
3,200
sqft
|
built
1880
442 High St, Dedham, MA 02026
$-6,591
Cash flow
-19.7%
Cash-on-Cash Return
1.2%
Cap rate
0.2%
Rent to Value Ratio

Active
$899,000
4
bds
|
2
ba
|
1,976
sqft
|
built
1926
86 Massachusetts Ave, Dedham, MA 02026
$-1,942
Cash flow
-11.3%
Cash-on-Cash Return
3.1%
Cap rate
0.5%
Rent to Value Ratio
Active
$620,000
3
bds
|
1
ba
|
1,271
sqft
|
built
1910
94 Madison St, Dedham, MA 02026
$-1,063
Cash flow
-8.9%
Cash-on-Cash Return
3.6%
Cap rate
0.6%
Rent to Value Ratio
Active
$679,000
3
bds
|
2
ba
|
1,244
sqft
|
built
1905
108 Needham St, Dedham, MA 02026
$-1,087
Cash flow
-8.4%
Cash-on-Cash Return
3.8%
Cap rate
0.6%
Rent to Value Ratio

Active
$379,000
1
bds
|
1
ba
|
737
sqft
|
built
1987
7 S Stone Mill Dr, Dedham, MA 02026
$-1,069
Cash flow
-14.7%
Cash-on-Cash Return
2.3%
Cap rate
0.7%
Rent to Value Ratio
Active
$479,900
2
bds
|
2
ba
|
1,371
sqft
|
built
1988
36 N Stone Mill Dr, Dedham, MA 02026
$-1,711
Cash flow
-18.6%
Cash-on-Cash Return
1.4%
Cap rate
0.7%
Rent to Value Ratio
Active
$1,199,000
3
bds
|
3
ba
|
2,986
sqft
|
built
1740
55 Dwight St, Dedham, MA 02026
$-5,315
Cash flow
-23.1%
Cash-on-Cash Return
0.4%
Cap rate
0.2%
Rent to Value Ratio
Active
$669,000
3
bds
|
1
ba
|
1,458
sqft
|
built
1930
414 Cedar St, Dedham, MA 02026
$-1,096
Cash flow
-8.5%
Cash-on-Cash Return
3.7%
Cap rate
0.6%
Rent to Value Ratio
Active
$4,100,000
9
bds
|
7
ba
|
10,987
sqft
|
built
1907
570 Bridge St, Dedham, MA 02026
$-18,599
Cash flow
-23.7%
Cash-on-Cash Return
0.2%
Cap rate
0.2%
Rent to Value Ratio
Active
$1,500,000
4
bds
|
2
ba
|
2,000
sqft
|
built
2026
31 Moreland Ave, Dedham, MA 02026
$-5,504
Cash flow
-19.1%
Cash-on-Cash Return
1.3%
Cap rate
0.2%
Rent to Value Ratio

Active
$950,000
4
bds
|
2
ba
|
1,718
sqft
|
built
1954
35 Fairfield St, Dedham, MA 02026
$-2,101
Cash flow
-11.5%
Cash-on-Cash Return
3.0%
Cap rate
0.5%
Rent to Value Ratio
Active
$2,595,000
5
bds
|
7
ba
|
9,896
sqft
|
built
1984
85 Schoolmaster Ln, Dedham, MA 02026
$-9,147
Cash flow
-18.4%
Cash-on-Cash Return
1.4%
Cap rate
0.3%
Rent to Value Ratio

Active
$1,099,000
4
bds
|
3
ba
|
1,709
sqft
|
built
1960
342 Needham St, Dedham, MA 02026
$-2,651
Cash flow
-12.6%
Cash-on-Cash Return
2.8%
Cap rate
0.4%
Rent to Value Ratio