Plymouth, MA Investment Properties for Sale
Browse homes for sale and investment properties in Plymouth, MA. Refine your search by price, property type, or more.
Best cash flowing properties in Plymouth, MA
Active
$439,900
3
bds
|
2
ba
|
575
sqft
|
built
1915
3 Avenue A, Plymouth, MA 02360
$-633
Cash flow
-7.5%
Cash-on-Cash Return
4.0%
Cap rate
0.6%
Rent to Value Ratio

Active
$315,000
2
bds
|
2
ba
|
898
sqft
|
built
1986
2 Marc Dr, Plymouth, MA 02360
$-686
Cash flow
-11.4%
Cash-on-Cash Return
3.1%
Cap rate
0.7%
Rent to Value Ratio
34 out of 165 properties for sale in Plymouth, MA
Limited Results Shown
Create a free account, or log in to reveal all property listings and enjoy the complete experience.
Active
$699,000
4
bds
|
2
ba
|
2,956
sqft
|
built
1978
5 Hood Dr, Plymouth, MA 02360
$-1,273
Cash flow
-9.5%
Cash-on-Cash Return
3.5%
Cap rate
0.6%
Rent to Value Ratio
Active
$899,000
4
bds
|
3
ba
|
3,540
sqft
|
built
2008
18 Highview Rd, Plymouth, MA 02360
$-1,983
Cash flow
-11.5%
Cash-on-Cash Return
3.0%
Cap rate
0.5%
Rent to Value Ratio
Active
$549,900
1
bds
|
1
ba
|
720
sqft
|
built
1930
41 Bay Shore Dr, Plymouth, MA 02360
$-1,263
Cash flow
-12.0%
Cash-on-Cash Return
2.9%
Cap rate
0.5%
Rent to Value Ratio
Active
$1,595,000
3
bds
|
3
ba
|
3,062
sqft
|
built
2007
116 Ryecroft, Plymouth, MA 02360
$-4,803
Cash flow
-15.7%
Cash-on-Cash Return
2.1%
Cap rate
0.4%
Rent to Value Ratio
Active
$769,000
3
bds
|
3
ba
|
2,284
sqft
|
built
1992
15 Nonantum Rd, Plymouth, MA 02360
$-1,436
Cash flow
-9.7%
Cash-on-Cash Return
3.4%
Cap rate
0.5%
Rent to Value Ratio
Active
$829,900
3
bds
|
3
ba
|
2,324
sqft
|
built
2002
107 Shore Dr, Plymouth, MA 02360
$-1,940
Cash flow
-12.2%
Cash-on-Cash Return
2.9%
Cap rate
0.5%
Rent to Value Ratio
Active
$729,000
4
bds
|
2
ba
|
2,714
sqft
|
built
1972
26 Spencer Dr, Plymouth, MA 02360
$-1,536
Cash flow
-11.0%
Cash-on-Cash Return
3.2%
Cap rate
0.5%
Rent to Value Ratio
Active
$1,099,999
5
bds
|
4
ba
|
3,400
sqft
|
built
2024
10 Crescent St, Plymouth, MA 02360
$-765
Cash flow
-3.6%
Cash-on-Cash Return
4.8%
Cap rate
0.7%
Rent to Value Ratio
Active
$955,000
3
bds
|
2
ba
|
1,554
sqft
|
built
1954
52 Taylor Ave, Plymouth, MA 02360
$-2,790
Cash flow
-15.2%
Cash-on-Cash Return
2.2%
Cap rate
0.4%
Rent to Value Ratio
Active
$1,000,000
4
bds
|
2
ba
|
2,050
sqft
|
built
1958
18 Beach St, Plymouth, MA 02360
$-3,372
Cash flow
-17.6%
Cash-on-Cash Return
1.6%
Cap rate
0.3%
Rent to Value Ratio
Active
$930,000
4
bds
|
4
ba
|
2,564
sqft
|
built
1987
67 Raymond Rd, Plymouth, MA 02360
$-2,312
Cash flow
-13.0%
Cash-on-Cash Return
2.7%
Cap rate
0.4%
Rent to Value Ratio
Active
$799,900
2
bds
|
2
ba
|
1,858
sqft
|
built
2014
11 Cobblestone, Plymouth, MA 02360
$-2,375
Cash flow
-15.5%
Cash-on-Cash Return
2.1%
Cap rate
0.5%
Rent to Value Ratio
Active
$985,000
4
bds
|
3
ba
|
3,069
sqft
|
built
1987
29 Wyndemere Ct, Plymouth, MA 02360
$-2,658
Cash flow
-14.1%
Cash-on-Cash Return
2.4%
Cap rate
0.4%
Rent to Value Ratio
Active
$1,250,000
4
bds
|
3
ba
|
2,425
sqft
|
built
1945
106 Rocky Hill Rd, Plymouth, MA 02360
$-4,511
Cash flow
-18.8%
Cash-on-Cash Return
1.3%
Cap rate
0.2%
Rent to Value Ratio
Active
$879,000
4
bds
|
3
ba
|
3,000
sqft
|
built
1935
10 Brewster Ave, Plymouth, MA 02360
$-1,656
Cash flow
-9.8%
Cash-on-Cash Return
3.4%
Cap rate
0.5%
Rent to Value Ratio

Active
$1,150,000
9
bds
|
3
ba
|
2,856
sqft
|
built
1870
45 Cherry St, Plymouth, MA 02360
$-4,258
Cash flow
-19.3%
Cash-on-Cash Return
1.2%
Cap rate
0.2%
Rent to Value Ratio
Active
$1,259,000
2
bds
|
3
ba
|
4,138
sqft
|
built
2019
21 Snapping Bow, Plymouth, MA 02360
$-3,945
Cash flow
-16.3%
Cash-on-Cash Return
1.9%
Cap rate
0.4%
Rent to Value Ratio

Active
$490,000
1
bds
|
2
ba
|
1,160
sqft
|
built
1740
146 Herring Pond Rd, Plymouth, MA 02360
$-763
Cash flow
-8.1%
Cash-on-Cash Return
3.8%
Cap rate
0.6%
Rent to Value Ratio
Active
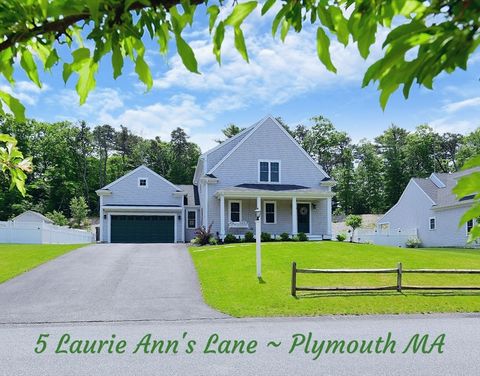
$835,000
3
bds
|
3
ba
|
2,242
sqft
|
built
2022
5 Laurie Anns Ln, Plymouth, MA 02360
$-1,423
Cash flow
-8.9%
Cash-on-Cash Return
3.6%
Cap rate
0.6%
Rent to Value Ratio
Active
$899,900
4
bds
|
3
ba
|
2,766
sqft
|
built
2024
29 Bumpus Rd, Plymouth, MA 02360
$-3,096
Cash flow
-17.9%
Cash-on-Cash Return
1.6%
Cap rate
0.3%
Rent to Value Ratio
Active
$1,350,000
3
bds
|
5
ba
|
3,306
sqft
|
built
2004
11 Great Kame, Plymouth, MA 02360
$-3,980
Cash flow
-15.4%
Cash-on-Cash Return
2.1%
Cap rate
0.4%
Rent to Value Ratio
Active
$699,000
3
bds
|
2
ba
|
1,320
sqft
|
built
1960
28 Manomet Beach Blvd, Plymouth, MA 02360
$-1,621
Cash flow
-12.1%
Cash-on-Cash Return
2.9%
Cap rate
0.5%
Rent to Value Ratio

Active
$799,900
3
bds
|
2
ba
|
1,683
sqft
|
built
1964
48 Menotomy Rd, Plymouth, MA 02360
$-1,834
Cash flow
-12.0%
Cash-on-Cash Return
2.9%
Cap rate
0.4%
Rent to Value Ratio
Active
$899,999
4
bds
|
4
ba
|
3,825
sqft
|
built
2003
48 Freeman Dr, Plymouth, MA 02360
$-1,676
Cash flow
-9.7%
Cash-on-Cash Return
3.4%
Cap rate
0.6%
Rent to Value Ratio
Active
$1,200,000
2
bds
|
1
ba
|
944
sqft
|
built
1957
1029 Old Sandwich Rd, Plymouth, MA 02360
$-4,527
Cash flow
-19.7%
Cash-on-Cash Return
1.2%
Cap rate
0.3%
Rent to Value Ratio

Active
$599,900
4
bds
|
2
ba
|
1,998
sqft
|
built
1795
881 State Rd, Plymouth, MA 02360
$-968
Cash flow
-8.4%
Cash-on-Cash Return
3.7%
Cap rate
0.6%
Rent to Value Ratio
Active
$4,250,000
5
bds
|
7
ba
|
4,637
sqft
|
built
1996
296 Center Hill Rd, Plymouth, MA 02360
$-15,229
Cash flow
-18.7%
Cash-on-Cash Return
1.4%
Cap rate
0.2%
Rent to Value Ratio

Active
$875,000
4
bds
|
1
ba
|
1,152
sqft
|
built
1950
18 Scarlet Dr, Plymouth, MA 02360
$-1,940
Cash flow
-11.6%
Cash-on-Cash Return
3.0%
Cap rate
0.5%
Rent to Value Ratio

Active
$595,000
2
bds
|
2
ba
|
1,643
sqft
|
built
2000
4 Highland Ter, Plymouth, MA 02360
$-1,813
Cash flow
-15.9%
Cash-on-Cash Return
2.0%
Cap rate
0.6%
Rent to Value Ratio
Active
$1,150,000
5
bds
|
4
ba
|
3,971
sqft
|
built
2000
53 White Cliff Dr, Plymouth, MA 02360
$-3,319
Cash flow
-15.1%
Cash-on-Cash Return
2.2%
Cap rate
0.5%
Rent to Value Ratio
Active
$640,000
2
bds
|
3
ba
|
1,664
sqft
|
built
2022
9 Sunflower Way, Plymouth, MA 02360
$-1,507
Cash flow
-12.3%
Cash-on-Cash Return
2.9%
Cap rate
0.5%
Rent to Value Ratio

Active
$2,500,000
3
bds
|
3
ba
|
2,106
sqft
|
built
1930
70 Hedge Rd, Plymouth, MA 02360
$-9,629
Cash flow
-20.1%
Cash-on-Cash Return
1.1%
Cap rate
0.2%
Rent to Value Ratio