Plymouth, MA Investment Properties for Sale
Browse homes for sale and investment properties in Plymouth, MA. Refine your search by price, property type, or more.
Best cash flowing properties in Plymouth, MA
Active
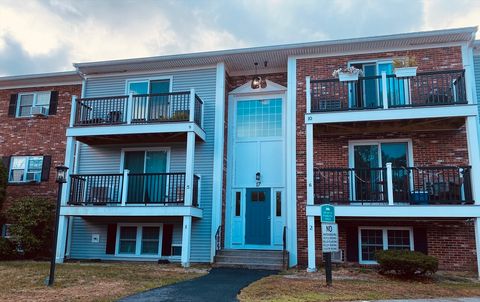
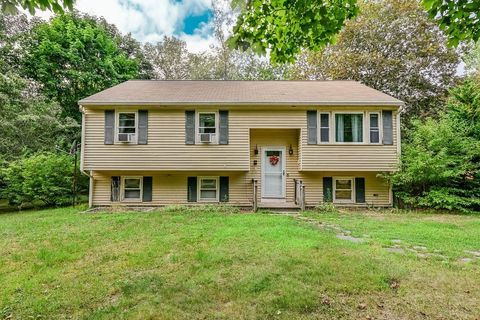
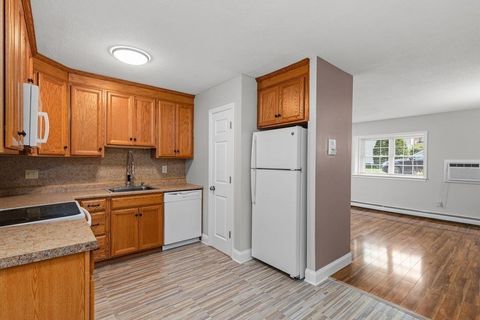
$220,000
1
bds
|
1
ba
|
785
sqft
|
built
1970
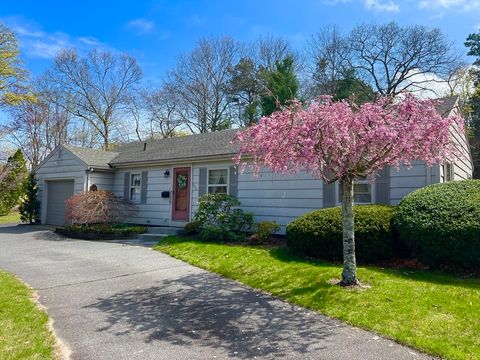
17 Chapel Hill Dr, Plymouth, MA 02360
$-379
Cash flow
-9.0%
Cash-on-Cash Return
3.6%
Cap rate
0.9%
Rent to Value Ratio
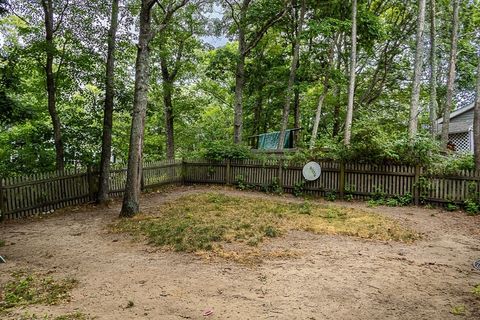
Active
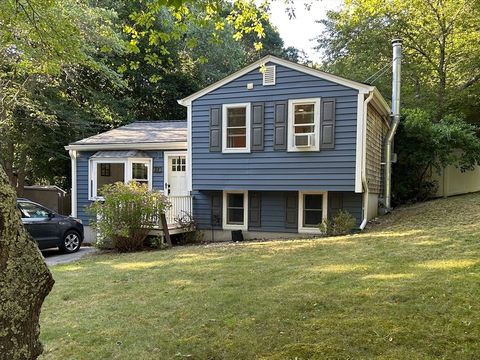
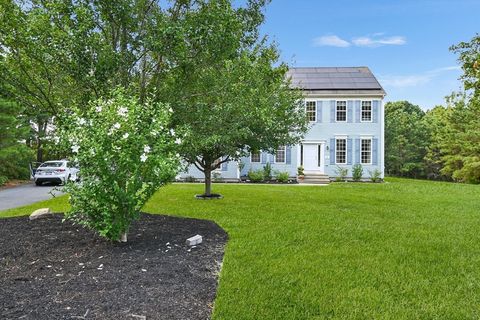
$449,000
2
bds
|
2
ba
|
910
sqft
|
built
1990
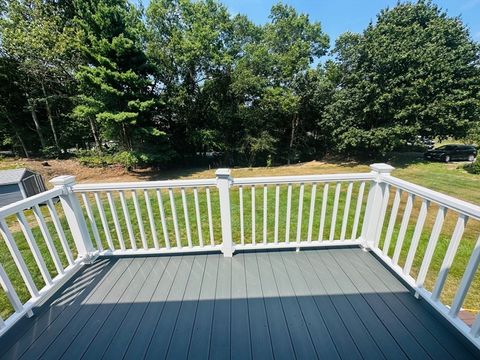
22 Cranberry Rd, Plymouth, MA 02360
$-582
Cash flow
-6.8%
Cash-on-Cash Return
4.1%
Cap rate
0.6%
Rent to Value Ratio
76 out of 147 properties for sale in Plymouth, MA
Limited Results Shown
Create a free account, or log in to reveal all property listings and enjoy the complete experience.
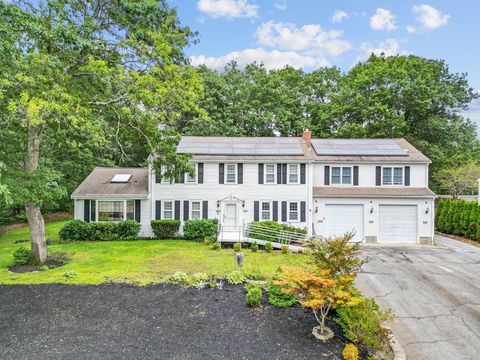
Active
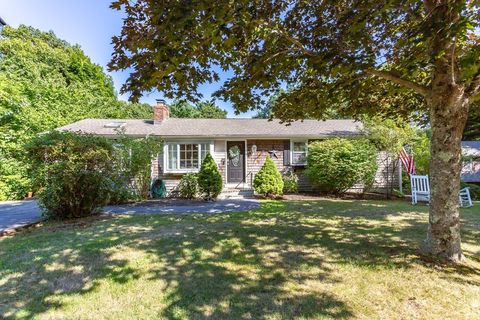
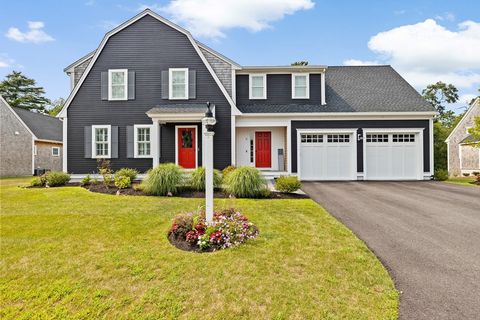
$699,000
4
bds
|
2
ba
|
2,956
sqft
|
built
1978
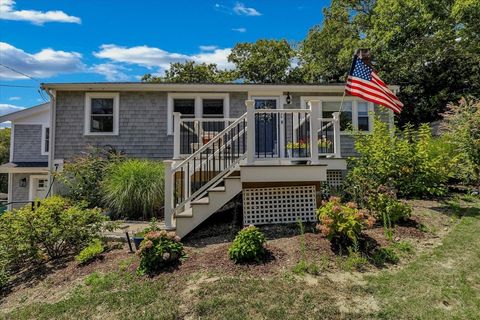
5 Hood Dr, Plymouth, MA 02360
$-1,273
Cash flow
-9.5%
Cash-on-Cash Return
3.5%
Cap rate
0.6%
Rent to Value Ratio
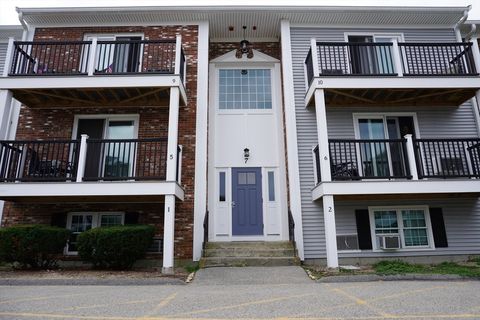
Active
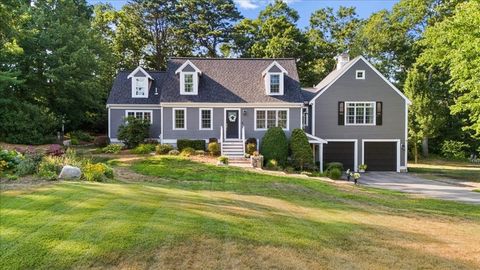
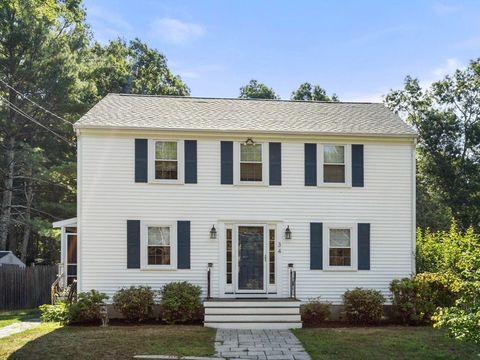
$298,000
2
bds
|
1
ba
|
895
sqft
|
built
1970
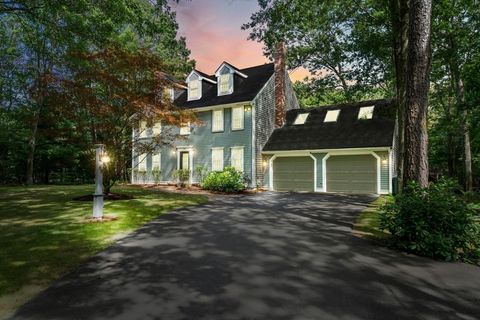
7 Chapel Hill Dr, Plymouth, MA 02360
$-690
Cash flow
-12.1%
Cash-on-Cash Return
2.9%
Cap rate
0.8%
Rent to Value Ratio
Active
$619,900
3
bds
|
1
ba
|
1,554
sqft
|
built
1952
253 Sandwich St, Plymouth, MA 02360
$-1,247
Cash flow
-10.5%
Cash-on-Cash Return
3.3%
Cap rate
0.5%
Rent to Value Ratio
Active
$635,000
3
bds
|
3
ba
|
1,450
sqft
|
built
1978
51 Nicks Rock Rd, Plymouth, MA 02360
$-1,324
Cash flow
-10.9%
Cash-on-Cash Return
3.2%
Cap rate
0.5%
Rent to Value Ratio
Active
$900,000
3
bds
|
3
ba
|
2,670
sqft
|
built
1956
30 Manomet Ave, Plymouth, MA 02360
$-2,469
Cash flow
-14.3%
Cash-on-Cash Return
2.4%
Cap rate
0.4%
Rent to Value Ratio
Active
$925,000
4
bds
|
3
ba
|
2,522
sqft
|
built
1987
89 Jordan Rd, Plymouth, MA 02360
$-2,053
Cash flow
-11.6%
Cash-on-Cash Return
3.0%
Cap rate
0.5%
Rent to Value Ratio
Active
$694,900
2
bds
|
2
ba
|
1,255
sqft
|
built
1906
76 Court St, Plymouth, MA 02360
$-2,233
Cash flow
-16.8%
Cash-on-Cash Return
1.8%
Cap rate
0.5%
Rent to Value Ratio
Active
$675,000
3
bds
|
3
ba
|
2,292
sqft
|
built
2018
3 Winter Holw, Plymouth, MA 02360
$-1,341
Cash flow
-10.4%
Cash-on-Cash Return
3.3%
Cap rate
0.5%
Rent to Value Ratio
Active
$995,000
2
bds
|
2
ba
|
1,855
sqft
|
built
1988
15 Caswell Ln, Plymouth, MA 02360
$-3,787
Cash flow
-19.9%
Cash-on-Cash Return
1.1%
Cap rate
0.4%
Rent to Value Ratio
Active
$675,000
2
bds
|
3
ba
|
1,912
sqft
|
built
2018
3 Heartwood, Plymouth, MA 02360
$-1,392
Cash flow
-10.8%
Cash-on-Cash Return
3.2%
Cap rate
0.6%
Rent to Value Ratio
Active
$659,900
3
bds
|
2
ba
|
1,485
sqft
|
built
1976
135 Shore Dr, Plymouth, MA 02360
$-1,369
Cash flow
-10.8%
Cash-on-Cash Return
3.2%
Cap rate
0.5%
Rent to Value Ratio
Active
$729,000
4
bds
|
3
ba
|
2,390
sqft
|
built
1976
44 Musket Rd, Plymouth, MA 02360
$-1,702
Cash flow
-12.2%
Cash-on-Cash Return
2.9%
Cap rate
0.5%
Rent to Value Ratio
Active
$524,900
3
bds
|
2
ba
|
1,400
sqft
|
built
1978
2462 State Rd, Plymouth, MA 02360
$-720
Cash flow
-7.2%
Cash-on-Cash Return
4.0%
Cap rate
0.6%
Rent to Value Ratio
Active
$699,900
2
bds
|
2
ba
|
1,920
sqft
|
built
2014
6 Marion St, Plymouth, MA 02360
$-1,565
Cash flow
-11.7%
Cash-on-Cash Return
3.0%
Cap rate
0.5%
Rent to Value Ratio
Active
$499,000
3
bds
|
1
ba
|
1,362
sqft
|
built
2000
109 Buzzards Bay Dr, Plymouth, MA 02360
$-690
Cash flow
-7.2%
Cash-on-Cash Return
4.0%
Cap rate
0.6%
Rent to Value Ratio
Active
$899,000
4
bds
|
3
ba
|
3,540
sqft
|
built
2008
18 Highview Rd, Plymouth, MA 02360
$-1,983
Cash flow
-11.5%
Cash-on-Cash Return
3.0%
Cap rate
0.5%
Rent to Value Ratio
Active
$925,000
3
bds
|
3
ba
|
3,500
sqft
|
built
1990
54 Bowsprit Ln, Plymouth, MA 02360
$-2,122
Cash flow
-12.0%
Cash-on-Cash Return
2.9%
Cap rate
0.5%
Rent to Value Ratio
Active
$668,000
3
bds
|
2
ba
|
1,786
sqft
|
built
1973
62 Jan Marie Dr, Plymouth, MA 02360
$-1,848
Cash flow
-14.4%
Cash-on-Cash Return
2.4%
Cap rate
0.4%
Rent to Value Ratio
Active
$549,000
4
bds
|
2
ba
|
1,750
sqft
|
built
1984
9 Lawrence Rd, Plymouth, MA 02360
$-1,055
Cash flow
-10.0%
Cash-on-Cash Return
3.4%
Cap rate
0.6%
Rent to Value Ratio
Active
$547,500
3
bds
|
2
ba
|
1,542
sqft
|
built
1976
22 Presidents Ln, Plymouth, MA 02360
$-876
Cash flow
-8.3%
Cash-on-Cash Return
3.8%
Cap rate
0.6%
Rent to Value Ratio
Active
$625,000
4
bds
|
2
ba
|
2,320
sqft
|
built
1976
16 Jan Marie Dr, Plymouth, MA 02360
$-1,014
Cash flow
-8.5%
Cash-on-Cash Return
3.7%
Cap rate
0.6%
Rent to Value Ratio
Active
$985,000
4
bds
|
3
ba
|
3,739
sqft
|
built
1990
11 April Way, Plymouth, MA 02360
$-2,341
Cash flow
-12.4%
Cash-on-Cash Return
2.8%
Cap rate
0.5%
Rent to Value Ratio
Active
$649,900
3
bds
|
2
ba
|
2,013
sqft
|
built
1965
1150 Long Pond Rd, Plymouth, MA 02360
$-1,119
Cash flow
-9.0%
Cash-on-Cash Return
3.6%
Cap rate
0.5%
Rent to Value Ratio
Active
$549,900
1
bds
|
1
ba
|
720
sqft
|
built
1930
41 Bay Shore Dr, Plymouth, MA 02360
$-1,263
Cash flow
-12.0%
Cash-on-Cash Return
2.9%
Cap rate
0.5%
Rent to Value Ratio
Active
$389,900
1
bds
|
1
ba
|
451
sqft
|
built
1900
13 Whiting St, Plymouth, MA 02360
$-1,301
Cash flow
-17.4%
Cash-on-Cash Return
1.7%
Cap rate
0.5%
Rent to Value Ratio
Active
$799,900
3
bds
|
2
ba
|
2,353
sqft
|
built
1985
45 Curtis Dr, Plymouth, MA 02360
$-1,760
Cash flow
-11.5%
Cash-on-Cash Return
3.0%
Cap rate
0.5%
Rent to Value Ratio
Active
$294,900
2
bds
|
1
ba
|
895
sqft
|
built
1970
9 Chapel Hill Dr, Plymouth, MA 02360
$-611
Cash flow
-10.8%
Cash-on-Cash Return
3.2%
Cap rate
0.8%
Rent to Value Ratio
Active
$849,999
4
bds
|
3
ba
|
4,000
sqft
|
built
2001
2 Gabriel Ln, Plymouth, MA 02360
$-2,008
Cash flow
-12.3%
Cash-on-Cash Return
2.8%
Cap rate
0.5%
Rent to Value Ratio
Active
$869,900
4
bds
|
3
ba
|
2,560
sqft
|
built
2022
8 Cranberry Farm Rd, Plymouth, MA 02360
$-1,749
Cash flow
-10.5%
Cash-on-Cash Return
3.3%
Cap rate
0.6%
Rent to Value Ratio
Active
$589,900
3
bds
|
2
ba
|
1,651
sqft
|
built
1975
34 Bourne Rd, Plymouth, MA 02360
$-839
Cash flow
-7.4%
Cash-on-Cash Return
4.0%
Cap rate
0.6%
Rent to Value Ratio
Active
$898,000
4
bds
|
3
ba
|
3,057
sqft
|
built
2013
35 Nautical Way, Plymouth, MA 02360
$-2,047
Cash flow
-11.9%
Cash-on-Cash Return
2.9%
Cap rate
0.5%
Rent to Value Ratio
Active
$550,000
1
bds
|
2
ba
|
884
sqft
|
built
2016
7 Sever St, Plymouth, MA 02360
$-1,452
Cash flow
-13.8%
Cash-on-Cash Return
2.5%
Cap rate
0.5%
Rent to Value Ratio
Active
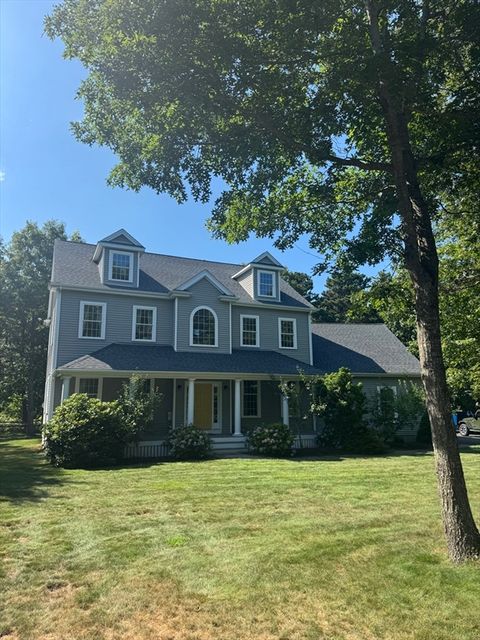
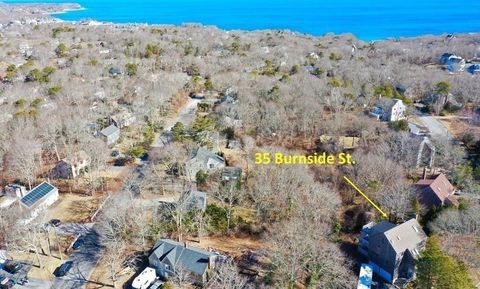
$769,000
3
bds
|
3
ba
|
2,504
sqft
|
built
1985
35 Burnside St, Plymouth, MA 02360
$-1,516
Cash flow
-10.3%
Cash-on-Cash Return
3.3%
Cap rate
0.5%
Rent to Value Ratio
Active
$499,999
2
bds
|
2
ba
|
1,280
sqft
|
built
1900
132 Summer St, Plymouth, MA 02360
$-848
Cash flow
-8.8%
Cash-on-Cash Return
3.6%
Cap rate
0.6%
Rent to Value Ratio
Active
$639,900
2
bds
|
3
ba
|
1,664
sqft
|
built
2022
21 Daisy Ln, Plymouth, MA 02360
$-1,492
Cash flow
-12.2%
Cash-on-Cash Return
2.9%
Cap rate
0.6%
Rent to Value Ratio
Active
$1,595,000
3
bds
|
3
ba
|
3,062
sqft
|
built
2007
116 Ryecroft, Plymouth, MA 02360
$-4,803
Cash flow
-15.7%
Cash-on-Cash Return
2.1%
Cap rate
0.4%
Rent to Value Ratio
Active
$669,000
2
bds
|
2
ba
|
1,521
sqft
|
built
1906
76 Court St, Plymouth, MA 02360
$-2,052
Cash flow
-16.0%
Cash-on-Cash Return
2.0%
Cap rate
0.5%
Rent to Value Ratio
Active
$624,900
2
bds
|
1
ba
|
864
sqft
|
built
1947
88 Beach St, Plymouth, MA 02360
$-1,454
Cash flow
-12.1%
Cash-on-Cash Return
2.9%
Cap rate
0.4%
Rent to Value Ratio